Evaluation of Neutron Emission Rate with FIT3D-DD Code
in Large Helical Device
∗
)
Ryosuke SEKI
1,2), Kunihiro OGAWA
1,2), Mitsutaka ISOBE
1,2), Masayuki YOKOYAMA
1,2),
Sadayoshi MURAKAMI
3), Hideo NUGA
1), Shuji KAMIO
1), Yutaka FUJIWARA
1),
Masaki OSAKABE
1,2)and LHD Experiment Group
1)1)National Institute for Fusion Science, National Institutes of Natural Sciences, Toki 509-5292, Japan 2)SOKENDAI (The Graduate University for Advanced Studies), Toki 509-5292, Japan
3)Kyoto University, Kyoto 615-8540, Japan
(Received 10 January 2019/Accepted 25 April 2019)
We compared the experimentally measured neutron emission rate with the emission rate calculated by us-ing the simple Fokker-Planck equation with the experimental temperature and density profiles, and the deuteron density evaluated by a spectroscopy in peripheral region in LHD. The neutron emission rates evaluated by the FIT3D-DD code are approximately two times higher than experimental results in the typical magnetic configura-tion of LHD. In the case of low fast-ion confinement, the calculaconfigura-tions are approximately four times higher than experimental measurements.
c
2019 The Japan Society of Plasma Science and Nuclear Fusion Research
Keywords: neutron emission rate, simple and fast Fokker-Planck analyses, FIT3D-DD, LHD DOI: 10.1585/pfr.14.3402126
1. Introduction
In the Large Helical Device (LHD), deuterium exper-iments have been performed by using tangentially-injected neutral beams (NBs) with the ∼180 keV deuterium and perpendicularly-injected NBs with the 60 - 80 keV deu-terium [1–4]. In the deudeu-terium experiments, the 2.45 MeV neutrons are generated by the D-D nuclear fusion. The neutron emission rate is measured by the neutron flux mon-itor in the LHD [5, 6]. Since the main component of the neutron emission is the fusion reaction due to fast deuteron produced by NBs in the LHD, the neutron emission rate reflects the fast-ion density in the plasma. It is therefore important for the investigation of a fast-ion confinement to compare the neutron emission rate of the measurements with the numerical calculation.
We have developed a neutron emission evaluation code, FIT3D-DD, with a simple and fast Fokker-Planck analysis. In the LHD, the neutron emission rate before the start of the deuterium experiment is evaluated by using the database of the neutron emission rate with the FIT3D-DD code. The FIT3D-DD code and the database are described in Sec. 2.
It is important for evaluation of neutron emission rate with considering the practical plasma profile and the ra-tio of deuteron in plasma. To introduce the FIT3D-DD code to the transport analysis suite, TASK3D-a [7], we de-signed a new neutron emission rate evaluation tool with
author’s e-mail: [email protected]
∗)This article is based on the presentation at the 27th International Toki
Conference (ITC27) & the 13th Asia Pacific Plasma Theory Conference (APPTC2018).
the experimental temperature and density profiles and the bulk deuteron density evaluated by a spectroscopy in the peripheral region. The new emission rate evaluation tool was applied to the deuterium experiments. The calculated neutron emission rate is compared with the experimental results. In addition, the effective normalized minor radius for neutron emission rate is evaluated in order to investi-gate the slowing down time dependence.
2. Neutron Emission Evaluation Code
Based on the FIT3D Code
2.1
FIT3D-DD code
A neutron emission evaluation code, FIT3D-DD, has been developed from the FIT3D code. The FIT3D code [8] is the heating power profile and fast-ion pressure evalua-tion code with a simple analytical soluevalua-tion of the Fokker-Planck equation. The code is constructed by the combina-tion of the HFREYA, MCNBI, and FIT codes (Fig. 1). In this section, these codes are briefly explained. An evalua-tion method of the neutron emission rate introduced to the FIT code is described.
The HFREYA code can calculate the fast-ion deposi-tion profile of NB with the Monte-Carlo method. In the HFREYA code of the FIT3D code, the position and the simple shape of the ion source of NBs and the focus po-sition of the beam lines are considered. The plasma shape and the density and temperature profiles are evaluated from a mapping with the equilibrium data of the Boozer coordi-nates. The large number of fast neutral particles are traced from the vacuum region to the end of their path length
cal-c
2019 The Japan Society of Plasma
culated by using a random number and the cross section of beam ionization including the charge exchange reaction. As a result, the ionization points of fast-ions are calculated. The cross section fit by Suzukiet al.[9] was introduced to the HFREYA code by P. Vincenzi for application of the deuterium experiments [10].
The MCNBI code is an orbit tracing code with the guiding center equation in the Boozer coordinates. In the MCNBI code of the FIT3D code, many fast-ions are traced for 20µs (five times the toroidal transit time of a 180 keV fast proton produced by tangentially-injected NB) without considering the collision and charge exchange loss. As a result of the short orbit tracing, the deposition profile is changed due to the prompt loss and the initial orbit width.
The FIT code evaluates the heating power profile and the fast-ion pressure by using the simple analytical solu-tion of the Fokker-Planck equasolu-tion. The electron and ion heating ratio are expressed by
Ge=
2 v2 f0 vf 0 vth v3
v3+v3
c
vdv, (1)
and
Gi=
2 v2 f0 vf 0 vth v3 c v3+v3
c
vdv, (2)
respectively. Herevf0andvthare the initial velocity of
fast-ions and the velocity of the thermal fast-ions, respectively.vc=
2Ec/mf,Ecis the critical energy, andmf is the mass of
fast-ions. The critical energy is calculated by
Ec[keV]=Te[keV]
9π 16
mf
me
1/3
mf
mp
Z1
2/3
, (3)
and
Z1=
i
z2
ini
Aine
, (4)
wheremeandmp is mass of electron and proton,
respec-tively. Teis electron temperature, andneandniare
elec-tron and ion densities.ZiandAidenote the ion charge and
Fig. 1 Outline of FIT3D-DD code.
mass number, respectively. The density of the fast-ion is calculated by
Nf = wdepτs E0 vf 0 vth v2
v3+v3
c
dv, (5)
wherewdepis deposition power density andE0is the initial
energy of fast ions. The slowing down time is expressed by
τs=0.12 Te[keV]
3/2
z2
fne[1019m−3]
mf
mp
, (6)
whereZf is the charge of fast ions. In the FIT code of the
FIT3D code,wdep is calculated by the HFREA code and the MCNBI code. The FIT3D code evaluates the heating power profile by using the three codes.
The neutron reaction of beam-bulk D-D reaction is in-troduced to the FIT code. The neutron emission rate evalu-ation code, DD, has been developed. In the FIT3D-DD, the neutron emission rate is evaluated with the density of fast ion produced by NB [Eq. 5] as follows.
ΔRneut= ΔV wdepτs E0 vf 0 vth
σddvi_th−v
×ndfMaxwell(vi_th)dvi_th v
2
v3+v3
c
dv, (7) whereσddis the cross section of the D-D fusion reaction described in Ref. [11]. In the FIT3D-DD, the cross sec-tion is calculated with the relative speed between a bulk deuteron and a beam deuteron.
2.2
Database of neutron emission rate by
using FIT3D-DD
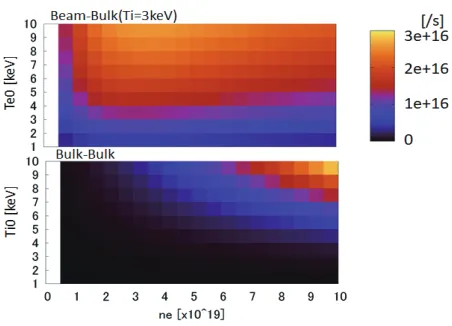
Before the deuterium experiments, the prediction of the neutron emission rate is required for safely conduct-ing experiments in the LHD. Therefore, the database of the neutron emission rate was made by the FIT3D-DD code. Figure 2 shows a sample of the neutron emission rate database. In this database, the typical magnetic con-figuration in LHD (Rax = 3.6 m,γ =1.254) is used and
the field strength is set to be 2.85 T. The pure deuterium plasma is assumed. The temperature and density profiles are given by
Te,i=T0(1−ρ8), [T0=1,· · · ,10 keV], (8)
and
ne=n0(1−ρ2), [n0=0.5,1,· · ·,10×1019m−3].
(9) From Fig. 2, the neutron emission rate of beam-bulk D-D fusion has maximum value near thene=3×10¹⁹m−3.
The neutron emission rate decreases in the higher density region than∼3×10¹⁹m−3. It is seen in Fig. 2 that the neu-tron emission rate increases with the increase in the elec-tron temperature.
3. Evaluation of Neutron Emission
Rate by Using FIT3D-DD
It is important for the investigation of a fast-ion con-finement to compare the neutron emission rate of the mea-surements with the numerical calculation based on the ex-perimental temperature and density profiles. Therefore, the FIT3D-DD code is introduced to the transport analy-sis suite, TAKS3D-a. In the TASK3D-a, the equilibrium magnetic field is identified by using the experimental elec-tron temperature and density profiles. The densities of proton, deuteron, and helium ion are evaluated by using a spectroscopy. The experimental value of the port-through power and the injection energy of NB is used in the FIT3D-DD code of the TASK3D-a. Figure 3 shows the outline of the FIT3D-DD code introduced to the TASK3D-a.
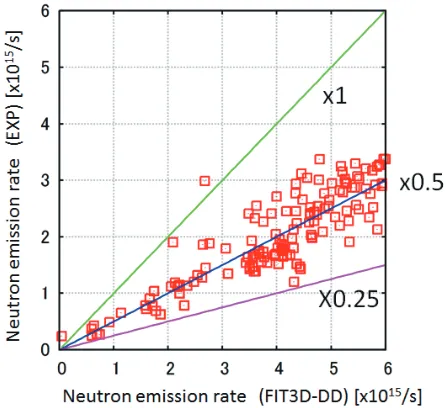
We compare the neutron emission rate calculated by the FIT3D-DD code of the TASK3D-a with measurements at the maximum value of the neutron emission rate. Fig-ure 4 shows the comparison of the neutron emission rate between the FIT3D-DD code and the neutron flux monitor in the case of magnetic axisRax = 3.6 m. It is found in
Fig. 4 that the neutron emission rates evaluated by FIT3D-DD are approximately two times higher than the experi-mental measurements. This overestimate occurs because the impurity carbon ion is ignored. In this case, the density of the bulk deuteron is overestimated because a typically effective ion charge is 2 - 3 in the LHD plasma. The den-sity of impurity carbon ion will be introduced in the near future. In addition, the fast-ion loss for a slowing down process is not included in FIT3D-DD. Therefore, the neu-tron emission rate calculated by the FIT3D-DD code tends to be higher than experimental results.
Next, we compare the FIT3D-DD results with exper-iments in the case of magnetic axisRax=3.75 m andRax
=3.9 m, in which the low confinement of the fast-ion is pointed out [12]. It is found in Fig. 5 that the neutron emission rates evaluated by the FIT3D-DD code are ap-proximately four times higher than the experimental mea-surements in the case of low confinement of fast-ion. The
Fig. 3 Neutron emission evaluation tool in the TASK3D-a.
Fig. 4 Comparison of the neutron emission rate between FIT3D-DD results and neutron flux monitor measure-ments.
overestimation of the neutron emission rate becomes larger than that in theRax=3.6 m. It is more important for
evalu-ation of the neutron emission rate to include the orbit effect properly in the case of the low fast-ion confinement, espe-cially for fast-ions produced by perpendicular NBs. One of these overestimate is caused by fast-ions produced by perpendicular NB. The effect of the orbit tracing time on evaluation of neutron emission rate is discussed in Sec. 4.2.
4. Discussion
4.1
Slowing down time dependence
The neutron emission rate reflects the fast-ion density in the plasma. The difference of the neutron emission rate between the FIT3D-DD and the measurements implies the orbit loss and/or the loss due to the MHD instabilities. We investigated the difference of the neutron emission rate by changing the slowing down time.
ec-(a)Rax=3.75 m
(b)Rax=3.9 m
Fig. 5 Comparison of the neutron emission rate between FIT3D-DD results and neutron flux monitor measure-ments in the case of the low confinement of the fast-ion.
tive normalized minor radius for the neutron emission rate is evaluated from neutron emission rate profiles calculated by the FIT3D-DD code as follows.
ρneut=
ρ×ΔRneutdρ
ΔRneutdρ
, (10)
where ρdenotes the normalized minor radius. ΔRneut is
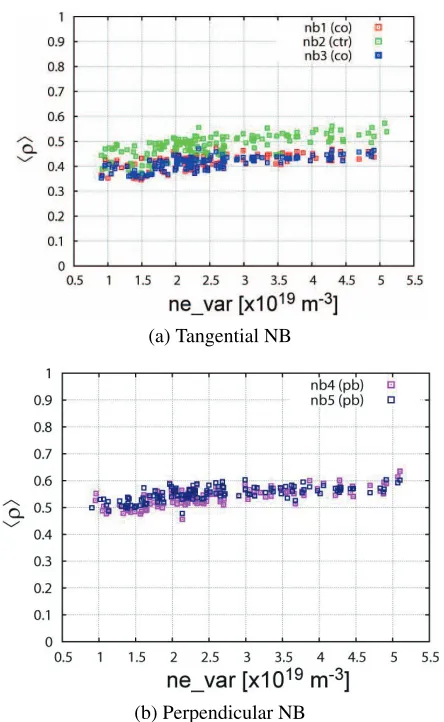
the neutron emission rate inΔρ. Figure 6 shows the ef-fective normalized minor radius in the cases of tangential NB and perpendicular NB. The effective normalized mi-nor radius increases in the higher density region because the number of the fast-ions produced in the peripheral re-gion becomes large. The effective normalized minor radius in the case of the ctr-tangential NB is approximately 0.5 in
(a) Tangential NB
(b) Perpendicular NB
Fig. 6 Effective normalized minor radius for neutron emission rate in the case of (a) tangential NB and (b) perpendicular NB.
the 2×10¹⁹m−3. The effective normalized minor radius in the case of the co-tangential NB becomes smaller than in the ctr-tangential NB case. In addition, the effective nor-malized minor radius in the case of the perpendicular NB is approximately 0.55 in the 2×10¹⁹m−3.
Using the effective normalized minor radius, we in-vestigate the dependence of the slowing down time in the neutron emission rate in the typical magnetic configura-tion of LHD. In Fig. 7, the difference between the FIT3D-DD results and neutron flux monitor measurements be-come larger in the low collision regime. In the low col-lision regime, there is a possibility that the overestimate of FIT3D-DD is caused by fast-ion-driven instabilities be-cause the fast-ion density becomes higher. In the future, the neutron emission rate including the instabilities will be evaluated.
4.2
E
ff
ect of orbit tracing time for
evaluat-ing the prompt loss
Fig. 7 Slowing down time dependency in the difference between FIT3D-DD results and neutron flux monitor measure-ments.
Fig. 8 Neutron emission rate in terms of orbit tracing time in the case of perpendicular NB. Blue, red, and green lines show the neutron emission rate in the case ofRax=3.6 m,
Rax=3.75 m, andRax=3.9 m, respectively.
prompt losses of fast-ions produced by perpendicular NB could not be properly evaluated because the poloidal transit time of trapped fast-ions is much longer than the toroidal transit time of fast-ion produced by tangential NB.
We investigate the effect of orbit tracing time on the neutron emission rate. Figure 8 shows the neutron emis-sion rate in terms of orbit tracing time in the case of per-pendicular NB. In the case ofRax=3.6 m, the orbit tracing
time barely affects the neutron emission rate. On the other hand, in the case ofRax=3.75 m andRax=3.9 m, the
neu-tron emission rate largely decreases until ∼200µs. The neutron emission rate in the case of 20µs is approximately two times higher than that in the case of 200µs. On the other hand, it is pointed out that re-entering fast ion and
the charge exchange loss should be considered in the case of the low fast ion confinement [13]. These effects on the neutron emission rate will be investigated in the near fu-ture. In the case of tangential NB, the neutron emission rate rarely changes independent of the magnetic axis posi-tion.
5. Summary
The neutron emission rate measured in LHD is com-pared with the emission rate calculated by using simple Fokker-Planck equation with the experimental temperature and density profiles, and the deuteron density evaluated by using a spectroscopy in peripheral region.
Since only the prompt loss is considered and the im-purity carbon ion is ignored in the FIT3D-DD code, the calculated neutron emission rate tends to be higher than the experimental results. The neutron emission rate evaluated by the FIT3D-DD code is approximately two times higher than the neutron flux monitor measurements in the typical magnetic configuration of LHD. In the case of low fast-ion confinement, the calculations are approximately four times larger than the experimental measurements.
In order to calculate the slowing down time depen-dence, the effective normalized minor radius for neutron emission rate is evaluated from the results of the IT3D-DD code. It is found that the effective normalized minor radius is approximately 0.5.
Acknowledgments
This work has been supported by the NIFS Collabora-tive Research Program (NIFS07KLPH004).
[1] M. Osakabeet al., Fusion Sci. Technol.72, 199 (2017). [2] Y. Takeiri, IEEE Trans. Plasma Sci.46, 1141 (2018). [3] M. Osakabe et al., IEEE Trans. Plasma Sci. 46, 2328
(2018).
[4] Y. Takeiri, IEEE Trans. Plasma Sci.46, 1141 (2018). [5] M. Isobeet al., Rev. Sci. Instrum.85, 11E114 (2014). [6] M. Isobeet al., IEEE Trans. Plasma Sci.46, 2050 (2018). [7] M. Yokoyamaet al., Nucl. Fusion57, 126016 (2017). [8] S. Murakamiet al., Trans. Fusion Technol.27, 256 (1995). [9] S. Suzukiet al., Plasma Phys. Control Fusion 40, 2097
(1998).
[10] P. Vincenziet al., Plasma Phys. Control Fusion58, 124008 (2016).
[11] J.D. Huba, NRL Plasma Formulary (Naval Research Labo-ratory 2001) p.44.