Three-Dimensional Numerical Analysis of Pressure Driven Mode
in RMP-Imposed LHD Plasma
∗
)
Katsuji ICHIGUCHI
1,2), Yasuhiro SUZUKI
1,2), Masahiko SATO
1), Yasushi TODO
1,2),
Satoru SAKAKIBARA
1,2), Satoshi OHDACHI
1,2)and Yoshiro NARUSHIMA
1,2)1)National Institute for Fusion Science, 322-6 Oroshi-cho, Toki 509-5292, Japan
2)The Graduate University of Advanced Study, Department of Fusion Science, 322-6 Oroshi-cho, Toki 509-5292, Japan
(Received 15 November 2013/Accepted 24 July 2014)
Property of pressure driven modes in Large Helical Device (LHD) plasmas with a resonant magnetic pertur-bation (RMP) is numerically studied. Particularly, we analyze three-dimensional (3D) RMP effects on the linear magnetohydrodynamic (MHD) stability of the modes. For this purpose, 3D numerical codes are utilized for both calculations of an equilibrium including an RMP generating anm=1/n=1 magnetic island and the stability of the perturbations resonant at the
´
ι =1 surface. Here,mandnare the poloidal and the toroidal mode numbers, respectively, and´
ιdenotes rotational transform. Owing to the RMP, the pressure driven mode is localized around the X-point of the island. The type of the mode structure changes from the interchange type to the ballooning type. This property is attributed to the fact that the equilibrium pressure gradient is larger at the X-point than at the O-point.c
2014 The Japan Society of Plasma Science and Nuclear Fusion Research
Keywords: MHD stability, resonant magnetic perturbation (RMP), Large Helical Device (LHD), magnetic is-land, pressure driven mode
DOI: 10.1585/pfr.9.3403134
1. Introduction
Resonant magnetic perturbations (RMPs) destroy nested flux surfaces and generate magnetic islands and stochastic regions in the confinement region of toroidal plasmas. Since pressure gradient is reduced in the regions, the RMPs are focused in the viewpoint of the magne-tohydrodynamic (MHD) stability against pressure driven modes in fusion devices. Particularly in heliotrons, since pressure driven modes are the most dangerous, the change of the pressure gradient due to the RMPs can directly in-fluence the global stability. Therefore, the behavior of the plasma with RMPs is extensively studied in the Large He-lical Devise (LHD) experiments. As one of the experimen-tal results, enlargement of the magnetic islands is observed after the penetration of the RMP in the configuration un-stable against interchange modes [1]. Thus, in the present study, we numerically analyze the stability property of the pressure driven modes in the LHD plasmas under the RMP field.
For the analysis of the effects of RMPs, an equilib-rium with a pressure profile consistent with the magnetic islands and stochastic region is necessary. Recently, Saito et al. studied the effects of the RMPs on interchange modes with a single helicity in a straight LHD configuration [2,3]. They calculated an equilibrium with a locally flat pressure profile in the magnetic island. They found that the linear author’s e-mail: [email protected]
∗)This article is based on the presentation at the 23rd International Toki
Conference (ITC23).
growth rate and the nonlinear saturation level are reduced in the increase of the island width by utilizing the NORM code [4], which is based on the reduced MHD equations. However, their study is limited to the case that the island and the dominant component of the mode have the same mode numbers of (m,n) =(1,1) and the phase difference between the island and the mode structure is fixed.
Thus, in the present study, we treat a three-dimensional (3D) LHD configuration to enlarge the free-dom in the mode numbers and the phase difference as well as the geometry. For this purpose, we utilize the HINT2 [5] and the MIPS [6] codes for the equilibrium and the MHD stability calculations, respectively. The HINT2 code finds a 3D MHD equilibrium without an assumption of the exis-tence of nested surfaces. Therefore, we obtain a 3D equi-librium including magnetic islands due to the RMPs with a consistent pressure profile. The MIPS code solves the full MHD equations as an initial value problem, in which the 4-th order finite difference method is employed. By us-ing these codes, we examine the effect of the RMP on the linear growth rate and the mode structure of the pressure driven modes.
2. 3D LHD Equilibrium Including
RMP
MHD equilibria of an LHD plasma with and without an RMP are calculated with the HINT2 code [5]. In the present study, we employ a configuration with the param-eters ofRax=3.60 m andγc=1.13. HereRaxandγcare
c
2014 The Japan Society of Plasma
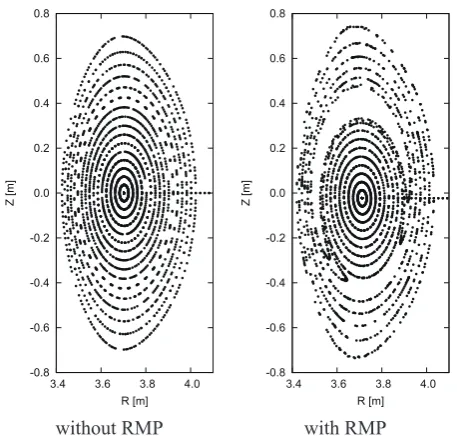
Fig. 1 Puncture plots of the field lines atφ=0 cross section in the LHD equilibria.
Fig. 2 Profile of rotational transform of the equilibrium without RMP as a function of the average minor radiusrav.
the horizontal position of the vacuum magnetic axis and the pitch parameter of the helical coils, respectively. The constraint of no net toroidal current is employed. This configuration has an
´
ι = 1 surface and a strong mag-netic hill at the surface in vacuum. The pressure pro-file ofpeq = p0(1−s)(1−s4) with the beta at themag-netic axis ofβ0 =4% is assumed in the case without the
RMP, where sdenotes the normalized toroidal magnetic flux. The equilibrium with the RMP is obtained by in-cluding a small constant magnetic fieldδBeR(φ = 129◦)
in the same procedure of the calculation without the RMP. HereeR(φ =129◦) is the unit vector in theR-direction at
φ=129◦in the (R, φ,Z) coordinates. As the amplitude of the RMP,δB/Bt=3.0×10−4is used.
Figure 1 shows the puncture plots of the magnetic field lines at theφ = 0 cross section. Nested flux surfaces are obtained in the whole region of the plasma in the case
with-Fig. 3 Bird’s eye view of the pressure profile in the equilibria without RMP (upper) and with RMP (bottom)s atφ=0 cross section.
Fig. 4 Pressure profile of the equilibria without RMP (blue) and without RMP (red) along the R = const. line passing through the magnetic axis onφ=0 cross section.
3. E
ff
ects of RMP on Pressure Driven
Mode
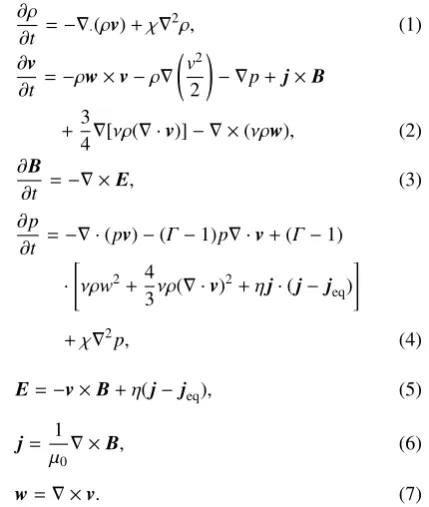
The stability of the equilibria is examined with the MIPS code [6]. This code solves the full MHD equations of
∂ρ
∂t =−∇·(ρv)+χ∇
2ρ, (1)
∂v
∂t =−ρw×v−ρ∇
v2
2
− ∇p+j×B
+3
4∇[νρ(∇ ·v)]− ∇ ×(νρw), (2) ∂B
∂t =−∇ ×E, (3)
∂p
∂t =−∇ ·(pv)−(Γ−1)p∇ ·v+(Γ−1)
·
νρw2+4
3νρ(∇ ·v)
2+ηj·(j−j eq)
+χ∇2p, (4)
E=−v×B+η(j−jeq), (5)
j= 1
μ0∇ ×
B, (6)
w=∇ ×v. (7)
The resistivityη/μ0, the viscosityνand the heat
conduc-tivityχare normalized byvARcnt, whereμ0andvAare the
vacuum permeability and the Alfvén speed, respectively, andRcnt is the normalization length corresponding to the
major radius, which fixed as Rcnt = 3.65 m. The values
of the resistivity and the heat conductivity are assumed to beη/μ0 = 10−6 andχ = 10−6 in the present study,
re-spectively. The numbers of the calculation grid are 128, 128 and 640 for the directions ofR,Zandφ, respectively. These grid numbers are large enough to express the mode structures discussed below. By following the time evolu-tion according to the equaevolu-tions we obtain the stability prop-erty.
In this study, we focus on the behavior of the modes in the linear phase. Figure 5 shows the mode pattern of the pressure perturbation atφ =0 cross section forν=10−5. In the case without the RMP, a mode withm=5 resonant at the
´
ι=1 surface is dominantly destabilized. The pattern is distributed with almost the same amplitude and an al-most equal distance in the poloidal direction. These prop-erties imply that the mode is a typical interchange mode.On the other hand, in the case with the RMP for the same viscosity, the mode is localized around the X-point like a ballooning mode. The amplitude at the O-point is quite small. This localization is attributed to the defor-mation of the equilibrium pressure profile in the poloidal direction. In the magnetic island, the pressure gradient is much larger at the X-point than at the O-point as shown in Fig. 4. Therefore, the mode can utilize the driving force ef-fectively by being localized around the X-point rather than
Fig. 5 Mode pattern of pressure perturbation with the puncture plot of the magnetic field lines in the cases with (right column) and without (left column) RMP forν=10−5.
Fig. 6 Dependence of linear growth rateγon viscosityν.
being distributed with equal distance in the poloidal direc-tion. Figure 6 shows the linear growth rate of the most unstable mode in the cases with and without the RMP. As shown in this figure, the growth rate is larger than that in the case without the RMP. This is due to the facts that the mode is localized around the X-point and that the pressure gradient at the X-point is enhanced by including the RMP as shown in Fig. 4.
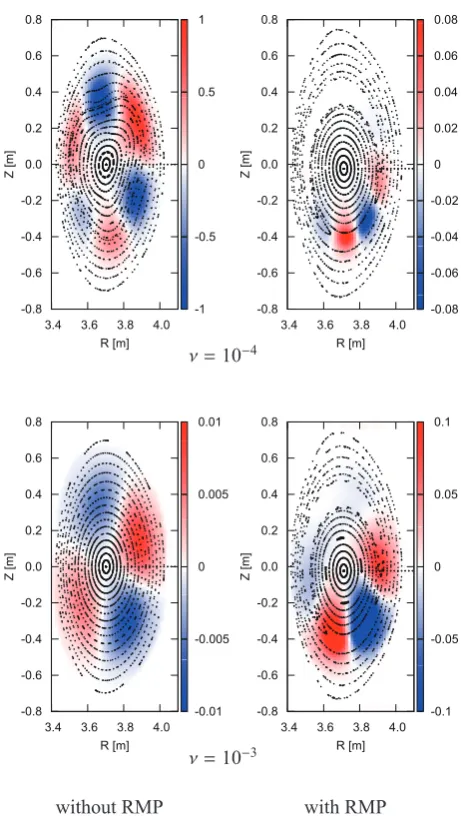
Fig. 7 Mode pattern of pressure perturbation with the puncture plot of the magnetic field lines forν=10−4(upper row) andν=10−3(bottom row). in the cases with (right col-umn) and without (left colcol-umn) RMP.
the localization of the mode in the case with the RMP. For the confirmation of this theoretical expectation, the viscosity is changed from ν = 10−5 to ν = 10−3. Figures 6 and 7 shows the dependence of the growth rate on the viscosity and the mode patterns, respectively. As the viscosity is increased, in the case without the RMP, the mode number is decreased tom = 3 for ν = 10−4 and m = 2 for ν = 10−3 and the growth rate is decreased as shown in Fig. 6. In the case with the RMP, on the other hand, the mode still has a structure localized around the X-point even for the case ofν=10−3. However, the
spa-tial structure in the poloidal direction is extended toward the O-point as the viscosity is increased. This is due to the reduction of the higher mode amplitude. Because of the extension in the poloidal direction, the mode cannot avoid the small pressure gradient region. Therefore, the average driving force over the mode region is reduced. That is, the mode is stabilized by not only the viscosity itself but
also the reduction of the driving force. As a result, the dif-ference of the growth rate between the cases without and with the RMP decreases as the increase of the viscosity as shown in Fig. 6, although the growth rate in the case with RMP is still larger than that in the case without the RMP forν=10−3.
The results for ν = 0 are also obtained in the both cases with and without the RMP. The differences in the mode structure and the growth rate are small between the cases ofν=10−5andν=0. The dominant mode number
shown in the mode structure is the same. The growth rates are just 1.33 times and 1.48 times of those forν=10−5in
the cases with and without the RMP, respectively. These growth rates are smaller than those estimated from the re-sults ofν=10−4andν=10−5. These small differences are
considered to be attributed to the fact that the effect of the numerical viscosity is large in the region ofν <10−5. As
for the case ofν=10−5, the effect of the numerical
viscos-ity is not considered to be significant, because the tendency of the changes in the growth rate and the mode number in the region 10−5 ≤ ν ≤ 10−4 is similar to that in the
re-gion 10−4 ≤ ν ≤ 10−3, as shown in Figs. 6 and 7. Thus,
in the above study, the viscosity range of 10−5≤ν≤10−3
is employed so that theν-dependence of the mode appears prominently without the numerical influence.
In a large viscosity case, there is possibility that the viscosity heating may affect the results. For the evaluation of the effect, the calculations without the terms ofνρw2and
4
3νρ(∇ ·v)2in eq. (4) are conducted in the case ofν=10−3.
As a result, it is obtained that the differences are quite small between the numerical results with and without the viscos-ity heating terms in both cases without and with the RMP. The differences in the plots of the mode structures are too small to be distinguished. The relative differences in the growth rates are less than 0.2%. Therefore, it is confirmed that the viscosity heating effect is negligible in the present analysis.
4. Summary
The effect of the RMP-induced magnetic island on the pressure driven mode that is resonant at the same res-onance surface in an LHD equilibrium is analyzed with 3D numerical calculations. The existence of the RMP en-hances and reduces the equilibrium pressure gradient at the X-point and the O-point, respectively. This deformation of the pressure profile modifies the mode structure so that the mode is localized around the X-point where the pres-sure gradient is the largest. As a result, the mode structure changes from the interchange type to the ballooning-like type.
re-gion. Therefore, the mode with the RMP is more stabilized than that without the RMP and the difference of the growth rates is reduced. This stabilizing mechanism is found in the region of the viscosity that may be larger than that in high temperature plasmas, however, it is expected that the mechanism is also valid for smaller viscosity. The direct confirmation in the small viscosity region with the reduc-tion of the numerical effect is a future work.
In the present analysis, a large heat conductivity par-allel to the magnetic field is not taken into account. For the precise comparison with the experimental results, it is nec-essary to include the effect of the large parallel heat con-ductivity. Appropriate parallel heat conductivity may have a stabilizing contribution to the pressure gradient modes. However, it is expected that the RMP imposition similarly changes the mode structure even in the case with a large parallel heat conductivity, because the change of the mode structure occurs mainly in the direction perpendicular to the magnetic field.
On the other hand, nonlinear analyses are necessary as well. There are some previous works treating the nonlinear behavior of heliotron plasmas with RMPs in the cylindri-cal geometry. Garcia et al. [9, 10] showed an oscillation behavior of the magnetic islands and Saito et al. [3, 11] found the change of the island width after the saturation of interchange modes. It will be also interesting to investi-gate 3D effects on these nonlinear results by extending the treatment utilized in the present study.
Acknowledgments
This work was supported by a budget NIFS13KNST053 of National Institute for Fusion Science (NIFS) and Grant-in-Aid for Scientific Research (C) 22560822 of Japan Society for Promotion Science. Super computers, Plasma Simulator in NIFS and Helios in the Computational Simulation Center of the International Fusion Energy Research Center (IFERC-CSC), were utilized for the numerical calculations.
[1] S. Sakakibara et al., Plasma Phys. Control. Fusion 55, 014014 (2013).
[2] K. Saito, K. Ichiguchi and R. Ishizaki, Plasma Fusion Res. 7, 2403032 (2012).
[3] K. Saito, K. Ichiguchi and R. Ishizaki, Plasma Fusion Res. 7, 1403156 (2012).
[4] K. Ichiguchi, N. Nakajima, M. Wakatani, B.A. Carreras and V.E. Lynch, Nucl. Fusion43, 1101 (2003).
[5] Y. Suzukiet al., Nucl. Fusion46, L19 (2006).
[6] Y. Todoet al., Plasma and Fusion Res.5, S2062 (2010). [7] B.A. Carreras, L. Garcia and P.H. Diamond, Phys. Fluids
30, 1388 (1987).
[8] K. Ichiguchi, J. Plasma Fusion Res. SERIES3, 576 (2000). [9] L. Garcia, B.A. Carreras, V.E. Lynch, M.A. Pedrosa and C.
Hidalgo, Phys. Plasmas8, 4111 (2001).
[10] L. Garcia, B.A. Carreras, V.E. Lynch and M. Wakatani, Nucl. Fusion43, 553 (2003).