2965
Volume LXI 332 Number 7, 2013
http://dx.doi.org/10.11118/actaun201361072965
HIGH-FREQUENCY DATA AND
THE EFFECTIVENESS OF THE SPOT
EXCHANGE RATE EUR/USD
Petr Zeman, Martin Maršík
Received: April 11, 2013
Abstract
ZEMAN PETR, MARŠÍK MARTIN: High-frequency data and the eff ectiveness of the spot exchange rate EUR/ USD. Acta Universitatis Agriculturae et Silviculturae Mendelianae Brunensis, 2013, LXI, No. 7, pp. 2965–2971
The boom of information technology in recent years signifi cantly infl uenced the development of the fi nancial markets. Financial markets have become accessible to the public, and increased demand for fi nancial instruments is inevitably refl ected in the advanced menu of securities dealers who currently off er a wide variety of investment in the underlying assets and through fi nancial leverage allows investors to profi t from tiny price changes of the underlying asset. Shortening of trading period and increasing the frequency of the trades clearly contributes to the growth of profi ts of securities dealers. The question remains whether this trading method off ers the advantage to the investor himself, and whether the investor is able to take advantage of potential market ineffi ciencies to achieve above-average profi ts in the short term period. Therefore, this paper analyzes the behaviour of the spot exchange rate EUR/USD within a day, and through statistical tests examining the validity of the random walk hypothesis for the 5-minute, hourly, 4-hourly and daily changes in the spot exchange rate of the currency pair EUR/USD.
foreign exchange market, EUR/USD, high-frequency data, market effi ciency
The issue of the behaviour of spot exchange rates in the foreign exchange market is a widely discussed topic within the professional community. One of the theories explaining the behaviour of exchange rates and prices of fi nancial assets in the capital markets in general is the effi cient market hypothesis. The hypothesis is connected to Eugene Fama (1969), who proposed three types of effi ciency defi ning an effi cient market as a market, where prices fully refl ect available information.
The main goal of the paper is to prove randomness of price changes, or vice versa confi rm the existence of dependencies between changes in exchange rates, which could be used to achieve above-average profi ts. The authors focus primarily on the eff ectiveness of foreign exchange market and specifi cally analyze the behavior of spot exchange rate EUR/USD in a very short time intervals through autocorrelation test and variance ratio test. These statistical methods testing relations between changes in the exchange rates have been appearing
pairs in the research. Chang (2004) repeated this test for daily changes in these courses and found ineffi ciencies only within the JPY/USD pair. So far, most of published papers verifi ed the random walk hypothesis for daily price changes. However, with the increasing availability of high-frequency data, a professional attention has turned to the analysis of intra-daily exchange rate behaviour.
Therefore, in addition to daily changes in the exchange rate of EUR/USD the 5-minute, 1-hour and 4-hour changes will be analyzed in spot foreign exchange rates. Intra-daily exchange rate effi ciency is usually tested through another result of effi cient market – possibilities to achieve above-average profi ts. Such as in Neely and Weller (2003) genetic programming was employed to predict the development of half-hourly price changes for CHF, DEM, JPY and GBP against to American dollar in 1996. The models considering trading hours and transaction costs failed to provide above-average income and failed to disprove the hypothesis of weak form of effi ciency of the foreign exchange market during intra-daily trading. The method of genetic programming based on technical indicators was applied by Dempster (2001), who tried to use this method to predict the behaviour of the 15-minute returns of exchange rate for the GBP/USD pair. When the author has calculated transaction costs in the model, this method was not able to achieve above-average profi ts. The same fi ndings were revealed by Curcio et al. (1997) who applied the fi lter tests to “tick by tick” data1 for currency pairs of the DEM, JPY, GBP against the USD. Observations decomposed into two time intervals, and concluded that the use of fi lter tests on the high-frequency data does not gain more than the average for an investor. Therefore, we can assume that even intra-daily behaviour of exchange rates cannot be predicted based on historical data therefore such data are not dependent on each other. This assumption will be verifi ed by statistical tests published in this paper.
METHODS AND RESOURCES
Data
To test the eff ectiveness of the EUR/USD currency pair daily, 4-hourly, hourly and 5-minute returns were used. The data used in this study come from the data centre of MetaQuotes So ware Corp. available on X-Trade Brokers Czech Republic’s web site. Each time series contained approximately 10,000 values, it represented a time zone for a 5-minute time period from 01. 01. 2011 to 28. 02. 2011, at the hour time zone from 03. 07. 2009 to 28. 02. 2011 and 4-hourly change interval from 22. 09. 2004 to 28. 02. 2011. For daily time zone an interval from August 11, 2003 to February 28, 2011 was studied with 2000 values only.
Autocorrelation tests
Autocorrelations are o en used to test the effi cient market hypothesis. If the effi cient market hypothesis applies, a price of the asset absorbs newly incoming information quickly and without unnecessary delays, which results in a new market-clearing price. If new information comes randomly, exchange rate changes in fi nancial assets will also be random and independent.
Linear dependence of members of a time series can be analysed using the autocorrelation function.
1
2
1
n k
t t k
t
k n
t t
r r r r
r r
The correlation coeffi cient stands for a degree of relation between past rt−k and the current return
rt, where k represents a “time shi ”. The higher
absolute value of the correlation coeffi cient implies a higher correlation between current and lagged members of a time series and increases the probability of an ineffi cient market, and vice versa. As the variability of price changes of fi nancial assets (returns) is an increasing function of the price of these assets, it is necessary to adjust the price changes using a logarithmic transformation.
-1
-1 -1
= ln t = ln - ln t -1
t t t
t t
p p
r p p
p p
In testing the character of the time series, it is necessary to defi ne testing hypothesis and confi dence interval for individual correlation coeffi cient. It can be argued that the market is effi cient if there is no linear dependency between the prices of securities. Defi ned as:
H0 : k = 0 HA : k ≠ 0
In addition to testing of autocorrelation coeffi cients for the various lags a single hypothesis that all autocorrelation coeffi cients for varying the lags length in the time series are simultaneously equal to zero can be tested.
H0 : 1 = 2 = … = m = 0
HA : k ≠ 0 for k 1, … m
In such cases, Ljung and Box (1978) defi ned test statistic, where N represents the sample size, m is the number of tested lags and indicates the individual autocorrelation coeffi cient for lag k.
2
1
ˆ ( 2)
m k k Q N N
N k
The test statistic Q is compared to the chi-square distribution with m degrees of freedom. The null hypothesis H0 of residue randomness is rejected if the test statistic lies within the critical region.
Q > 2 1−, m
Variance ratio test
The variance ratio test was defi ned by Lo a MacKinlay (1989). This test is based on the defi nition of the random walk, where the variance of returns is a linear function of time. For example, the variance of return logarithms for two days k = 2 must be equal to twice the variance of logarithms of daily returns. The ratio of variance VR (k) is defi ned as follows:
2
2
( ) ( )
(1)
k
VR k
,
where 2(k) is the variance of returns calculated from
periods with the length of the k divided by the length of time q. 2(1) is a variance of returnscalculated
from the immediately consecutive prices, see Lo and MacKinlay (1989):
22
1 1
1 ˆ 1 ˆ
( ) t t ... t k T ln - lnt t-k
-t k
k r r r k p p k
m m
T
t1
22
-1
=1 =1
1 1
ˆ ˆ
(1) = - = ln - ln -( -1) ( -1)
T T
t t t
t t
r p p
T T
,where
= - +1 1-k
m k T k
T
0
1
ˆ = lnpT- lnp
T
p0 and pT are the fi rst and the last values of the price
time series. The random walk hypothesis can be rejected if the variance ratio is equal to one2:
H0 : VˆR(q) = 1
HA : VˆR(q) ≠ 1.
Using this test the correlation of price changes (returns), but also other forms of non-linear
dependence are possible to be tested. This test is applicable to all forms of random walks. However, there is a need to consider two diff erent test statistics – z (q) for constant variance (homoskedasticity) of exchange rate changes and * (q) for variable variance (heteroskedasticity) of exchange rate changes. Test statistics z (q) and * (q) asymptotically follow normal standard distribution and are defi ned as follows.
Test statistic derived for price changes with a constant variance is defi ned as:
( )-1 ( ) = ~ (0,1)
( )
VR q
z q N
q
2(2 -1)( -1) ( ) =
3 ( )
q q
q
q nq
.
Test statistic derived for price changes with a variable variance is defi ned as:
( )-1 *( ) = ~ (0,1)
*( )
VR q
z q N
q
-1
2 =1
2( - ) ˆ *( ) = [ ] ( )
q
j q j
q j
q
2 2
1 1
= +1
2 2 -1 =1
ˆ ˆ
ln ln ln - ln
-ˆ( )=
ˆ
ln - ln
-nq
t t t-j
t-j-t j
nq
t t
t
p p p p
j
p p
When using test statistics (q) it is necessary to know, that it has been defi ned for the hypothesis RW1 and is therefore it is necessary to test that the logarithm increments of exchange rates increases are based on the same probability distribution of IID additionally. In contrast, the independence, or un-correlation is signifi cant enough using the z’(q), statistic applicable for RW2 and RW3 hypotheses.
RESULTS AND DISCUSSION
Tab. I revealed the descriptive characteristics of the 5-minute, 1-hours, 4-hours and daily changes in the exchange rate, defi ned as the diff erence between the logarithms of the closing exchange rates of a current and previous period - Ln(Close1)-Ln(Close0). Daily changes in the exchange rate of EUR/USD were infl uenced by the depreciation of the U.S. dollar in the reference period. It is evident from the positive daily average returns. The long-term trend probably infl uenced returns in shorter periods as well. Only a 1-hour average exchange rate of the EUR/USD changes revealed the opposite value compared to
daily returns probably due to diff erent lengths of the research periods for diff erently long exchange rate changes. Variability of changes in spot exchange rates, as measured by standard deviation, increased for all of the observed rates along with the length of exchange rate changes. The probability distribution of exchange rate changes revealed a high degree of kurtosis in all measured returns compared to normal distribution. Kurtosis coeffi cient of the highest value was revealed for 1-hour returns and the lowest value was observed in daily returns.
The last column showed the Jarque-Bera test statistic, which rejected the hypothesis of normal distribution. This phenomenon was also revealed by 1–4 fi gures. Changes in spot exchange rates revealed of the extreme number of small changes and also a higher number of extreme values, which was refl ected in fat tails of the observed distribution compared to normal distribution.
Autocorrelations
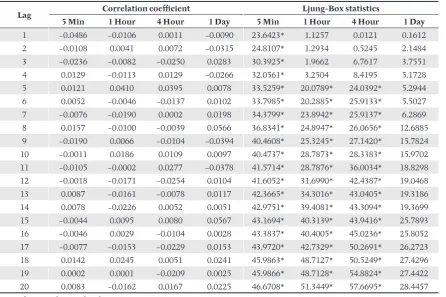
Tab. II revealed results of tests testing linear dependency of exchange rate returns. The fi rst half of the table described the values of the correlation
I: Descriptive statistics for ln exchange rate returns of EUR/USD
Return Number Mean return Risk Skewness Kurtosis Jargue-Bera test
5 min 9,999 0.000003 0.000176 0.265319 6.000739 15101.47*
1 hour 9,999 −0.000001 0.000625 −1.229088 42.873753 767552.58*
4 hour 9,999 0.000005 0.001173 −0.166935 8.977062 33583.20*
1 day 1,999 0.000042 0.002914 −0.001480 2.104297 365.93*
* significant at the 0.01 level Source: authors’calculation -0 ,0 0 0 7 6 -0 ,0 0 0 6 4 -0 ,0 0 0 5 2 -0 ,0 0 0 4 0 -0 ,0 0 0 2 8 -0 ,0 0 0 1 7 -0 ,0 0 0 0 5 0, 00 007 0, 00 019 0, 00 031 0, 00 043 0, 00 054 0, 00 066 0, 00 078
Log(Close1)-Log(Close0)
0 200 400 600 800 1000 1200 1400 1600 1800 2000 2200 Po þ e t poz o ro vání N u m b er of obs e rv ati o n
1: Histogram of log returns EUR/USD 5-Min
-0 ,0 0 3 0 0 -0 ,0 0 2 5 0 -0 ,0 0 2 0 0 -0 ,0 0 1 5 0 -0 ,0 0 1 0 0 -0 ,0 0 0 5 0 0, 00 000 0, 00 050 0, 00 100 0, 00 150 0, 00 200 0, 00 250 0, 00 300
Log(Close1)-Log(Close0)
0 200 400 600 800 1000 1200 1400 1600 1800 2000 2200 2400 2600 Po þ et p o zo ro vá n í N u m b er of obs e rv ati o n
2: Histogram of log returns EUR/USD 1-Hour
-0 ,0 0600 -0 ,0 0480 -0 ,0 0360 -0 ,0 0240 -0 ,0 0120 0, 00 000 0, 00 120 0, 00 240 0, 00 360 0, 00 480 0, 00 600
Log(Close1)-Log(Close0)
0 200 400 600 800 1000 1200 1400 1600 1800 2000 2200 2400 Po þ et p o zo ro vá n í N u m ber of obs e rv ati o n
3: Histogram of log returnsEUR/USD 4-Hour
-0 ,0 1000 -0 ,0 0800 -0 ,0 0600 -0 ,0 0400 -0 ,0 0200 0, 00 000 0, 00 200 0, 00 400 0, 00 600 0, 00 800 0, 01 000
Log(Close1)-Log(Close0)
0 50 100 150 200 250 300 350 400 Po þ et p o zo ro vá n í N u m ber of obs er vati on
coeffi cient for 1 to 20 lag. Correlation coeffi cients showed very low values. All values of coeffi cients were less than 0.1. But Ljung-Box test showed a signifi cant negative dependence within 5-minute exchange rate changes with lag 1 and within 1-hour and 4-hour exchange rate changes with lag 5 was prove positive linear dependence. Negative correlation of 5-minute returns of currency pairs or equities with a time lag were described by Lo and Mackinlay (1990), Baillie and Bollerslev (1991) and Neely and Weller (2003). The eff ect is explained by asynchronous trading. Asynchronous trading is typical for less liquid markets, with accumulation of trading orders in some intervals, alternated with intervals with realizing some of those orders. Zero change in the rate is followed by a positive change, and if there is trade realized in the next period another zero change will follow. Although the foreign exchange markets are characterized by high liquidity, this eff ect may occur especially at night. Negative correlations in short time intervals can be infl uenced by the “ask-bid bounce eff ect which occurs when orders to buy and sell currencies shi and the market price fl uctuates between demanded and off ered price. Positive autocorrelation for the hourly and four-hourly returns of lag 5 might be due to the time lag in trading hours of diff erent business centres. The eff ect was described by Bredon and Ronaldo (2011), who argued that the fl ow of orders to buy and sell currencies and their returns was not
aff ected by asynchronous information, but it is the diff erence between trading hours in Europe and the USA.
Variance ratio test
Tab. III revealed the results of the variance ratio test, which had considered nonlinear relations between spot exchange rate returns. Periods with length of two, fi ve, ten and twenty were successively applied for this test. Random walk of RW1 type supposing constant mean value, homoskedasticity and IID returns was tested in the fi rst part of the table. For longer time series, however, we can assume neither constant mean value nor homoskedasticity. That’s why the other half of the table tested random walks of RW2 and RW3 type for which the assumption of independent returns was suffi cient.
A strict defi nition of random walk of the RW1 type, rejected the hypotheses of a random walk at the signifi cance level of 0.01 in three cases for 5-minute price change for the length of the period of two, fi ve and ten. Testing the random walk hypothesis for the RWE2 and RWE3 the null hypotheses of a random walk were rejected in two cases for 5-minute returns with the length of two and fi ve. Behaviour one and four-hourly and daily return was consistent with the random walk. The result agrees to Charles and Darne’s (2011) fi ndings that proved the independence of daily and weekly
II: Autocorrelations of ln returns to EUR/USD exchange rate
Lag Correlation coeffi cient Ljung-Box statistics
5 Min 1 Hour 4 Hour 1 Day 5 Min 1 Hour 4 Hour 1 Day
1 −0.0486 −0.0106 0.0011 −0.0090 23.6423* 1.1257 0.0121 0.1612
2 −0.0108 0.0041 0.0072 −0.0315 24.8107* 1.2934 0.5245 2.1484
3 −0.0236 −0.0082 −0.0250 0.0283 30.3925* 1.9662 6.7617 3.7551
4 0.0129 −0.0113 0.0129 −0.0266 32.0561* 3.2504 8.4195 5.1728
5 0.0121 0.0410 0.0395 0.0078 33.5259* 20.0789* 24.0392* 5.2944
6 0.0052 −0.0046 −0.0137 0.0102 33.7985* 20.2885* 25.9133* 5.5027
7 −0.0076 −0.0190 0.0002 0.0198 34.3799* 23.8942* 25.9137* 6.2869
8 0.0157 −0.0100 −0.0039 0.0566 36.8341* 24.8947* 26.0656* 12.6885
9 −0.0190 0.0066 −0.0104 −0.0394 40.4608* 25.3245* 27.1420* 15.7824
10 −0.0011 0.0186 0.0109 0.0097 40.4737* 28.7873* 28.3383* 15.9702
11 −0.0105 −0.0002 0.0277 −0.0378 41.5714* 28.7876* 36.0034* 18.8298
12 −0.0018 −0.0171 −0.0254 0.0104 41.6052* 31.6990* 42.4387* 19.0468
13 0.0087 −0.0161 −0.0078 0.0117 42.3665* 34.3016* 43.0405* 19.3186
14 0.0078 −0.0226 0.0052 0.0051 42.9751* 39.4081* 43.3094* 19.3699
15 −0.0044 0.0095 0.0080 0.0567 43.1694* 40.3139* 43.9416* 25.7893
16 −0.0046 0.0029 −0.0104 0.0028 43.3837* 40.4005* 45.0236* 25.8052
17 −0.0077 −0.0153 −0.0229 0.0153 43.9720* 42.7329* 50.2691* 26.2723
18 0.0142 0.0245 0.0051 0.0241 45.9863* 48.7127* 50.5249* 27.4296
19 0.0002 0.0001 −0.0209 0.0025 45.9866* 48.7128* 54.8824* 27.4422
20 0.0083 −0.0162 0.0167 0.0225 46.6708* 51.3449* 57.6695* 28.4457
rates of the EUR/USD. The variance ratio test revealed that the exchange rate of the EUR/USD is ineffi cient only in very short time intervals and that it is able to absorb new information within one hour since their publishing. Therefore, the random walk hypothesis condition has already been fulfi lled for hourly returns.
CONCLUSION
Ljung-Box test and Variance ratio test consistently reject the null hypothesis of a random walk in 5-minute exchange rate changes and pointed to the existence of a negative relationship between immediately successive exchange rate changes,
which were most likely due to asynchronous trading. Ljung-Box test to a lesser extent, demonstrated a statistically signifi cant correlation with a 1-hourly and 4-hourly exchange rate changes. Although statistical tests indicate ineffi ciency of the foreign exchange market in the short term, it is necessary to consider the extent to which the test results were aff ected as the sample size or the chosen level of signifi cance. Remains a question, whether positive correlation are strong enough and stable enough that they can be used to predict the future development of the foreign exchange rate and achieve above average earnings. This issue will be the subject of further research of both authors.
III: Variance ratio test of ln returns to EUR/USD exchange rate
Return VR
Period lenght (q)
RW1 RW2 (3)
2 5 10 20 2 5 10 20
5-Min Ratio diff . 0.951 0.896 0.893 0.880 0.951 0.896 0.893 0.880
VR stat −4.842* −4.737* −3.154* −2.395 −3.519* −3.418* −2.337 −1.837
1-Hour Ratio diff . 0.989 0.977 0.987 0.970 0.989 0.977 0.987 0.970
VR stat −1.049 −1.023 −0.372 −0.593 −0.809 −0.831 −0.317 −0.526
4-Hour Ratio diff . 1.001 0.996 1.021 1.026 1.001 0.996 1.021 1.026
VR stat 0.129 −0.164 0.622 0.535 0.090 −0.119 0.450 0.388
1-Day Ratio diff . 0.991 0.963 0.986 1.050 0.991 0.963 0.986 1.050
VR stat −0.370 −0.751 −0.183 0.450 −0.306 −0.605 −0.147 0.361
* significant at the 0.01 level Source: authors’ calculation
SUMMARY
Therefore, this paper analyzed the behaviour of the spot exchange rate EUR/USD within a for 5-minute, hourly, 4-hourly and daily changes. The aim of the paper was to describe the distribution of returns in time intervals using autocorrelation and variance ratio tests and to assess of the condition of low-effi ciency is fulfi lled even for short-time intervals.
Distribution of the returns in exchange rates was symmetric for all the observed lengths with higher degree of kurtosis compared to normal distribution. Degree of skewness for all lengths of returns was close to zero, indicating the absence of long-term trend. High degree of kurtosis (the highest rate of kurtosis was recorded for hourly returns) was the evidence of a large number of small price changes and continuous adaptation to new internal value.
The variance ratio test revealed that hourly, 4-hourly and daily changes in the spot exchange rate EUR/USD were independent fulfi lling the conditions of weak market effi ciency. The random walk hypothesis was rejected only for 5-minute returns. This fact was also confi rmed by autocorrelation tests, which revealed a signifi cant dependence on the length of the lag 1. Negative autocorrelation for two immediately consecutive 5-minute returns can be explained by asynchronous trading especially at night, and partly also by bid-ask bounce eff ect. Tests of autocorrelation, unlike the ratio variance test proved a possible relation between hourly and 4-hourly returns with the length of lag of fi ve. This dependence was most likely caused by a shi in trading hours between Europe and the USA.
REFERENCES
BAILLIE, R. T., BOLLERSEV, T., 1991: Intra-day and Inter-market Volatility in Foreign Exchange Rates, Review of Economic Studies, 58, 3: 565–585. ISSN 0034-6527.
BREEDON, F., RONALDO, A., 2010: Intraday patterns in FX returns and order fl ow, Swiss National Bank Working Papers, 1–28. Available from: http://www.snb.ch/n/mmr/reference/working_ paper_2011_04/source.
BURT, J., KEEN, F. R., BOOTH, G. G., 1979: Foreign Exchange Market Effi ciency Under Flexible Exchnage Rates. The Journal of Finance, 32, 4: 1325– 1330. ISSN 1540-6261.
CHANG, Y., 2004: A re-examination of variance-ratio test of random walks in foreign exchange rates, Applied Financial Economics, 14, 9: 671–679. ISSN 0960-3107.
CHARLES, A., DARNE, O., 2009: Testing for random walk behavior in euro exchange rates, Économie internationale, 119, 3/2009: 25–45. ISSN 2110-7017. CORNELL, W. B., DIETRICH, J. K., 1978: The
Effi ciency of the Market for Foreign Exchange Under Floating Exchange Rates. Review of Economics and Statistics, 60, 1/1978: 111–120. ISSN 0034-6535. CURCIO, R., GOODHART, CH., GUILLAUME,
D., PAYNE, R., 1997: Do technical trading rules generate profi ts? Conclusions from the intra-day foreign exchange market, International Journal of Finance & Economics, 4,2: 267–280. ISSN 1099-1158. DEMPSTER, M. A. H., PAYNE, T. V., ROMAHI,
Y., THOMPSON, G. W. P., 2001: Computational
learning techniques for intraday FX trading using popular technical indicators, Ieee transactions on neural networks, 12, 4: 744–754. ISSN: 1045-9227. FAMA, E. F., 1969: Effi cient capital markets: A review
of theory and empirical work. Journal of Finance, 25, 2: 383–417. ISSN 1540-6261.
HSIEH, D., 1988: The statistical property of daily foreign exchange rates: 1974-1983. Journal of International Economics, 24, 1: 129–145. ISSN 0022-1996.
LIU, C. Y., HE, J., 1991: A variance ratio test of random walks in foreign exchange rate, Journal of Finance, 46, 2: 773–785. ISSN 1540-6261.
LJUNG, G. M., BOX, G. E. P., 1978: On a measure of lack of fi t in time series models, Biometrika, 6, 2: 297–303. ISSN 0006-3444.
LO, A. W., MACKINLAY, A. C., 1988: Stock Market Prices do not Follow Random Walks: Evidence from a Simple Specifi cation Test. The Review of Financial Studies, 1, 1: 41–66. ISSN 0893-9454. LO, A. W., MACKILAY, A. C., 1989: The size and
power of the variance ratio test infi nite samples: A Monte Carlo investigation, Journal of Econometrics, 40, 2: 203–238. ISSN 0304-4076.
LO, A. W., MACKILAY, A. C., 1990: When are contrarian profi ts due to stock market overreaction?, The Review of Financial Studies, 3, 2: 175–205. ISSN 0893-9454.
NEELY, CH. J., WELLER, P. A., 2003: Intraday technical trading in the foreign exchange market, Journal of International Money and Finance, 22, 2: 223– 237. ISSN 0261-5606.
Address