1
Effect Of Concrete Strength On The Flexural
Behavior Of Vierendeel Steel And Concrete
Composite Beams
Hayder T. Nimnim, Mohammed Q. Shaaban
Abstract: The scope of this experimental and numerical works is to investigate and study the effect of concrete compressive strength on flexural behavior of composite vierendeel steel-conncrete composite beams when considering the top chord member of the truss (compressive elements) is the concrete slab. The works consist of manufacturing and testing three specimens of 2000 mm span with slab width 1000 mm and eac h specimen contains two truss. The control beam has 25 MPa compressive strength and other beams have (35, 50) MPa. The results that attained from this study are load-deflection curves, ultimate load capacities, strains, crack patterns and failure modes. The concludes from this study are; an increase concrete strength (f’c) of slab from 25 MPa to 35 MPa leads to increase ultimate load capacity by (28.89) %. Whereas increasing concrete strength from 25 MPa to 50 MPa leads to increase ultimate load capacity by (91.63) %.
Index Terms: Vierendeel truss, Composite truss, Compressive strength, Composite vierendeel beam, Flexural Behavior, Composite steel-concrete beam.
————————————————————
1
I
NTRODUCTIONComposite trusses with deck steel-concrete slabs systems which combine wide rib profile steel decks support larger spacing and longer spans to be used for designed on an individual basis for a specific job (Brattland and Kennedy 1986) [1]. This provides flexibility in office layout and use. Despite more labors are required demanded per one-tonne of steel for construction, net fabricated steel costs (in comparison to the performance of composite beams) are decreased because of the savings in the weight of steel when the number of trusses in a project is sufficiently great so that standardized fabrication techniques can be developed. Unshared constructions, with the steel deck supporting the wet concrete and the steel trusses supporting themselves and the wet concrete, are rapid and allows other trades to follow closely behind. The open-web system produces a great flexibility for placement of electrical and mechanical services and decreases the distance between ceiling and floor. Composite trusses are very stiff, hence deflections under service conditions are typically small. The intent of this paper is to assist regulatory authorities, engineers, developers, and other interested parties in understanding the effect of concrete compressive strength of simply supported composite vierendeel steel-concrete beams on flexural behavior, and to provide analysis for variable strength on this type of composite truss.
2
CHARACTERISTICS
AND
EXPERIMENTAL
PROGRAM
OF
SPECIMENS
The experimental work consists of three specimens of a composite vierendeel steel-conncrete beams, to find out the flexural behavior. Specimens have a span of 2000 mm and slab width 1000 mm. Concrete slab of all specimens have minimum reinforcement for temperature and shrinkage in long direction which is (Ø8 @ 250 mm) with steel ratio of (ρ=0.18%), while in the short directions the slab was designed according to ACI318M-14 [2] that is the main reinforcement which consisted of (Ø8 @ 115 mm) with steel ratio of (ρ=0.475%) for slab thickness 70 mm as shown in figure (2). The bottom, vertical and diagonal member that makes steel truss with 50 mm in dimension of hollow square section and have thickness 2 mm. The control beam has 70 mm thickness and 25 MPa concrete compressive strength, whilst the other two beams have the same slab thickness 70 mm with f'c 35 MPa and 50 MPa, respectively. All beams were tested under two line loads at the Laboratory of Structure in the Department of Civil Engineering /Faculty of Engineering / University of Kufa. Table (1) shows details of specimens and figure (1) describe sketch of specimens.
Table 1. Composite Truss Beams Details
Symbol of Beam f'c (MPa) Slab Thickness (mm) Overall height (mm) Dimension of opening(mm) No. of central vierendeel opening
CT1 25 70 385 340 × 265 3
CT2 35 70 385 340 × 265 3
CT3 50 70 385 340 × 265 3
_____________________________
Hayder T. Nimnim is currently a doctor of structural engineering in Kufa University, Country-Iraq. E-mail:
Mohammed Q. Shaaban is currently pursuing masters degree program in structural engineering in Kufa University, Country-Iraq. E-mail: [email protected]
Fig.(1). Details Of Specimen (m)
Fig.(2). Framework and Reinforcement Distribution
3 MATERIALS PROPERTIES
The properties of all materials, which used to produce the specimens that conclude steel truss and concrete slab, were presented in this section. These materials are: cement, fine and course aggregates, super plasticizer, mixing water, steel truss sections, and steel reinforcement bars.
3.1 Cement
In this study Ordinary Portland cement (Type I) was used. This known commercially (Karsita) which produce from Lafraj Cement Manufacturing Company Taslouja Bazian production (Karbala- Iraq) and conformed to the Iraqi laboratory specifications No. 3868 of the Central Organization for Standardization and Quality Control [3]. The chemical and physical properties of this cement are conformed to the Iraqi specification limits (IQ.S N0.5/1984) [4].
3.2 Fine Aggregate
Normal sand imparted from Al-Najaf zone in Iraq was used as fine aggregate for concrete mixes in this paper. The maximum size of sand has (4.75mm) with soft structure and rounded particle form with fineness modulus of (2.58). Physical and chemical properties and gradient of the sand used was tested according to the Iraqi specification (IQ.S 45/1984) Zone (2) [5] and ASTM C 33/C 33M specification [6].
with: ASTM C 494 – Type D& G [7], BS 5075 Part 1 and BS EN 934, Part 2 [8].
3.5 Mixing Water
In this study ordinary clean tap water was used for concrete mixture as well as washing sand and gravel particles, and curing for all slab specimens.
3.6 Steel Reinforcing Bars
One type of steel reinforcing are used in the present work. For solid concrete slabs, deformed steel bars of size (Ø8 mm) in diameter are used in both directions and conformed to the ASTM A615M specification [9]. The yield and ultimate stresses of reinforcement is 415 and 610 MPa, respectively.
3.7 Steel Truss Section
Hollow square steel section of 50 mm in dimension and have 2 mm thickness, was used in each member that form truss for all tested specimens. Samples from these section was taken according to ASTM (A 370 – 03a) [10] and cutted by computer numerical control (CNC) plasma methodto find out the yield and ultimate stresses, which are the average value 230.2 and 458.025 MPa, respectively.
4
CONCRETE
MIXTURE
DESIGN
To reach the optimum proportion of concrete mixing, many trail mix for strength (25, 35, 50) MPa at ages of (7 and 28 days) with Super plasticizer (SP) admixture (CF555) were made depended on ACI 211.1‐91, ACI 214 – 02, ACI 318-14 and ACI 211.4R – 93 to achieved an adequate strength and good workability [13] [12] [2] [11]. To obtain high strength concrete (HSC) some consideration are essential to achieve this strength like high cement content, low water/cement ratio and using super plasticizer. The trail mixes were made in the laboratories of the civil engineering department at Kufa University, College of Engineering.
5
TEST
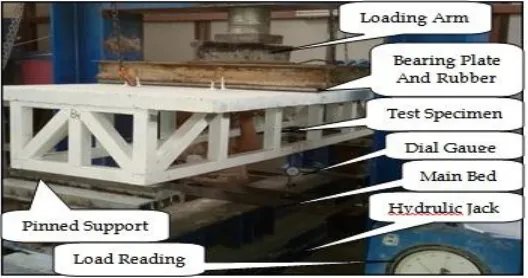
SETUP
3
6
EXPERIMENTAL
RESULTS
The aim of this section to present the results which can be obtained from specimens prepared to know the effect of concrete compressive strength on the flexural behaviour of this type of beams. The result was studied is the behavior of beams that obtained from modes of failure shape, load-deflection curves at mid-span, strain in the middle section and at the diagonal member, crack pattern, ultimate load and deflection.
6.1 Behavior of Load Deflection
The load-mid span deflection of composite truss beams were measured by using a dial gage at the centre of truss. The different behaviour for all tested beams was taken due to the various formatting of specimens in concrete. So load-deflection curves for all specimens was made by three stages; the elastic stage where linear response was presented, elastic-plastic stage after first cracking and plastic stage where nonlinear response noted Also, this stage included failure. Figure (4) represents a comparison of the load-deflection curve for all specimens. It has been observed that the flexural stiffness and slope of the curve for concrete strength 50 MPa larger than the curves of other strength. While 35 and 25 MPa strength have more ductile in behavior of load-deflection curves.
Fig. (4) Load –Deflection relationships for composite beams.
6.2 Ultimate Load Capacity of Composite Truss Beams
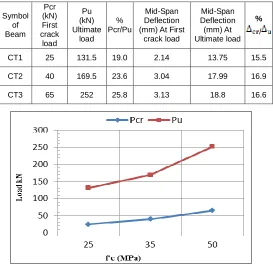
In this section, will present results and comparisons between all specimens of composite truss beams with respect to control beam for ultimate load. The results of ultimate deflection and load capacity with percentage to the control beam are shown in Table (2). Figure (5) shows the effect of concrete strength on ultimate load.
Fig. (5) Ultimate Load Various According To Concrete Compressive Strength.
6.3 Cracking Behavior
To assess the behavior of the composite truss beams, crack formation was monitored throughout testing in comparison with the action of control beam. The first cracking loads and cracking pattern of all beams are given in the following sections.
6.3.1 First Cracking Loads
The first cracking load results gained from the tests are presented in Table (2). Figures (6) and (7) displays the ultimate load capacity and load at the first crack with deflection for all specimens, and the percent of load at first crack to ultimate load with deflection, respectively. While the figure (8) shows the ratio of first cracking and ultimate load of various compressive strengths in relation to the control beam (CT1).
Table 2. First Cracking and Ultimate Load With Deflection For Slabs
Fig.(6) First Crack and Ultimate Load. Symbol
of Beam
Pcr (kN) First crack
load
Pu (kN) Ultimate
load % Pcr/Pu
Mid-Span Deflection (mm) At First
crack load
Mid-Span Deflection (mm) At Ultimate load
%
/
CT1 25 131.5 19.0 2.14 13.75 15.5
CT2 40 169.5 23.6 3.04 17.99 16.9
Fig.(7) Percent of First Crack Load to Ultimate Load with Deflection for Beams.
Fig.(8) ratio of first cracking and ultimate load of various compressive strengths in relation to the control beam.
6.3.2 Cracking Patterns and Failure Mode
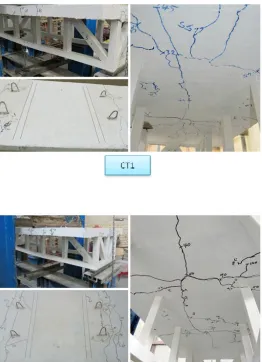
It has been observed that most beams have the same deformation, generally represents a shear failure or a combine shear-flexural failure in a concrete slab due to forming plastic hinges at the slab as shown in figure (9). Table(3) shows ultimate loads and failure modes results.
Fig. (9) Cracks patterns for all specimens.
Table 3. Ultimate Loads and Failure Modes Results.
Symbol of beam (kN)
Difference % With Control Beam
In Ultimate Capacity
Failure Mode
CT1 131.5 N/A
Yielding in steel and shear-flexure crack in
concrete
CT2 169.5 +28.89*
Yielding in steel and shear-flexure crack in
concrete
CT3 252 +91.63*
Yielding in steel and shear-flexure crack in
concrete * (+)INCREASE BY RATIO
7
F
INITEE
LEMENTS
OLUTIONA nonlinear finite element analysis of the tested specimens was made using ANSYS computer program Release 15. The main objective of this analysis is to compare results of experimental work with the present model using the ANSYS program.
7.1 Specimen Model Description and Material
5 properties to describe it on ANSYS program.
Fig. (10) Geometry of the Numerical Model.
7.2 Mesh Refinement and Loading with Boundary Conditions
To find the best mesh size, used three types of mesh are (844, 350 and 84 elements). The relation between mid-span deflection and the number of elements of the control beam noted for the same applied load of 50kN. The variation was about 9 % and acceptable when the number of elements increased from (844) as observed from the figure (12). The locations of load in model of finite element same that in the experimental for all specimens. The load used in this research was described by dividing the sum of the total distributed load on the number of upper nodes depending on the area enclosed by every individual node to represent the distributed load in ANSYS program as shown in figure (11). Loads up to the failure were applied gradually as desired by the Newton Raphson method.
Figure (11) Distribution of Applied Load and Boundary Conditions
Figure (12) Plot for convergence study
7.3. Finite Element Results
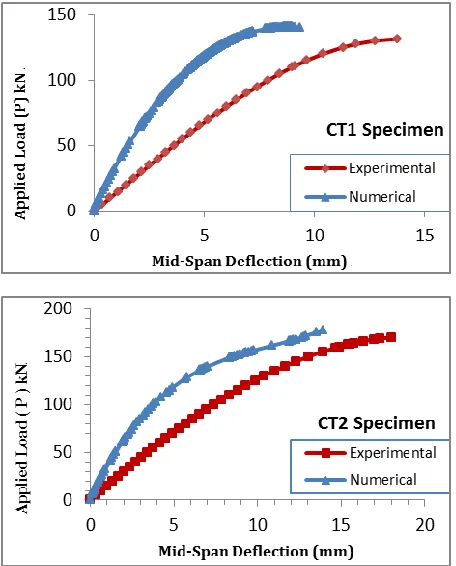
7.3.1 Load-Deflection Curve Results
Figure (13) Numerical And Exp. Load-Deflection Curve
7.3.2 Cracking Behavior and Stresses
It has been observed that cracking behavior, stresses and strains similar to the experimental as shown in figures (14) below. The first crack obtained from the F.E. appear at loading 45kN, which is bigger than the experimental (25kN) for CT1. While the first crack obtained from the F.E. appear at loading 44kN, which is larger than the experimental (40kN) by (10) % for CT2 specimen. The first crack obtained from the F.E. appear at loading 80kN, which is larger than the experimental (65kN) by (23.07) % for CT3 specimen. That may be attributed to which cracks in experimental are measured when them visible.
Fig. (14) Cracks patterns, Stresses and Strains for all specimens.
Table 4. Experimental And Theoretical Ultimate Load and Loading at First Crack.
8
CONCLUSIONS
1) The normal strain of the bottom chord of steel truss at mid-span exceeds the yield strain for all beams before compression failure of the top cord slab member. While The compression strain of the diagonal member of steel truss at the panel near support exceeds the yield strain for all beams also.
2) An increase concrete strength (f’c) from 25 MPa to 35 MPa leads to increase ultimate load capacity and cracking load by (28.89) % and (60.0) %, respectively. Whereas increase concrete strength from 25 MPa to 50 MPa leads to increase ultimate load capacity and cracking load by (91.63) % and (160) %, respectively. 3) The modelling of finite element illustrates overall
exaggeration in the ultimate load by the range (0.2 to 13)% compared with experimental results. While the Symbol of
Beam
Loading of First Crack (kN)
(F
.E
./
E
xp
.) Failure Load (kN)
(F
.E
./
E
xp
.)
Exp. Num. Exp. Num.
CT1 25 45 1.8 131.5 140.9 1.07
CT2 40 44 1.1 169.5 178 1.05
7 of Alberta, Edmonton, Alta.
[2] ACI 318-14, ―Building Code Requirements for Structural Concrete and Commentary,‖ American Concrete Institute, was adopted August 29, 2014, and published September 2014.
[3] Iraqi laboratory specifications No. 3868 of the Central Organization for Standardization and Quality Control.
[4] Iraqi specification No. 5, ―Portland Cement,‖ Baghdad, 1984.
[5] Iraqi specification No. 45, ―Natural Sources for Gravel that is Used in Concrete and Construction,‖ Baghdad, 1984.
[6] American Society of Testing and Materials, ―Standard Specifications for Concrete Aggregates,‖ ASTM C-33, West Conshohocken, PA., 1986.
[7] ASTM C 494/C 494M-99, ―Standard Specification for Chemical Admixtures for Concrete,‖ Annual Book of ASTM Standards, American Society for Testing and Materials, Vol.04.02, 1999.
[8] BS 5075 Part 1 and BS EN 934, Part 2.
[9] ASTM A 615/A615M-16, ―Standard Specification for Deformed and Plain Carbon-Steel Bars for Concrete Reinforcement, ‖ 2016 Annual Book of ASTM Standards, Vol.01.04, ASTM International, West Conshohocken, PA, 2016, www.astm.org.
[10]ASTM A 370-05, ―Standard Test Method and Definition for Mechanical Testing of Steel Products,‖ 2005 Annual Book of ASTM Standards, Vol.01.01, ASTM, Philadelphia, PA., 2005.
[11]ACI 211.4R – 93, ―Guide for Selecting Proportions for High-Strength Concrete with Portland Cement and Fly Ash,‖ American Concrete Institute Committee 211, Copyright, September 1.1993.
[12]ACI 214 – 02, ―Evaluation of Strength Test Results of Concrete,‖ American Concrete Institute Committee 214, Copyright, June 27, 2002.