O R I G I N A L R E S E A R C H
Establishment of reference intervals for serum
[
−
2]proPSA (p2PSA), %p2PSA and prostate health
index in healthy men
This article was published in the following Dove Press journal:
OncoTargets and Therapy
Zhi-Yu Wu1
Cheng Yang1
Jie Luo1
Shao-Li Deng1
Bin Wu1
Ming Chen1–3
1Department of Clinical Laboratory
Medicine, Daping Hospital, Army Medical University, Chongqing 400042, People’s Republic of China;2College of Pharmacy
and Laboratory Medicine, Army Medical University, Chongqing 400038, People’s Republic of China;3State Key Laboratory
of Trauma, Burn and Combined Injury, Army Medical University, Chongqing 400042, People’s Republic of China
Background:Prostate cancer (PCa) is the second most common cancer among men
world-wide. Recent research has identified [−2]proPSA (p2PSA), %p2PSA and prostate health index (phi) as new biomarkers for the early diagnosis and grading of PCa. However, few studies have used these parameters in a healthy population. In this study, we aimed to establish reference intervals (RIs) for p2PSA, %p2PSA and phi in healthy men based on age stratification.
Methods:Between April 2016 and March 2018, healthy subjects were recruited. Healthy
men were then stratified into four age groups: <40 years, 40–49 years, 50–59 years and
≥60 years. Total PSA (tPSA), free PSA (fPSA), %fPSA, p2PSA, %p2PSA and phi were measured and RIs were established for p2PSA, %p2PSA andphi.
Results:In total, 732 healthy men were used for analysis. The RIs ofphiwere 9.77–48.44
for <40 years of age, 9.85–65.28 for 40–49 years of age, 9.98–39.72 for 50–59 years of age and 8.16–40.76 for≥60 years of age. The reference values at the age of 40–49 years were generally higher than those at≥60 years of age.
Conclusions:Age-specific RIs for p2PSA, %p2PSA andphiwere established in this study.
Thisfirst set of established RIs will be invaluable for physicians to make precise medical decisions and carry out appropriate medical interventions.
Keywords:PSA, p2PSA, prostate health index, phi, prostate cancer, reference interval
Introduction
Prostate cancer (PCa) is one of the most common malignancies in males worldwide and one of the principal causes of death from cancer in the male population.1The current diagnosis of PCa depends on transrectal ultrasonography (TRUS) and biopsy. However, both of these techniques are invasive and are not easy to carry out, and are therefore not conducive to an early diagnosis. The most common practice is to perform routine PSA (prostate specific antigen) testing; PSA is a valid tumor marker for the swift and efficient screening of PCa. This test has increased the detection rates of early-stage PCa and reduced the mortality rates associated with this condition.2–4However, PCa screening has been associated with unnecessary biopsies, over-diagnosis, and subsequent over-treatment.5,6Due to the low specificity of the PSA test, the current guidelines do not recommend PSA-based PCa screening and as a consequence, researchers are actively searching for more specific tumor biomarkers. In recent years, [−2]proPSA (p2PSA), %p2PSA and prostate health index (phi) have gradually gained acceptance by the scientific
Correspondence: Ming Chen Department of Clinical Laboratory Medicine, Daping Hospital, Army Medical University, No. 10, Changjiang Branch Road, Yuzhong District, Chongqing 400042, People’s Republic of China Tel +86 131 1023 1375
Fax +86 236 875 7601 Email [email protected]
OncoTargets and Therapy
Dove
press
open access to scientific and medical research
Open Access Full Text Article
OncoTargets and Therapy downloaded from https://www.dovepress.com/ by 118.70.13.36 on 25-Aug-2020
community and have become the primary biomarkers investigated for the diagnosis of PCa. Research studies have already been carried out on p2PSA, %p2PSA and
phi and the majority of these studies were performed in PCa patients with total prostate-specific antigen (tPSA) levels of 4–10 ng/mL (referred to as the “gray zone”) and in patients with PSA levels >10 ng/mL.7–11 While tPSA may have early diagnostic and screening value, there is very little evidence in this regard. Research popu-lations selected based on abnormal tPSA may be biased. Consequently, it is necessary to detect additional biomar-kers such as p2PSA, %p2PSA andphiin healthy popula-tion. Consequently, the establishment of RIs is of great significance and clinical application value for the early diagnosis of PCa. Unfortunately, there are few research reports describing this style of protocol, and there is lim-ited information relating to the reference limits for this group of men.12–14 Consequently, the purpose of this research study was to establish RIs for p2PSA, %p2PSA andphiin healthy men, stratified by age.
Materials and methods
Subjects
This study complied with the Code of Ethics of the World Medical Association, was approved by the Hospital Ethics Committee (Reference Number: 2014– 33) and was carried out between April 2016 and March 2018. After obtaining informed consent, subjects were recruited following physical examination at Daping Hospital in Chongqing, China. Inclusion criteria were as follows: (1) a tPSA concentration <4 ng/mL and (2) a negative result from transabdominal prostate ultrasound. Negative ultrasound results were defined as a normal prostate size, without any positive manifestations, including prostate nodules, bilateral asymmetry of the outer glands, increased blood flow signals in the glands, unclear boundaries between the inner and outer glands and abnormal morphology. Exclusion criteria were: (1) a prior history of PCa; (2) acute or chronic bacterial prostatitis; (3) active urinary tract infections; (4) pre-vious transurethral resection of the prostate; and (5) the use of drugs or other therapies within 6 weeks preceding blood collection that might have influenced PSA con-centrations. The subjects recruited were stratified into four age groups: <40 years, 40–49 years, 50–59 years and ≥60 years.
Sample collection and analysis
Blood samples were collected before any prostatic manip-ulations that could have caused a transient increase in biomarker levels. Following blood collection, serum was immediately separated by centrifugation and stored at
−70 °C to await analysis. Maximum storage time was approximately 4 months. Prior to analysis, the stored serum samples were thawed at room temperature, mixed and analyzed using a Beckman Coulter Unicel DXI 800 automatic immunity analyzer (Beckman Coulter, Brea, CA, USA), along with the Hybritech-calibrated Access tPSA, fPSA and p2PSA assays. In total, we assayed the levels of six biomarkers in each serum sample, which included tPSA, fPSA, %fPSA, p2PSA, %p2PSA andphi.
Data collection and statistics
p2PSA derivatives were calculated as shown in equations (1) and (2) below.
%p2PSA¼p2PSA100=ðfPSA1000Þ (1)
phi¼ ðp2PSA=fPSAÞ tPSA0:5 (2)
Demographic information and results were recorded electronically using Statistical Product and Service Solution (SPSS) Version 22.0 for Windows (SPSS, Chicago, IL, USA) and presented with GraphPad Prism Version 7 for Windows (GraphPad Software, San Diego, CA, USA). Prior to calculating RIs, the outliers were identified by the Dixon’s test and interpreted by Reed’s criteria in which the absolute difference between an extreme observation and the next largest observation (D) was divided by the range of all observations (R).15If the difference D was equal to or greater than one-third of the range of R, the extreme value was deleted.16To ascertain whether separate age-specific reference intervals should be used in clinical practice, we determined 90% confidence intervals for each biomarker’s upper and lower reference limits. Standard descriptive statistics were used. Non-nor-mally distributed variables are presented as medians and interquartile ranges (IQR), while normally distributed data were presented as means and standard deviations. When data were not normally distributed, comparisons were made using the Mann-Whitney U test for comparison between two groups or the Kruskal-Wallis test with Dunn’s multiple comparisons for multiple groups. The level of significance was set at a p-value <0.05. Reference values were calculated by non-parametric
OncoTargets and Therapy downloaded from https://www.dovepress.com/ by 118.70.13.36 on 25-Aug-2020
methods following guidelines (C28-A3c) published by the Clinical and Laboratory Standards Institute (CLSI).17
Results
Patient recruitment
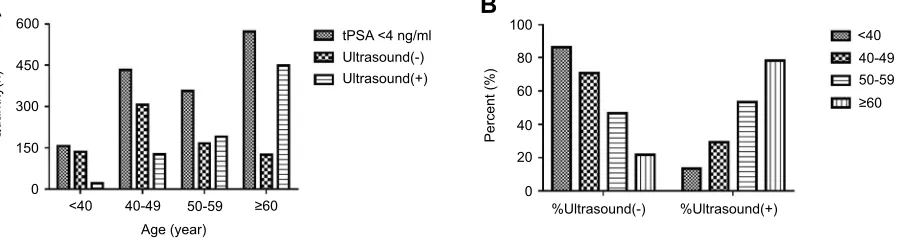
In total, 1707 subjects with tPSA levels <4 ng/mL were recruited for this study. Of these, 190 cases were miss-ing ultrasound results. Consequently, 1517 of the recruited cases had the necessary data for inclusion. However, only 732 cases were ultrasound-negative with tPSA levels <4 ng/mL and could be included in this study. These patients accounted for 48.25% (732/ 1517) of the recruited cases (Table 1). The proportions of males with negative ultrasound results in the <40 years, 40–49 years, 50–59 years and ≥60 years age groups were 86.54% (135/156), 70.83% (306/ 432), 46.63% (166/356) and 21.82% (125/573), respec-tively. Quantitative data and the proportional distribu-tion of the recruited patients in the four age groups are shown in Figure 1. Notably, the proportion of patients who had positive ultrasound results increased with age (p<0.0001).
Changes in the serum levels of six
biomarkers in healthy males
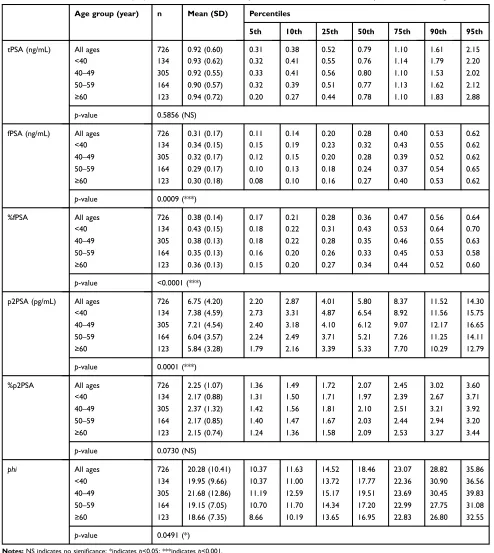
According to Dixon and Reed’s criteria,15,16six outliers were detected, which included one case in the <40 years age group, one case in the 40–49 years age group, two cases in the 50– 59 years age group, and two cases in the≥60 years age group. Consequently, 726 cases werefinally used to establish the RIs. The means, standard errors of the mean, and selected percentiles for tPSA, fPSA, %fPSA, p2PSA, %p2PSA and
phiare shown, stratified by age group, inTable 2. Boxplot and curves, depicting age-related distribution, are shown inFigures 2and3. In general, fPSA, %fPSA and p2PSA curves for healthy males showed similar trends; decreasing with age (p<0.05) and rising slightly at the age of
≥60 years. Similarly, the curves of tPSA, %p2PSA and
phishowed the same performance as each other with the highest peaks appearing during 40–49 years of age. There were no significant differences in tPSA or %p2PSA across the different age groups (p>0.05). In addition, there was no significant difference between the two groups in terms of
phi, although significant differences existed between the different age groups (p=0.0491).
Table 1Physical examinationfindings in the population of recruited patients
Examination Findings Age groups (years) Total
<40 40–49 50–59 ≥60
tPSA <4 ng/mL n (%) 156 (10.28) 432 (28.48) 356 (23.47) 573 (37.77) 1517 (100)
Ultrasound results (−) n (%) 135 (86.54) 306 (70.83) 166 (46.63) 125 (21.82) 732 (48.25)
Ultrasound results (+) n (%) 21 (13.46) 126 (29.17) 190 (53.37) 448 (78.18) 785 (51.75)
Notes:Ultrasound results (−) defined as normal prostate size, without any positive manifestations including prostate nodules, bilateral asymmetry of the outer glands, increased bloodflow signals in the glands, unclear boundaries between the inner and outer glands and abnormal morphology.
Abbreviation:tPSA, total prostate-specific antigen.
600
450
A
B
300
Quantity(n) Percent (%)
150
0 <40
<40
40-49
40-49
Age (year) 50-59
50-59 100
80
60
40
20
0 ≥60
≥60 tPSA <4 ng/ml
Ultrasound(-)
%Ultrasound(-) Ultrasound(+)
%Ultrasound(+)
Figure 1(A) Quantitative distribution of subjects in four different age groups. (B) Proportion of Ultrasound results (−) and Ultrasound results (+) subjects in four different age groups. Notes:Ultrasound (−) defined as normal prostate size, without any positive manifestations including prostate nodules, bilateral asymmetry of the outer glands, increased bloodflow signals in the glands, unclear boundaries between the inner and outer glands, abnormal morphology; Ultrasound (+) defined as oversize prostate, or with manifestations including inflammatory change, prostate nodules, bilateral asymmetry of the outer glands, increased bloodflow signals in the glands, unclear boundaries between the inner and outer glands, abnormal morphology.
Abbreviation:tPSA, total prostate-specific antigen.
OncoTargets and Therapy downloaded from https://www.dovepress.com/ by 118.70.13.36 on 25-Aug-2020
Age-based reference intervals of p2PSA,
%p2PSA and
phi
in healthy males
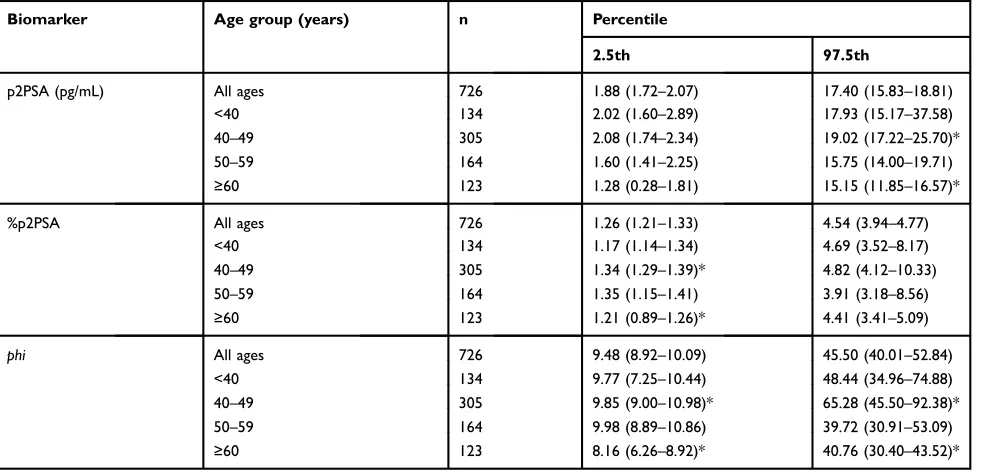
RIs (2.5th to 97.5th percentiles) for p2PSA, %p2PSA and
phiin the overall population were 1.88–17.40 pg/mL and 1.26–4.54, 9.48–45.50, respectively. RIs for the four
different age groups are summarized in Table 3. Several studies have indicated that these markers, including tPSA and p2PSA, would change with age;12,13,18,19 the present study provides further supporting evidence for this. Most of the 90% confidence intervals corresponding to the reference
Table 2Mean, standard deviation (SD) of the mean, and selected percentiles for PSA tests in healthy men of various ages
Age group (year) n Mean (SD) Percentiles
5th 10th 25th 50th 75th 90th 95th
tPSA (ng/mL) All ages 726 0.92 (0.60) 0.31 0.38 0.52 0.79 1.10 1.61 2.15
<40 134 0.93 (0.62) 0.32 0.41 0.55 0.76 1.14 1.79 2.20
40–49 305 0.92 (0.55) 0.33 0.41 0.56 0.80 1.10 1.53 2.02
50–59 164 0.90 (0.57) 0.32 0.39 0.51 0.77 1.13 1.62 2.12
≥60 123 0.94 (0.72) 0.20 0.27 0.44 0.78 1.10 1.83 2.88
p-value 0.5856 (NS)
fPSA (ng/mL) All ages 726 0.31 (0.17) 0.11 0.14 0.20 0.28 0.40 0.53 0.62
<40 134 0.34 (0.15) 0.15 0.19 0.23 0.32 0.43 0.55 0.62
40–49 305 0.32 (0.17) 0.12 0.15 0.20 0.28 0.39 0.52 0.62
50–59 164 0.29 (0.17) 0.10 0.13 0.18 0.24 0.37 0.54 0.65
≥60 123 0.30 (0.18) 0.08 0.10 0.16 0.27 0.40 0.53 0.62
p-value 0.0009 (***)
%fPSA All ages 726 0.38 (0.14) 0.17 0.21 0.28 0.36 0.47 0.56 0.64
<40 134 0.43 (0.15) 0.18 0.22 0.31 0.43 0.53 0.64 0.70
40–49 305 0.38 (0.13) 0.18 0.22 0.28 0.35 0.46 0.55 0.63
50–59 164 0.35 (0.13) 0.16 0.20 0.26 0.33 0.45 0.53 0.58
≥60 123 0.36 (0.13) 0.15 0.20 0.27 0.34 0.44 0.52 0.60
p-value <0.0001 (***)
p2PSA (pg/mL) All ages 726 6.75 (4.20) 2.20 2.87 4.01 5.80 8.37 11.52 14.30
<40 134 7.38 (4.59) 2.73 3.31 4.87 6.54 8.92 11.56 15.75
40–49 305 7.21 (4.54) 2.40 3.18 4.10 6.12 9.07 12.17 16.65
50–59 164 6.04 (3.57) 2.24 2.49 3.71 5.21 7.26 11.25 14.11
≥60 123 5.84 (3.28) 1.79 2.16 3.39 5.33 7.70 10.29 12.79
p-value 0.0001 (***)
%p2PSA All ages 726 2.25 (1.07) 1.36 1.49 1.72 2.07 2.45 3.02 3.60
<40 134 2.17 (0.88) 1.31 1.50 1.71 1.97 2.39 2.67 3.71
40–49 305 2.37 (1.32) 1.42 1.56 1.81 2.10 2.51 3.21 3.92
50–59 164 2.17 (0.85) 1.40 1.47 1.67 2.03 2.44 2.94 3.20
≥60 123 2.15 (0.74) 1.24 1.36 1.58 2.09 2.53 3.27 3.44
p-value 0.0730 (NS)
phi All ages 726 20.28 (10.41) 10.37 11.63 14.52 18.46 23.07 28.82 35.86
<40 134 19.95 (9.66) 10.37 11.00 13.72 17.77 22.36 30.90 36.56
40–49 305 21.68 (12.86) 11.19 12.59 15.17 19.51 23.69 30.45 39.83
50–59 164 19.15 (7.05) 10.70 11.70 14.34 17.20 22.99 27.75 31.08
≥60 123 18.66 (7.35) 8.66 10.19 13.65 16.95 22.83 26.80 32.55
p-value 0.0491 (*)
Notes:NS indicates no significance; *indicatesp<0.05; ***indicatesp<0.001.
Abbreviations:tPSA, total prostate-specific antigen; fPSA, free prostate-specific antigen; p2PSA, [−2]proPSA;phi, prostate health index; NS, not significant.
OncoTargets and Therapy downloaded from https://www.dovepress.com/ by 118.70.13.36 on 25-Aug-2020
limits overlapped with one another, indicating that the RIs were applicable to the three biomarkers were, in general, not different among the entire population or the four age groups. There were eight non-overlapping 90% confidence intervals found in the 40–49 years cohort and the≥60 years cohort, including the upper reference limit of p2PSA, the lower reference limit of %p2PSA, and both the upper and lower reference limits ofphifor both of these age groups.
The data showed that the reference limits at 40–49 years of age were generally higher than those at≥60 years of age.
Discussion
RIs are critical for clinical laboratory test interpretation and patient care. The test results themselves are of little value unless the report has an appropriate RI or medical decision limit. To the best of our knowledge, this
5
4
3
2
tPSA fPSA
%fPSA
%p2PSA
p2PSA phi
1
1.5
1.0
0.5
0.0 0.0
150
100
0 5 10 40
30
20
10
0
15
50
0 0.2 0.4 0.6 0.8 1.0
**
** **
**
** **
* *
***
0
<40
40-49 50-59 ≥60
Age (year)
D
E
F
C
B
A
<40
40-49 50-59 ≥60
Age (year)
<40
40-49 50-59 ≥60
Age (year)
<40
40-49 50-59 ≥60
Age (year) <40
40-49 50-59 ≥60
Age (year) <40
40-49 50-59 ≥60
Age (year)
Figure 2Serum levels of (A) tPSA, (B) fPSA, (C) %fPSA, (D) p2PSA, (E) %p2PSA and (F)phiin healthy males among the four different age groups. Boxes and horizontal lines indicate interquartile ranges and medians, respectively; whiskers stretch from the 2.5th to 97.5th percentiles for each age group.
Notes:*indicatesp<0.05; **indicatesp<0.01; ***indicatesp<0.001.
Abbreviations:tPSA, total prostate-specific antigen; fPSA, free prostate-specific antigen; p2PSA, [−2]proPSA;phi, prostate health index.
1.0
0.8
0.6
0.4
tPSA
B
A
fPSA
%fPSA
%p2PSA p2PSA
phi
0.2
0.0
25
20
15
p2PSA
PSA 10
5
0
<40 40-49 50-59 ≥60
Age (year)
<40
40-49 50-59 ≥60
Age (year)
Figure 3The age-related distribution curves of PSA (A), p2PSA andphi(B). Dots, squares and triangles indicate medians, respectively; whiskers stretch from the−95% confidence interval (CI) to the 95% CI for each age group.
Abbreviations:tPSA, total prostate-specific antigen; fPSA, free prostate-specific antigen; p2PSA, [−2]proPSA;phi, prostate health index.
OncoTargets and Therapy downloaded from https://www.dovepress.com/ by 118.70.13.36 on 25-Aug-2020
represents thefirst study to establish reference intervals for p2PSA, %p2PSA andphiin a healthy male population.
Previous studies from across the world have focused on males over 40 years of age, particularly those of older age, and have only concerned the specific characteristics of pros-tate disease.20,21 A major shortcoming of these previous studies is that biomarkers of prostate disease were not char-acterized in the healthy male population. This made it impos-sible to set accurate and specific ranges for biomarkers of prostate disease in normal healthy males. The aim of the present study was to investigate the dynamic trends of p2PSA, %p2PSA and phi across a healthy population of males with a wide range of ages, featuring both young and elderly patients. Our primary aim was to establish RIs for p2PSA, %p2PSA and phi within the normal healthy male population. Therefore, in addition to investigating subjects with normal levels of tPSA (<4 ng/mL), our selection of healthy men also meant that we were investigating subjects who were ultrasound negative. This is why our results and conclusions differ from previous reports using healthy populations.12,13Subjects included in previous studies were recruited on the basis of their normal tPSA, yet we found that the proportion of subjects with a normal prostate size (ie, no prostatic hyperplasia or hypertrophy) was only 48.25% in this study. When stratified by age, the proportions of males with an enlarged prostate in the <40 years, 40–49 years, 50– 59 years and≥60 years age groups were 13.46% (21/156),
29.17% (126/432), 53.37% (190/356) and 78.18% (448/573), respectively. We can, therefore, speculate that even if serum tPSA levels remain normal, prostatic hyperplasia or hyper-trophy may occur. Furthermore, it is important to note that the incidences of prostatic hyperplasia and hypertrophy increase significantly with age.
Our present study also showed that tPSA, %p2PSA and
phi did not increase with age, as reported in most of the existing literature,12,13,18,19 and that there was no signifi -cant difference in these three biomarkers when compared across men of different ages. This finding differs from previous studies, possibly because of the nature of our study population. In our population of healthy males, we ruled out the possibility of benign prostatic hyperplasia (BPH) and other related diseases. However, the upward trends of tPSA, %p2PSA and phi described in previous studies concurred with the tendency for BPH to increase with age in our study. we can speculate that the elevated biomarker levels, including those of tPSA and phi, in the healthy population of previous studies was caused by BPH, remains unclear because these studies failed to include the imaging data. Future studies should aim to address this issue.
In the present study, we also observed that tPSA, % p2PSA andphishowed similar trends with age, peaking at 40–49 years. This can be explained by the histological appearance of BPH after the age of 40 years. Between
Table 3Reference intervals for p2PSA, % p2PSA andphi
Biomarker Age group (years) n Percentile
2.5th 97.5th
p2PSA (pg/mL) All ages 726 1.88 (1.72–2.07) 17.40 (15.83–18.81)
<40 134 2.02 (1.60–2.89) 17.93 (15.17–37.58)
40–49 305 2.08 (1.74–2.34) 19.02 (17.22–25.70)*
50–59 164 1.60 (1.41–2.25) 15.75 (14.00–19.71)
≥60 123 1.28 (0.28–1.81) 15.15 (11.85–16.57)*
%p2PSA All ages 726 1.26 (1.21–1.33) 4.54 (3.94–4.77)
<40 134 1.17 (1.14–1.34) 4.69 (3.52–8.17)
40–49 305 1.34 (1.29–1.39)* 4.82 (4.12–10.33)
50–59 164 1.35 (1.15–1.41) 3.91 (3.18–8.56)
≥60 123 1.21 (0.89–1.26)* 4.41 (3.41–5.09)
phi All ages 726 9.48 (8.92–10.09) 45.50 (40.01–52.84)
<40 134 9.77 (7.25–10.44) 48.44 (34.96–74.88)
40–49 305 9.85 (9.00–10.98)* 65.28 (45.50–92.38)*
50–59 164 9.98 (8.89–10.86) 39.72 (30.91–53.09)
≥60 123 8.16 (6.26–8.92)* 40.76 (30.40–43.52)*
Notes:Values in brackets indicate the 90% confidence interval (CI) of the corresponding reference limits. *Indicates non-overlapping 90% CIs between the two groups. Abbreviations:p2PSA, [−2]proPSA;phi, prostate health index.
OncoTargets and Therapy downloaded from https://www.dovepress.com/ by 118.70.13.36 on 25-Aug-2020
the ages of 40 and 49, the prostate is more likely to experience enlarged glandular cells (hypertrophy) and hyperplasia. There are no positive features for BPH in imaging while BPH is involved in the initial stages of hyperplasia and hypertrophy. Consequently, higher levels of tPSA, %p2PSA and phiare often observed in this age group. It is also worth mentioning that phi falls to its lowest levels at the age of ≥60 years, which may be associated with a decline in liver and kidney metabolism, estrogen inactivation and androgen secretion, and the attenuation of function in the hypothalamus-pituitary-tes-ticular gonad axis.22 Does phi predict a lower risk of prostate disease such as BPH in these older men? Unfortunately, the answer to this question requires further validation. Interestingly, trends in the other three biomar-kers (fPSA, %fPSA and p2PSA) with age were essentially identical, showing peaks <40 years of age and then falling gradually with age. p2PSA, one of the truncated forms of ProPSA, is created after cleavage by kallikrein and has been shown to be highly associated with the development of PCa.23 In this study, the peak levels of p2PSA were observed in healthy young adults. Furthermore, we estab-lished RIs for p2PSA, %p2PSA andphiin a healthy male population. The RIs of the four age cohorts tested herein were different, and we also identified that the upper and lower limits of reference values for these biomarkers at the age of 40–49 years were generally higher than those at
≥60 years.
There are two primary limitations of this study. First, the study population was recruited from a third-class hos-pital in Chongqing. Consequently, there may have been a certain level of bias in terms of population selection. Second and most importantly, defining prostate health through laboratory tests and transabdominal prostate ultra-sound is clearly insufficient. Clearly, comprehensive pros-tate health screening should also include direct rectal examination (DRE), transrectal ultrasonography (TRUS), magnetic resonance imaging (MRI) and prostate biopsy.
Conclusion
This study describes a relation between age and changes in the levels of six markers, including PSA and p2PSA. Interestingly, for the first time, we revealed the signifi -cance of determining age-specific p2PSA and phi values in healthy men in Chongqing, China. The typical higher age-specific reference interval for serum p2PSA andphiin comparison with other populations also underlines the need for regional research within individual countries.
Abbreviations
BPH, benign prostatic hyperplasia; PCa, prostate cancer; PSA, prostate-specific antigen; p2PSA, prostate-specific antigen isoforms 2.
Ethics approval and informed
consent
This study complied with the Code of Ethics of the World Medical Association and was approved by the Hospital Ethics Committee (Reference Number: 2014-33). All sub-jects provided signed and informed consent.
Disclosure
The authors report no conflicts of interest in this work.
References
1. Siegel RL, Miller KD, Jemal A. Cancer statistics, 2018.CA Cancer J Clin.2018;68:7–30. doi:10.3322/caac.21442
2. Attard G, Parker C, Eeles RA, et al. Prostate cancer. Lancet.
2016;387:70e82. doi:10.1016/S0140-6736(14)61947-4
3. Center MM, Jemal A, Lortet-Tieulent J, et al. International variation in prostate cancer incidence and mortality rates. Eur Urol.
2012;61:1079–1092. doi:10.1016/j.eururo.2012.02.054
4. Siegel RL, Miller KD, Jemal A. Cancer statistics, 2015.CA Cancer J Clin.2015;65(1):5–29. doi:10.3322/caac.21254
5. Tosoian JJ, Ross AE, Sokoll LJ, Partin AW, Pavlovich CP. Urinary biomarkers for prostate cancer.Urol Clin North Am.2016;43:17–38. doi:10.1016/j.ucl.2015.08.003
6. Huang YQ, Sun T, Zhong WD, Wu CL. Clinical performance of serum [−2]proPSA derivatives, %p2PSA and phi, in the detection and manage-ment of prostate cancer.Am J Clin Exp Urol.2014;2:343–350. 7. Vukovic I, Djordjevic D, Bojanic N, Babic U, Soldatovic I. Predictive
value of [−2]propsa (p2psa) and its derivatives for the prostate cancer detection in the 2.0 to 10.0 ng/mL PSA range.Int Braz J Urol.2017;43 (1):48–56. doi:10.1590/S1677-5538.IBJU.2016.0256
8. Al Saidi SS, Al Riyami NB, Al Marhoon MS, et al. Validity of prostate health index and percentage of [−2]pro-prostate-specific antigen as novel biomarkers in the diagnosis of prostate cancer: omani tertiary hospitals experience.Oman Med J.2017;32(4):275– 283. doi:10.5001/omj.2017.55
9. Furuya K, Kawahara T, Narahara M, et al. Measurement of serum isoform [−2]proPSA derivatives shows superior accuracy to mag-netic resonance imaging in the diagnosis of prostate cancer in patients with a total prostate-specific antigen level of 2–10 ng/ mL. Scand J Urol. 2017;51(4):251–257. doi:10.1080/2168180 5.2017.1298155
10. Lazzeri M, Briganti A, Scattoni V, et al. Serum index test %[−2] proPSA and Prostate Health Index are more accurate than prostate specific antigen and %fPSA in predicting a positive repeat prostate biopsy.J Urol.2012;188:1137–1143. doi:10.1016/j.juro.2012.06.017 11. Na R, Ye DW, Qi J, et al. Prostate health index significantly reduced unnecessary prostate biopsies in patients with PSA 2– 10 ng/mL and PSA >10 ng/mL: results from a Multicenter Study in China. Prostate. 2017;77(11):1221–1229. doi:10.1002/ pros.23382
12. Sun WG, Liang CZ, Zheng QC, et al. Influence of age on seven putative prostate tumor markers: a cohort study in Chinese men. Asian J Androl.2017;19:463–467. doi:10.4103/1008-682X.175787
OncoTargets and Therapy downloaded from https://www.dovepress.com/ by 118.70.13.36 on 25-Aug-2020
13. Lacher DA, Hughes JP. Total, free, and complexed prostate-specific antigen levels among US men, 2007–2010. Clin Chim Acta.
2015;448:220–227. doi:10.1016/j.cca.2015.06.009
14. Rhodes T, Jacobson DJ, McGree ME, et al. Distribution and associa-tions of[−2]proenzyme-prostate specific antigen in community dwell-ing black and white men. J Urol. 2012;187:92–96. doi:10.1016/j. juro.2011.09.017
15. Dixon W. Processing data for ourliers.Biometrics. 1953;9:74–89. doi:10.2307/3001634
16. Reed AH, Henry RJ, Mason WB. Influence of statistical method used on the resulting estimate of normal range.Clin Chem.1971;17:275–284. 17. CLSI.Defining, Establishing, and Verifying Reference Intervals in the
Clinical Laboratory; Approved Guideline. 3rd ed. CLSI Document C28-A3c. Wayne (PA): Clinical and Laboratory Standards Institute;2008. 18. Liu ZY, Sun YH, Xu CL, et al. Age specific PSA reference ranges in
Chinese men without prostate cancer.Asian J Androl.2008;11:100– 103. doi:10.1038/aja.2008.17
19. Liu X, Wang J, Zhang S-X, Lin Q. Reference ranges of age-related prostatespecific antigen in men without cancer from Beijing area. Iran J Public Health.2013;42:1216–1222.
20. Choi H, Park JY, Shim JS, Kim JH, Bae JH. Free prostate-specific antigen provides more precise data on benign prostate volume than total prostate-specific antigen in korean population.Int Nenrourol J.
2013;17(2):73–77. doi:10.5213/inj.2013.17.2.73
21. Pereira J, Bilhim T, Duarte M, et al. Patient selection and counseling before prostatic arterial embolization. Tech Vasc Interv Radiol.
2012;15(4):270–275. doi:10.1053/j.tvir.2012.09.003
22. Inci M, Rifaioglu MM, Inci M, et al. The investigation of total PSA, free PSA, and free/total PSA ratio in patients with liver cirrhosis patients according to Child-Pugh score. Urology. 2013;81(3):617– 622. doi:10.1016/j.urology.2012.11.022
23. Semjonow A, Köpke T, Eltze E, et al. Pre-analytical in-vitro stability of [−2]proPSA in blood and serum.Clin Biochem.2010;43(10):926– 928. doi:10.1016/j.clinbiochem.2010.04.062
OncoTargets and Therapy
Dove
press
Publish your work in this journal
OncoTargets and Therapy is an international, peer-reviewed, open access journal focusing on the pathological basis of all cancers, potential targets for therapy and treatment protocols employed to improve the management of cancer patients. The journal also focuses on the impact of management programs and new therapeutic
agents and protocols on patient perspectives such as quality of life, adherence and satisfaction. The manuscript management system is completely online and includes a very quick and fair peer-review system, which is all easy to use. Visit http://www.dovepress.com/ testimonials.php to read real quotes from published authors.
Submit your manuscript here:https://www.dovepress.com/oncotargets-and-therapy-journal
OncoTargets and Therapy downloaded from https://www.dovepress.com/ by 118.70.13.36 on 25-Aug-2020
![Figure 3 The age-related distribution curves of PSA (A), p2PSA and phi (B). Dots, squares and triangles indicate medians, respectively; whiskers stretch from the −95%confidence interval (CI) to the 95% CI for each age group.Abbreviations: tPSA, total prostate-specific antigen; fPSA, free prostate-specific antigen; p2PSA, [−2]proPSA; phi, prostate health index.](https://thumb-us.123doks.com/thumbv2/123dok_us/8615422.1405130/5.612.82.549.54.318/distribution-triangles-respectively-condence-abbreviations-specic-prostate-specic.webp)