Effect of Processing Parameters on the Biomass
Gasification of Coconut Shell
M.Senthil kumar
1*, S.Vivekanandan
21Assistant Professor, Department Of Mechanical Engineering, Annamalai University,
Annamalai Nagar, Chidambaram-608002, Tamil Nadu, India.
2
Associate Professor, Department Of Mechanical Engineering, Annamalai University, Annamalai Nagar, Chidambaram-608002, Tamil Nadu, India.
ABSTRACT
Gasification is one of the most promising technologies for converting biomass into a fuel. The main objective of this research is to study the effect of design and operating parameters, mainly as Bed Temperature (T), Pressure (P), Equivalence Ratio (ER), Feed rate (F) and Particle Size (S) on the performance of the gasification process of coconut shell as biomass in a continuous fixed bed updraft reactor. In the present investigation, an empirical relationship was developed to predict the process of generating fuel gas with better quality through gasification of biomass in a fluidized bed reactor using Response Surface Methodology (RSM). Six major components of the producer gas such as O2,
H2, CO, CO2, CH4, and N2 are analyzed in the
laboratory along with the evaluation of tar yield and cold gas efficiency. It was observed that the concentrations of Hydrogen, Oxygen Nitrogen and Carbon monoxide were increased with rise in Gasification Temperature, Pressure and Equivalent Ratio (0.2-0.35). On the other hand, higher Equivalence Ratio (0.4-0.5) caused to decrease the concentrations of Hydrogen, Oxygen, Nitrogen and Carbon Monoxide. The developed model was made a good prediction for the experimental data as observed for the gas species concentrations.
Keyword: Coconut shell; Fluidized Bed Gasifier; Producer Gas; Response Surface Methodology and Equivalent Ratio.
1.0 INTRODUCTION
Biomass is the only source of carbon-based renewable fuels and the sustainable exploitation of this resource is essential to secure the energy security. An agricultural residue that could be utilized for the recovery of energy is coconut shell because of its reasonably high energy content (12–18 MJ/kg) [1]. The fluidized bed gasifier allows efficient conversion of solid biomass into high quality product gas via steam gasification. The process is currently performed on wood chips from natural sources. In addition to biomass from forestry, woody residues, such as bark, waste wood, and sawdust are interesting feedstock because of their availability and price. Depending on the origin of the residues, the particle size of the materials covers a wide range from fine particles of sawdust The particle size of the biomass has an important influence on its thermal conversion and this has been studied by several research groups. It is commonly agreed on that the particle size determines the mass and heat transfer into and from the particle. Four different regimes of heat transfer are distinguished related to particle size: In the kinetic regime, particles are considered to be isothermal and to heat up instantly. In the thermally thin regime, external heat transfer occurs between the particle and the surroundings, but the intra-particle temperature gradient is found to be negligible. In the thermally
diversion of rapeseed oil to biodiesel production. Because of these concerns and the overall limitations of first generation biofuels technology primarily due to competition with feed and food production, advanced or second generation biofuels technologies will be required to meet aggressive volume goals for biofuels deployment [5]. A number of different conversion technologies exist [6, 7] for the conversion of cellulosic biomass to biofuels. The predominant differentiation between the conversion options is the primary catalysis system [8].. Pyrolysis on the other hand, is the milder depolymerization of biomass producing a liquid intermediate (pyrolysis oil or ‘‘bio-oil’’) in the absence of oxygen at lower temperatures, typically in the range of 400–650°C. Good reviews of pyrolysis techniques and the current technical status of these techniques are provided [9]. but so far no such plants have been built in India, possibly because of low electricity prices and a lack of sufficient incentives to adopt renewable energy [10].Several studies have investigated equilibrium modelling of gasification and most of them used the relatively simple Gibbs free energy minimization method [11–13]. Ptasinski etal. [14] and Prins et al. [15] studied the effect of varying feedstock compositions on gasification efficiency. Mahishi and Goswami [160] used equilibrium modelling to study the effects of operating conditions on hydrogen yields using both steam and oxygen as gasifying agents. They found that wood should be gasified at ambient pressure, 1000 K, an equivalence ratio of 0.1 and a steam to biomass ratio of to obtain the maximum hydrogen yield; however, the effect of moisture was not included. A comparison of their equilibrium calculations with experimental data showed that the data correlated best at longer residence times (>1.4s) and temperature above 800°C. Although experimental data is available in literature for bagasse
gasification, the gasifiers were not necessarily optimized for the specific downstream application of FT synthesis. In addition, none of the previous process modelling studies evaluated the effects of changing operating parameters on gasification efficiency. From the literature review, it is understood that there are a large number of fluidized bed biomass gasifiers developed worldwide, unfortunately most of these projects are struggling to reach commercialization. Very few investigations have been done related to the prediction of the quality of the producer gas, incorporating the process parameters like temperature, equivalent ratio and steam to biomass ratio alone. Hence, the present work was aimed to develop a fluidized bed biomass gasifier using air as the gasifying agent and to investigate the effect of process parameters on the gasifier performance. A pilot scale fluidized bed coconut shell gasifier had been developed for this purpose. The effect of equivalence ratio, gasifying temperature and pressure, along the particle size and feed rate on the fuel gas composition had been studied. An empirical relationship was developed to predict the product gas composition with the assumptions that the principal reactions were at thermodynamic equilibrium condition. The experimental data and the predicted vales have been analyzed, compared and discussed in the present work.
2.0 EXPERIMENTAL WORK 2.1. Feedstock and inert bed materials
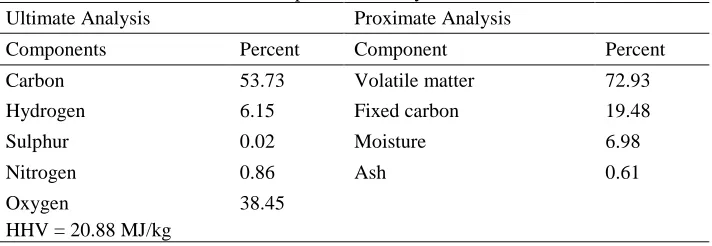
The feed stock selected to study the fluidized bed gasification was coconut shell with different granular sizes. These biomaterials were collected from rural industries of Cuddalore district, India. The proximate and ultimate analyses of coconut shell used as feed stock are presented in Table 1.
Table 1 Ultimate and proximate analysis of Coconut shell Ultimate Analysis Proximate Analysis
Components Percent Component Percent
Carbon 53.73 Volatile matter 72.93
Hydrogen 6.15 Fixed carbon 19.48
Sulphur 0.02 Moisture 6.98
Nitrogen 0.86 Ash 0.61
Oxygen 38.45
HHV = 20.88 MJ/kg
The inert bed material used was sand and its particle size distribution was selected as 0.400 mm using sieve analysis. The properties of these materials and the procedures followed in finding out physical and chemical properties are mentioned in detail. Absolute specific gravity of the selected materials was measured
µm. The test materials were dried and then sieved in a set of standard sieves and particle size distribution was observed [17]. Using oven method (110°C till reaching standard borne dry weight), moisture content of feed stock was measured (ASTM, E – 871). Proximate composition such as volatile matter (ASTM, E – 872) and ash (ASTM, E- 830) and fixed carbon (by weight difference) was found out by ASTM procedures. The elemental composition of the feed stock was found out using Elemental Analyzer (Carlo Erba EA 1108) coupled with auto sampler AS-200 and data processor DP 200-PRC. The minimum fluidization velocity was measured using pressure drop method. U tube manometers are used to measure the pressure drop below and above the distributor plate and at different heights of fluidized bed reactor. The air velocity corresponding to the peak pressure drop gives the experimental value of minimum fluidization velocity [17].
2.2 Experimental Set up
A pilot scale fluidized bed coconut shell gasifier (capacity: 20 kg/h) had been developed and installed in the laboratory to carry out the experimental investigation. The schematic diagram of the setup is shown in Fig. 1. The cylindrical gasifier with 108 mm inside diameter up to a height of 1400 mm made of carbon steel material having inside refractory lining of thickness 0.1 m.
Fig, 1 Experimental Set Up
The gasifier is fitted with a multiple hole distributor plate of 105 mm diameter was used for air distribution The ash discharge systems were provided for periodical disposal through the lock hopper arrangements. Silica sands were initially put into the gasifier through the screw feeder and air was introduced at the bottom of gasifier to maintain the bed in fluidized state. The air flow, after the discharge of blower, was controlled by a regulating valve and the flow was then estimated by an orifice meter placed in the supply pipe on the basis of pressure drops recorded
bed gasifier fueled by coconut shell. Later on, Mansaray et al. [20] also investigated the coconut shell gasifier performance in a fluidized bed system by varying the equivalence ratio at 0.25, 0.30 and 0.35. In view of these observations, the gasifier was operated with equivalence ratios of 0.20-0.50 in the present investigation to get the experimental results.
2.4 Experimental Design Matrix
Owing to a wide range of factors, the use of five factors and central composite rotatable design matrix was chosen to minimize number of experiments. The assay conditions for the reaction parameters were taken at zero level (center point) and one level (-1) and (+1). The design was extended up to a ± α (axial point) of 2.378. The center values for variables were carried out at least 10 times for the estimation of error and single runs for each of the other combinations; thirty two runs were done in a totally random order. The design would consist of the 10 corner points of the 25 cube, the 16 star points, and 6
center points. The star points would have a = 32^ (1/4) = 2.378
For the convenience of recording and processing experimental data, the upper and lower levels of the factors were coded here as +2.378 and -2.378 respectively. The coded values of any intermediate value could be calculated using following relationship
Xi = (2.378x{2X-[Xmax - Xmin]})/(Xmax - Xmin) (1) Where
Xi is the required coded value of a variable X; X is any value of the variable from Xmin to Xmax ; Xmin is the lower level of the variable;
Xmax is the upper level of the variable.
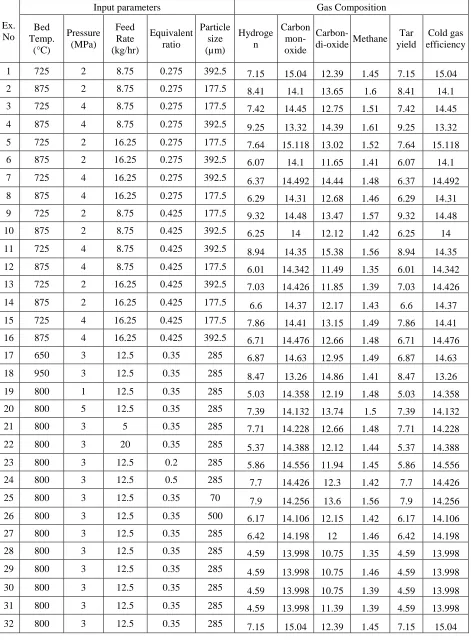
Design matrix consisting of 32 sets of coded conditions (comprising a full replication five factorial of 16 points, 10 corner points and six centre points) was chosen in this investigation. Table 2 represents the ranges of factors considered, and Table 3 shows the 32 sets of coded and actual values with experimental results.
Table 2 Important factors and their levels
Factors Units Factors levels
-2.378 -1 0 +1 +2.378 Bed Temperature
(T) Celsius 650 725 800 875 950
Pressure (P) MPa 1 2 3 4 5
Feed rate (F) Kg/h 5 8.75 12.5 16.25 20
Particle size (S) µm 70 142.5 215 357.5 500
Equivalence ratio
(E) 0.2 0.275 0.35 0.425 0.5
During experimentation, special care was taken to maintain the desired bed temperatures as the selected feedstock was coconut shell which had 17.09% ash, higher than any woody biomass and its ash had more than 95% silica. One of the important features of coconut shell gasification is that the bed temperature can be kept as low as 600–650°C, thereby preventing sintering and agglomeration of this ash which would otherwise cause serious operational problems during the conversion process [31]. The upper temperature is fixed by slagging phenomena which primarily depends upon the ash composition and the reaction atmosphere (like oxidation or reduction). Above this temperature, silica and potassium oxide in ash fuses on the surface of coconut shell char particles forming a glass-like barrier that prevents the further reaction of the remaining carbon [32]. Some studies [33, 34] also indicate that oxidation of coconut shell at a temperature higher than 900°C results in a physical structural transformation of silica from its original amorphous state to a crystalline state thereby encapsulating residual carbons. Once the structural changes of silica occurs, the combined carbon becomes
unavailable for further oxidation reactions even at higher temperatures. In view of this, the gasifier was operated in the range of 600–950°C when the experiments were carried out with equivalence ratio 0.2 and 0.5. The gasification temperature was raised up to 700°C only in case of equivalence ratio of 0.25. The gasifier temperatures were recorded using Ni–Cr–Ni thermocouples with a digital display system. The gas sampling system was composed of probes fitted with septum. The sampling point was located at the outlet pipe of gasifier. The gas sampling probe made of glass was 50 mm in diameter and 500 mm in length. A syringe of volume capacity of 10 ml was used to collect the gas sample. The sample was analyzed in the Gas Chromatograph (Make – Chemito, model – GC1000) to get the raw experimental data and those were compared with the predicted values of the developed model.The energy content of the gas is assessed through the variable CGE (cold gas efficiency). This variable represents the ratio between the energy content of the permanent gas (HHVgas) and
(HHVcoconut shell ) without taking into account the heat
input in the reactor:
CGE = HHVgas/HHVcoconut shell …… (2)
At the end of the experiment the residual tar were weighed and stored in a sealed recipient for further characterization. The tar yield is expressed as the ratio of the residual tar to the initial mass of coconut shell
YTar%= [(MTar) / (Mcoconut shell)]x100 ….. (3)
3.0 DEVELOPING THE EXPERIMENTAL DESIGN MATRIX
In the present investigation, to correlate the process parameters and the quality of the prodcer gas, a second order quadratic model was developed. In this study, the RSM provides a quantitative form of relationship between the desired response (Quality of the Producer gas ) and the independent input variables, bed temperature (T), pressure (P), the feed rate of the feed stock (F), the equivalence ratio (E) and particle size (S), and can be expressed as a function, as in Equation (3)
Producer gas (G) = f (T, P, F, E, S)... (4)
The empirical relationship must include the main and interaction effects of all factors and hence the selected polynomial is expressed as follows:
Table 3 Experimental Results
Ex. No
Input parameters Gas Composition
Bed Temp.
(°C)
Pressure (MPa)
Feed Rate (kg/hr)
Equivalent ratio
Particle size (µm)
Hydroge n
Carbon mon- oxide
Carbon-di-oxide Methane Tar yield
Cold gas efficiency
1 725 2 8.75 0.275 392.5 7.15 15.04 12.39 1.45 7.15 15.04
2 875 2 8.75 0.275 177.5 8.41 14.1 13.65 1.6 8.41 14.1
3 725 4 8.75 0.275 177.5 7.42 14.45 12.75 1.51 7.42 14.45
4 875 4 8.75 0.275 392.5 9.25 13.32 14.39 1.61 9.25 13.32
5 725 2 16.25 0.275 177.5 7.64 15.118 13.02 1.52 7.64 15.118
6 875 2 16.25 0.275 392.5 6.07 14.1 11.65 1.41 6.07 14.1
7 725 4 16.25 0.275 392.5 6.37 14.492 14.44 1.48 6.37 14.492
8 875 4 16.25 0.275 177.5 6.29 14.31 12.68 1.46 6.29 14.31
9 725 2 8.75 0.425 177.5 9.32 14.48 13.47 1.57 9.32 14.48
10 875 2 8.75 0.425 392.5 6.25 14 12.12 1.42 6.25 14
11 725 4 8.75 0.425 392.5 8.94 14.35 15.38 1.56 8.94 14.35
12 875 4 8.75 0.425 177.5 6.01 14.342 11.49 1.35 6.01 14.342
13 725 2 16.25 0.425 392.5 7.03 14.426 11.85 1.39 7.03 14.426
14 875 2 16.25 0.425 177.5 6.6 14.37 12.17 1.43 6.6 14.37
15 725 4 16.25 0.425 177.5 7.86 14.41 13.15 1.49 7.86 14.41
16 875 4 16.25 0.425 392.5 6.71 14.476 12.66 1.48 6.71 14.476
17 650 3 12.5 0.35 285 6.87 14.63 12.95 1.49 6.87 14.63
18 950 3 12.5 0.35 285 8.47 13.26 14.86 1.41 8.47 13.26
19 800 1 12.5 0.35 285 5.03 14.358 12.19 1.48 5.03 14.358
20 800 5 12.5 0.35 285 7.39 14.132 13.74 1.5 7.39 14.132
21 800 3 5 0.35 285 7.71 14.228 12.66 1.48 7.71 14.228
22 800 3 20 0.35 285 5.37 14.388 12.12 1.44 5.37 14.388
23 800 3 12.5 0.2 285 5.86 14.556 11.94 1.45 5.86 14.556
24 800 3 12.5 0.5 285 7.7 14.426 12.3 1.42 7.7 14.426
25 800 3 12.5 0.35 70 7.9 14.256 13.6 1.56 7.9 14.256
26 800 3 12.5 0.35 500 6.17 14.106 12.15 1.42 6.17 14.106
27 800 3 12.5 0.35 285 6.42 14.198 12 1.46 6.42 14.198
28 800 3 12.5 0.35 285 4.59 13.998 10.75 1.35 4.59 13.998
29 800 3 12.5 0.35 285 4.59 13.998 10.75 1.46 4.59 13.998
30 800 3 12.5 0.35 285 4.59 13.998 10.75 1.39 4.59 13.998
31 800 3 12.5 0.35 285 4.59 13.998 11.39 1.39 4.59 13.998
4.0 RESULTS AND DISCUSSION 4.1 Effect of Temperature
O2, N2, H2 and CO concentrations were found
to increase with increase in bed temperature, and decreased the concentrations of CH4 and CO2. This
may be explained withLe Chatelier’s principle which states that higher temperature favors the reactants in exothermic reactions and the products in endothermic reaction. Higher temperatures favoured the formation of O2, N2, H2 and CO coupled with increased
reforming of methane. However, if the temperature is further increased, H2 is converted to CO and H2O by
the reverse water gas shift reaction, which is favoured at high temperatures. In this case, the maximum H2/CO
ratio occurred at between 750-950°C, but this varied according to the other operating variables. According to previous studies [35, 36], the carbon boundary temperature for grass, which has a similar lingo cellulosic composition and heating value as bagasse, occurs at around 850°C,which would correspond to the optimum gasifier temperature. This correlates with the results presented here, since at 850°C all the carbon was converted, and the highest system efficiency was observed for all cases, due to the increase in external gasifier heat requirements at elevated temperatures. However, this is the theoretical case and is only applicable when the residence time is long enough for equilibrium to be reached. Based on the bagasse gasifier tested by DeFilippis et al. [17], this minimum temperature was assumed 650°C for the purposes of this study. Therefore, the endothermic reaction was strengthened with increasing temperature, which resulted in more H2 and less CH4 concentrations. It was
also found that the experimentally measured CH4
concentrations were more than the calculate values. At 950°C and 0.35 ER, the measured concentration of CH4 was experimentally found to be 1.34 % whereas
the calculated value was 1.46 % – the possible explanation could be that the equilibrium state might not have reached in the bed. Nevertheless the gasification process, involving reactions of homogeneous and heterogeneous in nature along with initial drying and pyrolysis, is very complicated to determine the actual kinetics of the chemical reactions. Some of these facts might have caused to vary the predicted values from the experimental data. At 950°C, at equivalence ratio of 0.35, the cold gas efficiency is higher.
4.2 Effect of Pressure
An increase in gasifier pressure leads to reduced partial pressures of CO and CH4 coupled with
an increase in CO2, H2 and O as reflected in Table 4.
This trend is consistent with LeChatelier ’s principle, and has been reported in the literature for other feedstock and gasifier types [37, 38]. In practice, high
pressure gasification may have economic advantages in upstream processing due to smaller equipment sizes. Higher overall efficiencies could also be achieved if hot gas cleaning is used, but this is still in development. It is estimated that higher O2, N2, H2 and
CO concentrations are increase with the increasing pressure of air flow. However, CH4 and CO2 decreased
with the increase in pressure. The cold gas efficiency was estimated during gasification period, to 64 %. Generally, increasing the pressure will increase the cold gas efficiency since the heating value of the produced gas will increase with pressure [23] as a result of CH4 production through the steam reforming
reaction. On the other hand, increasing temperature will decrease the heating value of produced gas and hence lower the cold gas efficiency [24]. A produced gas with a high CH4 content could be used for example
power production. However, if the produced gas is intended to be used for catalytic conversion to methanol, DME, Fischer Tropsch products etc, then the yield of H2 and CO and the O2 ratio should instead be
considered [17] Improvements in determining the syngas flow through e.g. flow measurement or by trace experiments will be evaluated in future work as well as optimization of the operation. Similarly, cold gas efficiencies varied from 20 to 87% in an entrained flow biomass gasifier and depended on addition of steam and air preheating [39]. The composition of the syngas at equilibrium was determined at 5 bar, 0.36 % O2 and
53% N2. The calculations are performed by
determining the minimum of Gibbs free energy of a specific system based on a database containing thermodynamic data for various chemical species and phases. Compared to thermodynamic equilibrium the syngas contains less CO but more CO2. The syngas also contains 1.3% CH4 which is not predicted at all at
equilibrium. A possible explanation could be that the heterogeneous reactions involved in char gasification are too slow to be completed within the residence time of the reactor at the current gasification conditions. This will thereby result in less CO2 and more CO,
which could explain the difference between measured CO2 and CO concentrations compared to equilibrium
values. The syngas can also have become shifted in the quench, which could also explain differences between the measured syngas composition after the quench compared to the syngas composition at equilibrium.
4.3 Effect of Feed rate
It is revealed that reduction in carbon monoxide content with increase of feed rate, whereas CO2 was
decreased with increase of feed rate. The value of carbon monoxide was in the range of 12%. Data on carbon dioxide content indicated that, with the increase of feed rate from 5 kg/hr to 20kg/hr, the CO2 content
(12.14%) value of CO2 was observed at 0.35
equivalent ratio. The results are in good agreement with the findings of previous research [30, 39]. The study on fluidized bed gasification of coconut shell reported a decreasing trend of CO2 and increasing
trend of CO with increasing feed rate. The availability of higher quantity of oxygen led to reduction in CO level [30]. With the increased supply of stoichiometric air supply, the quantity of hydrogen was reduced in synthetic gas during gasification of all the three biomaterials. The content of hydrogen in the product gas was in the range of 4–8% (coconut shell). The results of earlier researches [40, 41] showed the same trend of decrease of CO and reduction of H2 with
increase of feed rate. The reduced level of methane content in the product gas of coconut shell was noted during increased feed rate. The content of methane was increasing during the progress of gasification and hence maximum value of methane content was observed at the later stages of gasification. The overall range of methane content was 1–1.3% in all the trials of fluidized bed gasification. With the increase of rate of feed stock, the percentage of oxygen and hydrogen was decreased. The same pattern of change of synthetic gas constituents was observed in the earlier study conducted [42].
4.4 Effect of Equivalence ratio
During the experimentation, ER was varied at 0.2-0.5 changing the air flow rates with the varying parameters. Gasification with oxygen is exothermic; therefore the desired increase in temperature above the carbon boundary temperature can be achieved by feeding more oxygen to the gasifier. Increasing the equivalence ratio leads to over-oxidization and partial combustion of the syngas to produce H2O and CO2. As
this will decrease the gasification efficiency, the equivalence ratio should be kept to a minimum within the practical constraints. It is found the theoretical optimum conditions for maximum efficiency and hydrogen production from atmospheric gasification of dry biomass to be 825°C and an equivalence ratio of 0.35.However, they did not account for practical considerations such as tar formation. It has been reported in literature that a 20% secondary air injection above the gasifier freeboard can reduce tar formation [43]. The results from the study [38] showed a good correlation between experimental and predicted results for bagasse gasification with no tar formation at equivalence ratios of 0.35. It was seen that higher ER values decreased the concentrations of hydrogen and carbon-di-oxide and degraded the gas quality with more N2 dilution and higher CO2 concentration due to
oxidization of larger fraction of carbon in feedstock; as a result, the heating values of fuel gas decreased. High degree of combustion occurs at high equivalent ratio
which supplies more air into the gasifier and improves char burning to produce CO2 instead of combustible
gases such as CO, H2 and CH4. In biomass gasification,
the ER varies from 0.10 to 0.50 [44]. It was observed that increasing the ER reduced the amount of CO and CH4. Similar trends were obtained from the research [45, 46]. From the present research, the effect of ER variation (0.2-0.4) is one of the most important operation parameters on the quality of the producer gas. H2 production peaked at ER of 0.35.
4.5 Effect of Particle size
It has been accepted that small particle size biomass significantly increases the overall energy efficiency of the gasification process, but it also increases the gasification plant cost. On the other hand, an increase in biomass particle size reduces the pre-treatment costs, but the devolatilization time increases, and thus for a defined throughput the gasifier size increases. Therefore, a balance should be considered while investigating the effect of biomass particle size on the gasification efficiency [47]. The non-uniformity of the biomass particles will influence gasification reaction rate. However, due to intense mixing caused by the fluidized sand, temperature longitudinally does not vary much and are almost similar, indicating that the irregular shapes and size of wood chips do not affect the temperature [48]. On the other hand, the research made earlier [49] observed that the producer gas yield, LHV and carbon conversion were improved as the biomass particle size decreased. It was explained that small biomass particles contribute to large surface area and high heating rate which in turn produce more light gases and less char and condensate. Therefore, the yield and composition of the producer gas improved while using the small particle biomass. A possible explanation is that for small particle sizes the pyrolysis process is mainly controlled by reaction kinetics; as the particle size increases, the product gas resultant inside the particle is more difficult to diffuse out and the process is mainly controlled by gas diffusion.
5.0 CONCLUSIONS
1. The present study was focused on the gasification of coconut shell in a pilot scale fluidized bed reactor installed in the laboratory. The gasifier was operated at bed temperatures ranging from 650 °C to 950 °C with varying equivalence ratios of 0.2 – 0.5 , pressure 1 to 5 bar, feed rate 5 -20 kg/hr and particle size 70 -500 µm to investigate the fuel gas compositions.
3. It was noticed that the amount of CH4 produced
during the gasification process was more in comparison to the predicted values. The possible reason could be that the equilibrium state might not have reached for not having enough bed temperature in gasifier.
4. It was seen that hydrogen, oxygen, nitrogen and carbon monoxide contents in fuel gas were
increased with rise in bed temperatures, equivalent ratios.
5. The cold gas efficiency was found to increase at higher temperature, equivalence ratio and pressure due to presence of more CO2 and O2 in the fuel
gas, even though the rate of carbon conversion was more with the rise in bed temperature.
REFERENCES
1. Bridgwater, A.V. (1995) The technical and economic feasibility of biomass gasification for power generation. Fuel.
vol.74, no.3, p. 631–53.
2. Di Blasi, C. (1996) Kinetic and heat transfer control in the slow and flash pyrolysis of solids, Industrial and Engineering
Chemistry Research 35 (1), 37–46.
3. Ergudenler, A. (1993) Gasification of wheat straw in a dual distributor type fluidized bed reactor. Unpublished PhD. thesis, Technical University of Nova Scotia, Halifax, Nova Scotia, Canada
4. Mitchell, D. (2008) A note on rising food prices. Policy Research Working Paper 4682, The World Bank Development
5. Farrell, A.E., Plevin, R.J., Turner, B.T., Jones, A.D., O’Hare, M., Kanman, D. M. (2006) Ethanol can contribute to energy and environmental goals. Science, vol. 311, p. 506–509. 6. Rammamorth, R., Kastury, S., Smith, W. H. (2000)
Bioenergy: vision for the new millennium. Science Publishers, Enfield
7. Huber, G.W., Iborra, S., Corma, A. (2006) Synthesis of transportation fuels from biomass: chemistry, catalysts, and engineering. Chem Rev, vol. 106, p. 4044–4098.
8. Foust, T.D., Wallace, R., Wooley, R., Sheehan, J., Ibsen, K., Dayton, D., Himmel, M., Ashworth, J., McCormick, R., Hess, J.R., Wright, C., Radtke, C., Perlack, R., Mielenz, J., Wang, M., Synder, S., Werpy, T. (2007) A national laboratory market and technology assessment of the scenario. Technical Report, NREL/TP-510-4094.
9. Czernik, S., Bridgwater, A.V. (2004) Overview of applications of biomass fast pyrolysis oil. Energy Fuels, vol. 18, no.2, p. 590–598
10. Bergqvist, M.M., Wardh, K.S., Das, A., Ahlgren, E.O. (2008) A techno-economic assessment of rice husk-based power generation in the Mekong River Delta of Vietnam. Int J
Energy Res., vol. 32, no. 12, p. 1136-1150.
11. Altafini, C.R., Wander, P.R., Barreto, R.M. (2003) Prediction of the working parameters of a wood waste gasifier through an equilibrium model. Energy Convers Manage. vol. 44, p. 2763–2777.
12. Baratieri, M., Baggio, P., Fiori, L., Grigiante, M. (2008) Biomass as an energy source: thermodynamic constraints on the performance of the conversion process. Bioresour
Technol., vol. 99, p. 7063–7073.
13. Zainal, Z., Ali, R., Lean, C., Seetharamu, K. (2008) Prediction of performance of a downdraft gasifier using equilibrium modeling for different biomass materials. Energy
Convers Manage., vol. 42, p. 1499–1515.
14. Ptasinski, K.J., Prins, M.J., Pierik, A. (2007) Exergetic evaluation of biomass gasification. Energy, vol. 32, p. 568– 74.
15. Prins, M.J., Ptasinski, K.J., Janssen, F. (2007) From coal to biomass gasification: comparison of thermodynamic efficiency. Energy, vol. 32, p. 1248–1259.
16. Mahishi, M.R., Goswami, D. (2007) Thermodynamic optimization of biomass gasifier for hydrogen production. Int J Hydrogen, Energy, vol. 32, p. 3831–3840.
17. De Filippis, P., Borgianni , C., Paolucci , M., Pochetti , F. (2004) Gasification process of Cuban bagasse in a two-stage reactor. Biomass Bioenergy, vol. 27, p. 247–252.
18. Bin Zainal Alauddin, Z.A., Pooya, L., Mohammadi, M., Mohamed, A.R. (2010) Gasification of lignocellulosic biomass in fluidized beds for renewable energy development. A review, Renewable and Sustainable Energy Reviews, vol. 14, p. 2852–2862.
19. Mansaray, K.G., Ghaly, A.E., Al-Taweel, A.M., Hamdullahpur, F. (1999) Air gasification of rice husk in a dual distributor type fluidised bed gasifier. Biomass
Bioenergy, vol. 17, p. 315–332.
20. Simin S., Mojtaba Aghajani D., Mohammadreza A. (2013) Investigation of biomass gasification hydrogen and electricity co-production with carbon dioxide capture and storage,
International journal of hydrogen energy, vol. 38, pp.
3630-3639.
21. Koc. R., Kazantzis, N.K., Hua Ma Y. (2011) A process dynamic modeling and control framework for performance assessment of Pd/ alloy-based membrane reactors used in hydrogenproduction. Int J Hydrogen Energy, vol. 36, p. 4934-4951
22. Mathieu, P., Dubuisson, R. (2002) Performance analysis of a biomass gasifier. Energy Convers. Manage. vol. 43, p. 1291– 1299
23. Lin, C.L., Wey, M.L., You, S.D. (2002) The effect of particle size distribution on minimum fluidization velocity at high temperature. Powder Technol., vol. 126, p. 297–301. 24. Drift, A.V., Doorn, J., Vermeulen, J.W. (2009) Ten residual
biomass fuels for circulating fluidized-bed gasification.
Biomass Bioenergy, vol. 20, p. 45–56.
25. Luoa, S., Xiao, B., Hua, Z., Liua, S., Guana, Y., Caia, L. (2010) Influence of particle size on pyrolysis and gasification performance of municipal solid waste in a fixedbed reactor.
Bioresour Technol. vol. 101, no. 16, p. 6517–6520.
26. Susana Martı´nez-Lera, Jose´ Torrico Javier, Pallare´s Antonia Gil, (2013) Design and first experimental results of a bubbling fluidized bedfor air gasification of plastic waste, J
Mater Cycles Waste Manag. vol. 15, p. 370–380.
27. Risberg, M., Ohrman, O.G.W., Gebart, B.R., Nilsson, P.T., Gudmundsson, A., Sanati, M. (2014) Influence from fuel type on the performance of an air-blown cyclonegasifier, Fuel, vol. 116, p. 751–759.
28. Mansaray, K.G., Ghaly, A.E., Al-Taweel, A.M., Hamdullahpur, F. (1999) Air gasification of rice husk in a dual distributor type fluidised bed gasifier. Biomass
Bioenergy, vol. 17, p. 315–332.
29. Kaupp Albrecht. (1984) Gasification of rice hulls: theory and practices. Deutsches Zentrum Fuer Entwicklungs Technologien (GATE): Eschborn.
30. Schiefelbein, G.F. (1989) Biomass thermal gasification research, recent results – UnitedStates DOE’s research program. Biomass, vol. 19, p. 145–59.
32. Hanb, J., Kimb, H., Minamib, H., Shimizuc, W., Wang, T.G (2008), The effect of the particle size of alumina sand on the combustion and emission behavior of cedar pellets in a fluidized bed combustor. Bioresour. Technol. vol. 99, no. 9, p. 3782–3786.
33. Zhao, Y., Sun, S., Zhou, H., Sun, R., Tian, H., Luan, J., Qian, J. (2010), Experimental study onsawdust air gasification in an entrained-flow reactor, Fuel Processing Technology, vol. 91, p. 910–914.
34. Senapati, P.K., Behera, S. (2012) Experimental investigation on an entrained flow type biomass gasification system using coconut coir dust as powdery biomass feedstock, Bioresource
Technology, vol. 117, p. 99–106.
35. Wang, L., Weller, C.L., Jones, D.D., Hanna, M.A. (2008) Contemporary issues in thermal gasification of biomass and its application to electricity and fuel production. Biomass
Bioenergy, vol. 32, p. 573–81.
36. Mathieu, P., Dubuisson, R. (2002) Performance analysis of a biomass gasifier. Energy Convers. Manage. 43, p. 1291– 1299.
37. Sharma A. K. (2008) Equilibrium modeling of global reduction reactions for a downdraft (biomass) gasifier. Energy
Convers Management, vol. 49, p. 832–42.
38. Vaezi, M., Passandideh-Fard, M., Moghiman, M., Charmchi, M. (2011) Gasification of heavy fuel oils: A thermochemical equilibrium approach. Fuel, vol. 90, p. 878–85.
39. Rapagna, S., Jana, N., Kiennemann, A., Foscolo, P.U. (2000) Steam-gasification of biomass in a fluidized-bed of olivine particles. Biomass Bioenergy, vol. 19, p. 187–197.
40. Franco, C., Pinto, F., Gulyurtlu, I., Cabrita, I. (2003) The study of reactions influencing the biomass steam gasification process. Fuel, vol. 82, p. 835–842.
41. Van der Stelt, M.J.C., Gerhauser, H., Kiel, J.H.A., Ptasinski, K.J. (2011) Biomass upgrading by torrefaction for the production of biofuels: a review. Biomass Bioenergy, vol. 35, p. 3748–3762.
42. Hayashi, J.I., Hosokai, S., Sonoyama, N. (2006) Gasification of low-rank solid fuels with thermochemical energy recuperation for hydrogen production and power generation.
Process Saf. Environ, vol. 84, p. 409–419.
43. Hu, S., Xiang, J., Sun, L., Xu, M., Qiu, J., Fu, P. (2008), Characterization of char from rapid pyrolysis of rice husk.
FuelProcess Technol. vol. 89, p. 1096–1105.
44. Lv, D., Xu, M., Liu, X., Zhan, Z., Li, Z., Yao, H. (2010) Effect of cellulose, lignin, alkali and alkaline earth metallic species on biomass pyrolysis and gasification, Fuel
Processing Technology, vol. 91, p. 903–909.
45. Sluiter, A., Hames, B., Ruiz, R., Scarlata, C., Sluiter, J., Templeton, D., Crocker, D. (2008) Determination of structural carbohydrates and lignin in biomass, Laboratory Analytical Procedure (LAP), National Renewable Energy Laboratory Technical Report, NREL/TP-510-42618 NREL Golden, NREL, CO, USA.
46. Ramajo-Escalera, B., Espina, A., García, J.R., Sosa-Arnao, J.H., Nebra, S.A. (2006) Model-free kinetics applied to sugarcane bagasse combustion, Thermochimica Acta, vol. 448, p. 111–116.
47. Gil, M.V., Casal, D., Pevida, C., Pis, J.J., Ribiera, F. (2010) Thermal behaviour and kinetics of coal/biomass blends during co-combustion, Bioresource Technology, vol. 101, p.5601– 5608.
48. Demirbas, A. (2004) Combustion characteristics of different biomass fuels, Progress in Energy and Combustion Science, vol. 30, p. 219–230.
49. Haykiri-Açma, H. (2003) Combustion characteristics of different biomass materials, Energy Conversion and