Publication Date: July. 25, 2019
DOI: 10.14738/abr.77.6651.
Septria, D., & Heryanto. (2019).Performance Capability Analysis And Regional Budget Evaluation In Implementing Regional Autonomy In Dharmasraya District. Archives of Business Research, 7(7), 180-187.
Performance Capability Analysis And Regional Budget
Evaluation In Implementing Regional Autonomy In
Dharmasraya District
Doni Septria
Master of Management, STIE “KBP “, JL Khatib Sulaiman No. 61 Lolong Belanti, Padang Utara 25136, West Sumatra, Indonesia
Heryanto
Lecturer in Management Master Program, STIE “KBP”, JL Khatib Sulaiman No. 61 Lolong Belanti, Padang Utara 25136, West Sumatra, Indonesia
ABSTRACT
This study tries to find out the Performance Capability Analysis and Evaluation of Regional Budget in Running Regional Autonomy in Dharmasraya Regency. The research population is the financial report of the Regional Government of Dharmasraya Regency since the establishment of this district in 2004 by taking samples of financial statements for the past 4 years. This study uses the method of financial ratio analysis. The results of the study show that the district financial independence ratio Dharmasraya is in the instructive criteria, meaning that regional financial independence is still very low because this role is more dominant than the independence of local governments. The degree of fiscal decentralization is in the very poor category, where the average is less than 10%, which is 7.92%, which means that Dharmasraya District's Original Revenue in financing its own development is only 7.29% of the total Regional Revenue during the 2014-2017 period The effectiveness of the PAD ratio is in the effective criteria, meaning that the ability of the Dharmasraya Government to realize PAD revenues is an average of 86% of the targeted PAD. The activity ratio shows that the Dharmasraya District Government uses more funds for apparatus shopping activities than public spending. The shopping harmony ratio shows that the Dharmasraya District Government uses more funds for indirect shopping activities compared to direct shopping. The empirical findings indicate that for the performance of the Regional Secretariat staff in the Dharmasraya Regency, the Regional Secretariat of the Dharmasraya Regency needs to pay attention and focus more on improving the Competency and Workload factors.
Keywords: Capability Analysis, Performance, Evaluation
INTRODUCTION
RESEARCH PURPOSES
Based on the formulation of the problem that the researcher revealed above, the objectives of this study are:
1. To determine the ability of APBD performance in terms of independence ratio, ratio of
fiscal decentralization, PAD effectiveness ratio, activity ratio and expenditure compatibility ratio?
2. Knowing the financial capabilities of the Dharmasraya District Government in
implementing regional autonomy in the 2014-2017 period in terms of the Financial Ability Index (IKK) and Permendagri No. 62 of 2017?
3. Evaluation of the Dharmasraya District Government budget in the implementation of regional autonomy in the period 2014 - 2017 in terms of analysis of income variance and analysis of expenditure variance?
Anggaran Realisasi Rp %
4 PENDAPATAN
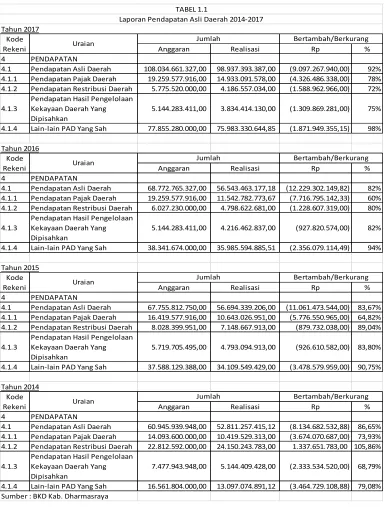
4.1 Pendapatan Asli Daerah 108.034.661.327,00 98.937.393.387,00 (9.097.267.940,00) 92% 4.1.1 Pendapatan Pajak Daerah 19.259.577.916,00 14.933.091.578,00 (4.326.486.338,00) 78% 4.1.2 Pendapatan Restribusi Daerah 5.775.520.000,00 4.186.557.034,00 (1.588.962.966,00) 72%
4.1.3 Pendapatan Hasil Pengelolaan Kekayaan Daerah Yang Dipisahkan
5.144.283.411,00
3.834.414.130,00 (1.309.869.281,00) 75%
4.1.4 Lain-lain PAD Yang Sah 77.855.280.000,00 75.983.330.644,85 (1.871.949.355,15) 98%
Tahun 2016
Anggaran Realisasi Rp %
4 PENDAPATAN
4.1 Pendapatan Asli Daerah 68.772.765.327,00 56.543.463.177,18 (12.229.302.149,82) 82% 4.1.1 Pendapatan Pajak Daerah 19.259.577.916,00 11.542.782.773,67 (7.716.795.142,33) 60% 4.1.2 Pendapatan Restribusi Daerah 6.027.230.000,00 4.798.622.681,00 (1.228.607.319,00) 80%
4.1.3
Pendapatan Hasil Pengelolaan Kekayaan Daerah Yang Dipisahkan
5.144.283.411,00
4.216.462.837,00 (927.820.574,00) 82%
4.1.4 Lain-lain PAD Yang Sah 38.341.674.000,00 35.985.594.885,51 (2.356.079.114,49) 94%
Tahun 2015
Anggaran Realisasi Rp %
4 PENDAPATAN
4.1 Pendapatan Asli Daerah 67.755.812.750,00 56.694.339.206,00 (11.061.473.544,00) 83,67% 4.1.1 Pendapatan Pajak Daerah 16.419.577.916,00 10.643.026.951,00 (5.776.550.965,00) 64,82% 4.1.2 Pendapatan Restribusi Daerah 8.028.399.951,00 7.148.667.913,00 (879.732.038,00) 89,04%
4.1.3
Pendapatan Hasil Pengelolaan Kekayaan Daerah Yang Dipisahkan
5.719.705.495,00
4.793.094.913,00 (926.610.582,00) 83,80%
4.1.4 Lain-lain PAD Yang Sah 37.588.129.388,00 34.109.549.429,00 (3.478.579.959,00) 90,75%
Tahun 2014
Anggaran Realisasi Rp %
4 PENDAPATAN
4.1 Pendapatan Asli Daerah 60.945.939.948,00 52.811.257.415,12 (8.134.682.532,88) 86,65% 4.1.1 Pendapatan Pajak Daerah 14.093.600.000,00 10.419.529.313,00 (3.674.070.687,00) 73,93% 4.1.2 Pendapatan Restribusi Daerah 22.812.592.000,00 24.150.243.783,00 1.337.651.783,00 105,86%
4.1.3
Pendapatan Hasil Pengelolaan Kekayaan Daerah Yang Dipisahkan
7.477.943.948,00
5.144.409.428,00 (2.333.534.520,00) 68,79%
4.1.4 Lain-lain PAD Yang Sah 16.561.804.000,00 13.097.074.891,12 (3.464.729.108,88) 79,08% Sumber : BKD Kab. Dharmasraya
TABEL 1.1
Laporan Pendapatan Asli Daerah 2014-2017 Tahun 2017
Kode
Rekeni Uraian
Jumlah Bertambah/Berkurang
Kode
Rekeni Uraian
Jumlah Bertambah/Berkurang Kode
Rekeni Uraian
Jumlah Bertambah/Berkurang
Kode
Rekeni Uraian
Dharmasraya District. Archives of Business Research, 7(7), 180-187.
LITERATURE REVIEW Regional Finance
In a narrow sense, regional finance is limited to matters relating to the Regional Budget. Therefore regional finance is identical to the Regional Budget. Based on PP No. 58 of 2005, regional finance is "All regional rights and obligations in the context of the implementation of Regional Government which can be valued with money including all forms of wealth related to those rights and obligations". The rights and obligations of the area need to be managed in a system of regional financial management. Regional financial management is a subsystem of the state financial management system and a key element in the implementation of the Regional Government.
According to Halim (2004: 20), "The scope of regional finance consists of regional finances managed directly and separated regional assets. Included in the finances that are managed directly are the Regional Budget and inventory items belonging to the region. Whereas regional finance which is separated includes Regional Owned Enterprises (BUMD).
Regional Budget
At Permendagri Number 13 of 2006, "APBD is the basis of regional financial management in the period of 1 (One) fiscal year from January 1 to December 31". Whereas, according to Bastian (2006: 189), "APBD is the responsibility of the Regional Government work plan in the form of a unit of money for a period of one year and oriented towards the goal of public welfare".
According to Freeman in Nordiawan (2006: 48), "Budget is a process carried out by public sector organizations to allocate their resources into unlimited needs". This definition reveals the strategic role of the budget in managing the wealth of a public organization. The important role of the budget in the public sector according to Nordiawan (2006: 47), "The important role of the budget in the public sector comes from its usefulness in determining the estimated income or amount of bills for services rendered".
Performance of Regional Budget (APBD)
According to Bastian (2006: 274), "Performance is a description of the achievement of an activity / program / policy in realizing the goals, objectives, mission and vision of the organization". Performance indicators are quantitative and qualitative measures that describe the level of achievement of a predetermined goal or goal by taking into account input indicators (inputs), outputs (outputs), results, benefits and impacts. Analysis of budget performance can be done in three parts, namely (Mahmudi, 2007):
Jenis dan Sumber Data
The type of data used in this study is quantitative data. Quantitative data is data in the form of numbers, values can vary and vary. While the data sources used in this study are secondary data. Secondary data is data that is obtained indirectly and through an intermediary which can be in the form of evidence, historical records or reports arranged in published and unpublished archives. The data in this study were obtained directly from the accounting field of the Regional Finance Agency (BKD) of the Dharmasraya Regency Government.
Population and Samples
DATA ANALYSIS TECHNIQUE To analyze financial performance
Independence Ratio
The regional financial independence ratio shows the level of ability of a region in self-financing of government activities, development and services to the people who have paid taxes and levies as a source of regional income.
Regional Independence
Ratio (%) = Locally-generated revenue Balancing Fund x 100%
Degree of Fiscal Decentralization Ratio
The degree of fiscal decentralization ratio shows the degree of PAD contribution to total regional income.
Degree of Fiscal
Decentralization Ratio (%) =
Locally-generated
revenue x 100%
Total Regional Revenue
PAD Effectiveness Ratio
The effectiveness ratio of PAD shows the ability of regional governments to realize planned PAD compared to predetermined targets based on the real potential of the region.
PAD Effectiveness Ratio (%) =
Realization of PAD
Revenue x 100%
Target of PAD Revenue
Activity Ratio
The activity ratio illustrates how local governments prioritize their allocation of funds in operating expenditure and capital expenditure optimally.
Apparatus Shopping Ratio (%) =
Total Operating
Expenditures x 100%
Total Shopping
Public Expenditure Ratio (%) =
Total Capital
Expenditures x 100%
Total Shopping
Shopping Harmony Ratio
The expenditure harmony ratio illustrates how local governments prioritize their allocation of funds in direct expenditure and indirect expenditure optimally.
No Shopping Ratio = Direct (%)
Indirect Shopping Total x
100% Total Regional Expenditures
Direct Expenditure Ratio (%) =
Direct Shopping Total
x 100% TotalRegionalExpendit
Dharmasraya District. Archives of Business Research, 7(7), 180-187.
Analyzing fiscal capacity
Financial Capability Index (IKK)
The Financial Capability Index describes the level of regional financial capacity by compiling three components, namely the calculated average of growth index, elasticity index and role index ( share ).
X Index = (Value x Measurement Results) - (Minimum Condition Value)
(Maximum x value) - (Minimum Condition Value)
IKK = Xԍ + Xᴇ + Xş
3
Permendagri No. 62 of 2017
Determination of regional financial capability groups is calculated based on the amount of regional general income (PAD, DBH and DAU) minus the expenditure of civil servants (expenditure of salaries and benefits and additional income for employees).
To evaluate regional government budgets Analysis of income variance
The revenue budget is the minimum limit on the amount of targeted income that must be obtained by the regional government.
Variance shopping analysis
Shopping variance analysis is an analysis of differences or differences between the realization of expenditure and the budget.
RESULTS AND DISCUSSION
District financial capability Dharmasraya seen from the index of low financial ability and so also seen from Permendagri No.62 of 2017 also obtained a low score. While for budget evaluation it was seen from the aspect of income variance of Kab. Dharmasraya for 2014-2017 is in an unfavorable position and is seen and the aspect of APBD expenditure Variance in Kab. Dharmasraya in 2014-2017 was in the preferred position.For more details, can be seen in the following table 4.24.
Realisasi Pendapatan
Anggaran Pendapatan x 100 Varians Pendapatan (%) =
Realisasi Belanja Anggaran Belanja
Based on the instructive relationship pattern, the central government's intervention is more dominant than the independence or the low ability of the local government to carry out autonomy.
From the results of these percentages, the criteria for the degree of fiscal decentralization in the Dharmasraya District Government are said to be lacking. This shows that the level of authority and responsibility given by the central government to local governments tends to be small
The average expenditure of the Dharmasraya Regency Government apparatus for 4 years is a budget period of 63.3%. This shows that the Dharmasraya District Government uses more funds for apparatus shopping activitiesthan for public expenditure, meaning that the benefits of funds spent on the community are still lacking
The average public expenditure ratio of the Dharmasraya Regency for 4 years is a budget period of 29.2%. This shows that the Dharmasraya District Government uses less funds for public expenditure activities, whereas funds from public expenditure are used for the benefit of the community which includes three areas, namely health, education and social welfare.
Variabel Indikator Standar Parsial Hasil
1. Instruktif 2. Konsultatif 3. Partisipatif 4. Delegatif 1. Sangat Kurang 2. Kurang
3. Sedang 4. Cukup 5. Baik
6. Sangat Baik 1. Sangat Efektif 2. Efektif
3. Cukup Efektif 4. Kurang Efektif 5. Tidak Efektif Rasio Aktivitas
a. Rasio Belanja Aparatur b. Rasio Belanja Publik Rasio Keserasian Belanja a. Rasio Belanja Langsung b. Rasio Belanja Tidak Langsung 1. Rendah 2. Sedang 3. Tinggi 1. Rendah 2. Sedang 3. Tinggi 1. Menguntungkan (favorable)
2. Tidak
Menguntungkan (unfavorable) 1. Disukai 2.Tidak Disukai
Tabel 4.24
Rangkuman Hasil Pengukuran Kinerja dan Kemampuan Keuangan serta Evaluasi
Kinerja Keuangan
Rasio Kemandirian Instruktif
Rasio Derajat
Desentralisasi Fiskal Sangat Kurang
Rasio Efektivitas Sangat Efektif
Belanja publik > belanja aparatur
Belanja aparatur > belanja publik
Belanja langsung > belanja tidak langsung
Belanja tidak langsung > belanja langsung
Kemampuan Keuangan
Indeks Kemampuan
Keuangan Rendah
Permendagri No. 62 tahun
2017 Rendah Evaluasi Anggaran Varians Pendapatan Tidak Menguntungkan (unfavorable)
Dharmasraya District. Archives of Business Research, 7(7), 180-187.
The average direct expenditure ratio of Dharmasraya Regency for 4 years is a budget period of 45.5%. This means that the Dharmasraya District Government uses little funds for direct shopping activities such as office operational expenditure and capital expenditure.
The average Growth Index of the Regional Budget of the Regency of 2014 for the period 2014-2017 is 0.2908. This is obtained from the number of growth indices divided by the number of years in that period
So the average APBD Elasticity Index District. Dharmasraya in the 2014-2017 Budget year for four years which is equal to 0.3266
CONCLUSIONS AND RECOMMENDATIONS
The measurement of the Dharmasraya District Government's financial performance in the implementation of regional autonomy in the period of 2014-2017 can be concluded from:
a. Regency financial independence ratio. Dharmasraya is in the instructive criteria, meaning that regional financial independence is still very low because this role is more dominant than the independence of local governments.
b. The degree of fiscal decentralization is in the very poor category, where the average is less than 10%, which is 7.92%, which means that Dharmasraya District's Original Revenue in financing its own development is only 7.29% of the total Regional Revenue during the 2014-2017 period
c. The effectiveness of the PAD ratio is in the effective criteria, meaning that the ability of the Dharmasraya Government to realize PAD revenues is an average of 86% of the targeted PAD.
d. The activity ratio shows that the Dharmasraya District Government uses more funds for
apparatus shopping activities than public spending.
e. The shopping harmony ratio shows that the Dharmasraya District Government uses more funds for indirect shopping activities compared to direct shopping.
Based on (Permendagri No.62 of 2017) regarding the grouping of regional financial capabilities as well as the implementation and accountability of operational funds, the Regional Financial capacity of the regency / city is grouped as follows:
a. Above Rp.550,000,000,000.00 (five hundred and fifty billion rupiahs) are grouped in High-Regional Financial Capabilities;
b. Rp. 300,000,000,000.00 (three hundred billion rupiahs) up to Rp. 550,000,000,000.00 (five hundred fifty billion rupiahs) grouped in medium Regional Financial Capabilities; and
c. under Rp. 300,000,000,000.00 (three hundred billion rupiahs) are classified into low Regional Financial Capabilities
1. District financial capability Dharmasraya shows a value of Rp
237,780,059,994.40 based on Permendagri 62 of 2017, Kab. Dharmasraya belongs to the low group
2. Judging from the Financial Capability Index (IKK), the index shows the number
0.3297 which includes the low category ability scale.
expenditure in 2014-2017 it is in the preferred criteria, namely where the realization of regional expenditure is below the stipulated budget
SUGGESTION
Based on the conclusions outlined above, some suggestions can be given as follows:
For the Dharmasraya Regency Government
a. The Dharmasraya District Government must be able to optimize the receipt of existing
sources of income (changes to regional regulations on taxes and levies). The Dharmasraya Regency Government must also be more creative in finding and exploring new sources of income, considering that Dharmasraya Regency still has resource potentials that have not been managed optimally such as mining, agriculture, forestry, plantation and tourism. The regional government must also be able to attract investors to invest their capital in Dharmasraya Regency so that regional income sources can vary.
b. The Dharmasraya District Government should be more selective in the use of regional
spending on personnel expenditure and goods expenditure which dominates a large part of total regional expenditure. The government should place employees both ASN and THL who have skills in taxation and accounting pawns or other economics.
c. Increasing the dissemination of local regulations regarding PAD to the community so as to increase public awareness to pay taxes and levies because in the era of regional autonomy the achievement of targets for receiving PAD greatly determines the success of the region in spurring all aspects of regional development.
d. The Dharmasraya District Government must be more careful in determining the
imposition of PAD tax objects and real potential so that the realization can be achieved according to the set targets.
For Further Researchers
For further researchers who use the same research, it is recommended to carry out exploratory studies in each component of the APBD so that the results of the study can be more specific.
BIBLIOGRAPHY
Bastian, Indra. 2010. Akuntansi Sektor Publik Suatu Pengantar.Edisi Ketiga. Jakarta: Erlangga.
Bisma, I Dewa Gde dan Hery Susanto. 2010. Evaluasi Kinerja Keuangan Daerah Pemerintah Provinsi Nusa Tenggara
Barat Tahun Anggaran 2003-2007. Edisi Khusus. Ganec Swara.
Faqihudin, M. 2011. Analisis Kinerja Anggaran Pendapatan dan Belanja Daerah Kota Tegal sebagai Indikator
Layanan Publik. Universitas Pancasakti Tegal.
Halim, Abdul. 2004. Akuntansi Keuangan Daerah – Akuntansi Sektor Publik. Jakarta: Salemba Empat.
pada PD. Pasar Kota Kendari). Universitas Halu Oleo.
Paturusi, dkk. 2009. Esensi dan Urgensitas Peraturan Daerah dalam Pelaksanaan Otonomi Daerah. Universitas Sumatera Utara.
Peraturan Menteri Dalam Negeri Nomor 13 Tahun 2006 tentang Pedoman Pengelolaan Keuangan Daerah. Savitry, Emitha M. 2013. Analisis Kemampuan Keuangan Daerah dalam Pelaksanaan Otonomi Daerah Tahun