Published online June 09, 2014 (http://www.sciencepublishinggroup.com/j/ijepp) doi: 110.11648/j.ijepp.s.2014020601.11
ISSN: 2330-7528 (Print); ISSN: 2330-7536 (Online)
Dynamic performance evaluation on energy saving and
emission reduction of thermal power plant based on the
self-organizing co-evolution
Zhang Lei
1, 2, Li Na-na
1, Zhao Hui-ru
1, Yang Kun
11
The Institute of Economics and Management, North China Electric Power University, Beijing, China 2
State Development and Investment Corporation, Beijing, China
Email address:
[email protected] (Li Na-na)
To cite this article:
Zhang Lei, Li Na-na, Zhao Hui-ru, Yang Kun. Dynamic Performance Evaluation on Energy Saving and Emission Reduction of Thermal Power Plant Based on the Self-Organizing Co-Evolution. International Journal of Environmental Protection and Policy.
Special Issue: Energy, Environmental and Climate Policy.Vol. 2, No. 6-1, 2014, pp. 1-9. doi: 10.11648/j.ijepp.s.2014020601.11
Abstract:
The energy saving and emission reduction in thermal plant is complex, with the open, non-equilibrium and interoperability features. In order to identifying the order parameters affecting plant system, a co-evolution model of energy saving and emission reduction in thermal power plant was built based on synergetic theory. According to the feathers of potential function based on mutation theory, the performance was divided into high efficiency, low efficiency and critical situation three operating states. Then, a dynamic evaluation rule was proposed in order to achieve dynamic performance evaluation on energy saving and emission reduction of thermal power plant. Finally, an empirical analysis of a thermal power plant showed that the order parameter of energy saving and emission reduction in this plant are soot emissionper unit power and grid electricity generation. There existed “high efficiency” and “low efficiency” performance status of energy saving and emission reduction. The performance before June in 2012 was mostly inefficient, things have changed since the investment in energy saving technology projects, the energy saving and emission reduction performance in this plant after June 2012 was highly efficient, which was in line with the actual situation, and proved the validity of this method used in dynamic performance evaluation on energy saving and emission reduction of thermal power plant.Keywords:
Energy Saving and Emission Reduction, Synergetic Subject, Order Parameter, Potential Function, Performance Evaluation1. Introduction
Faced with the grim situation in energy and environment, thermal power plants need to assume more responsibility in energy saving and emission reduction, since it is not only the major industry of China's energy generation and consumption, but also the focus of energy saving and emission reduction in China. Simultaneously, the energy saving and emission reduction performance would affect the development of enterprise and the sustainable development of China's economy. In recent years, many thermal power enterprises continue to strengthen their energy saving and emission reduction management, while increase the relevant technology investment to improve their performance on energy saving and emission reduction.
System is composed by some elements which are interacted, interconnected and restricted among each other,
According to synergetic theory, there are both competition and collaboration functions among the internal elements in a complex system[3]. It is the interactive relationship that promotes system to evolve dynamically. When the nature of system has changed, there are only a few variables dominate the evolution of the entire system and make it converse from the disordered state to the order continuously. This paper would use complex system science synergetic theory to realize the evaluation of energy saving and emission reduction performance of thermal power plant. Through analyzing the interaction relationships among internal factors, we could find the key factors that determine the system performance. Then, the trend of these key factors can be used to probe the evolution of the whole system [2].
2. Complexity Analysis on Energy
Saving and Emission Reduction of
Thermal Power Plant
A thermal power plant consists of furnace, steam turbine, electric and their respective corresponding auxiliary equipment and involves energy conversion, which means that itis a complex system constituted by a number of interacting factors. Therefore, the energy saving and emission reduction of thermal power plant is provided by all
characters of complex systems. The openness,
non-equilibrium and coordination properties of energy saving and emission reduction of thermal power plant are focused in this paper.
The energy saving and emission reduction of thermal power plant is open. In the generation process of plant, there exists material, energy and message exchange among the plant, nature environment and social environment. For example, plants need to purchase coal in the energy market, so the coal quality will affect the efficiency of furnace and the emission concentration of pollutants; electricity load will affect the efficiency of machines, power generation rate and the operational efficiency of denitration device; the use of fly ash and desulfurization byproducts will be affected by market prices. In a word, the thermal power plants constantly exchange materials, energies and messages with the outside world in the whole power generation process. Dissipative structure is a theory which discusses the mechanism, conditions and rules of an open system conversing from the disordered state to the order. Dissipative structure theory points out that a system without exchange of materials, energies and messages will ultimately end up to disordered state. Therefore, the open character will promote energy saving and emission reduction of thermal plant evolving to an order state.
The energy saving and emission reduction of thermal power plant is always in a non-equilibrium state. Dissipative structure theory suggests that the equilibrium structure is a "dead" structure, and only the open and non-equilibrium system could go to order. In the power generation process, the thermal power plants constantly exchange material and
information with outside. Since the external conditions, such as electricity load, coal quality and natural conditions, are constantly changing, the operating status of generation equipment is also affected and in a dynamic non-equilibrium state. It is the non-equilibrium feature that makes the energy saving and emission reduction evolve to an order state.
The energy saving and emission reduction of thermal power plant has synergistic feature. Synergistic theory reveals a system’s evolving process of "old structure to instability to the new structure" [4]. Similarly, the energy saving and emission reduction of thermal power plant also experiences the evolving process from an old structure to a new one, with synergistic property. Many thermal power plants constantly improve traditional production process and use advanced primary, auxiliary equipment of dust removal,
desulfurization and denitrificationetc. Each device
automatically adjusts its work condition under the control system, so the whole plant can operate efficiently, and the coal consumption rate, electricity consumption rate, SO2, NOx and soot emissions can be controlled. These kind of reformations change the running of thermal power plant significantly. The traditional electricity generating structure is broken, and new technology can make equipment coordinate with each other which upgrade the system efficiency. Both existence of the competition and synergy make different parts of the system a better effect. Thus, the system has an evolution synergistic property.
3. Establishing the Co-Evolution Model
for Dynamic Performance Evaluation
of Energy Saving and Emission
Reduction in Thermal Plant
3.1. The Basic Principles of Synergetic Subject
Synergetic subject is a theory put forward by the German physicist Haken, which studies the complex system consisting a large number of subsystems and reveals the common principles of macro-variation in structure and nature of complex systems [5]. Synergetic subject reputes that subsystems of complex system exist mutual cooperation and competition, which are the dynamic evolution of system. As for the development of the system, the natures of the different variables in the system are different [6]. Some variables play key roles while others are nonessential. In the critical conversion process of the system, some variables with big resistance decay fast which are called the fast
variables; some variables with undamped critical
interaction between the subsystems, the order parameter value changes as well. When the system reaches the critical area, synergy between subsystems plays a crucial role and the order parameter growing exponentially reaches saturation, thus a certain order structure will show in macro view[8]. This is the dominant principles of synergetic subject that order parameters can be used to describe the state changes of system.
Through building the co-evolution model for the system, the synergetic subject can study the evolution regular pattern of system and explore the key variable, constant, and the linkage among the variables. The basic evolution equation of synergetic subject can be generally written in the form of Langevin’s equation as follows:
(1)
where, represents the rate of change of different state
variables; is the state variable; is the control
parameter; is the random fluctuating force. The
evolution model contains of and the different order derivative differential equations of [9].
3.2. Construction of Co-Evolution Model
Energy saving and emission reduction performance indicators of thermal power plant are generally non-consecutive monthly data. The Gray theoretical model can deal with discrete data sequence well. It also can reveal the changing laws and characterize the evolution and development state of data [10]. Therefore, co-evolution model of energy saving and emission reduction of thermal power plant can be constructed through combining the gray theoretic model and synergetic subject. The traditional
model is defined as follow:
(2)
where, is the developing term reflecting the growth
of the variablesi in evolution process; is the driven
termreflecting the driving effect of the other variables to variable, and N is the amount of variables.
According to the synergetic subject, the change rate of variables is limited by their own development capacity and affected by the interaction among variables and external interference (fluctuation)in the evolution process of system[11]. Among them, the self-development capacity is reflected by the developing terms of the variable; interaction among variables is the net effect of competition and coordination role between variables, that is difference between hinder capability and drive capability; random fluctuations is primarily related to random factors. Learn
from the literature [12], is the self-developing
capability of variableiat time t, is the damping
coefficient of thevariablei, reflecting the decay rate of the i
indicator; is the driving force of the rest
sub-variables onvariablei, is the hindering
factor, where is the driving coefficient, is the
obstruction coefficient and is outside interference.
The evolution equation of the system can be generally written in the form of Langevin’s equation:
(3)
Where, mrepresents the number of variables. For any nonlinear evolution system, internal factors are the essential reason for system evolution, external factors are random reasons contributed to the occurrence of a qualitative change in the critical point for the system evolution. In this paper, the deviation of order parameter caused by internal factors is mainly analyzed. In the evolution process of energy saving
and emission reduction of thermal power plant, the is
the outside interference [13].This article mainly analyzed the internal cause that make the order parameter deviate.
4. Dynamic Performance Evaluation on
Energy Saving and Emission
Reduction of Thermal Power Plant
with Mutation Theory
4.1. Relations between the State of the System and Potential Function
Synergetic principles indicate that the operational status of the system can be studied by the order parameters, however, it does not explain the correspondence between the order parameters and the system state. In mutation theory, the system state is reflected by potential function which is composed by system elements, and the potential function is the potential energy of the system respect to its variable[14]. Every system has its potential, when the interaction of the elements within the system promote the evolution of the system, the potential energy of the system becomes greater, the system is in a relatively disordered state, and the deviation from their own status is the greater; the smaller the potential energy is, the more stable the system is and in a relatively orderly state. Therefore, the study of system stability is equal to study the changes of potential function of system. For energy saving and emission reduction of thermal power plant, assuming it contains nstate variables
, and the different points of the potential function corresponds to different states of energy saving and emission reduction in thermal power plant. Therefore, through analyzing the time-varying characteristics of potential function, dynamic performance evaluation on energy saving and emission reduction of thermal power plant can be achieved[15].
Principle of synergetic order parameter shows that, changes in the structure of system are determined by a few order parameters which characterize the major contradiction
( , ) ( )
dq
K q a f t
dt = +
dq dt
q
α
( ) f tq
q
) , 1 ( N GM∑
≠=
+
N i j j j i i ix
b
x
a
dt
dx
i ix
a
−
j jx
b
) ( t x ai ii
a
) ( t
x bj j
) ( ) (x 2 t
cj j
j
b cj
) ( t fi ) ( ] ) (
[b x c x 2 f t
x a dt dx i j j m i j j j i i
i + =
∑
+ +≠ ) (t fi n x x x1, 2,⋯
) , , (x1 x2 xn
of the system. Therefore, the dynamic evaluation of the thermal power enterprise energy saving and emission reduction performance can take systematical order parameters as a research object. Through analyzing the changes of the potential function, we can know the status of the entire system and evaluate the performance of the system.
When there is only one order parameter in the system, it is easy to obtain potential function. However, when there are multiple order parameters, the static solution of equations is complex and we can’t take advantage of the potential function for analysis. In this paper, linear weighting method is used to integrate the order parameters into a comprehensive order parameter, then analysis the system state with the above method of potential function analyzing.
Define as the comprehensive order parameter of
the system, where, is the order parameter, nis the number
of the order parameters, while .Weights
of the order parameters can be selected according to the actual situation.
4.2. State Division for Energy Saving and Emission Reduction of Thermal Power Plant
As mutation theory shows, the gradient function of the potential function is dynamic equation of system evolution. Assuming the order parameters of energy saving and emission reduction in thermal power plant is x, its potential function is V, and t represents time, the relationship between the potential function and the order parameters of the power system meets the gradient equation, namely
(4)
The characteristics of potential function for energy saving and emission reduction in thermal power plant reflect the different states of energy saving and emission reduction performance. Take one-dimensional potential function for example, there exist three special points on function image, they are: stable point, mutated point and repeller.
(1) Stable point. It is the minimum point of the potential
function, meet the condition . In this
case, the ability to deviate from the current state of the system is very small, the potential energy is minimum, and the system is in the steady state.
(2) Mutated point. It is a branch point of the potential
function, meet the condition In this
case, the system evolves into a critical state of mutation, and is a changing point where the stability of the system equilibrium state changes.
(3) Repeller. It is the maximum point of the potential
function, meet the condition . In this
case, the potential energy of the system is maximum, the structure of the potential function is unstable, slight
disturbance could cause state mutation and the system is in the unstable state.
(4) When , it means that the potential function does
not exist steady-state, which indicates that the system has been changing, neither reaches a steady state, normutation. The system is not only possible to a stable state, but also is possible to unstable state.
Combining characteristics of the system with the potential function curve, the performances state of energy saving and emission reduction system of thermal power plant is divided into three states, they are high efficiency, low efficiency and the critical situation. The operating state at any time of energy saving and emission reduction system in thermal power plant can be attributed to one of the three state, just with different tendency degree.
(1) High efficiency state A. Energy saving and emission reduction performance in thermal power plant is in an orderly, stable running and all variables are coordinated. The small changes of each variable will not cause instable fluctuations of the order parameter. Therefore, it will not affect the stability of the entire system running either. High efficiency state is corresponds to the minimum point of the potential function, that is the stable point of the potential function.
(2) Low efficiency state B. Energy saving and emission reduction performance in thermal power plant has been in anillusive steady state, there exists instability in nonlinear relationships between variables. A slight fluctuation of a certain index could cause major change of the order parameter, then the operation efficiency of energy saving and emission reduction also will fluctuate. In this case, energy saving and emission reduction performance of thermal power plant is in an inefficient and dangerous stage. Low efficiency state is corresponds to the maximum value points of the potential function, namely, the repeller.
(3) Critical state C. Energy saving and emission reduction system of thermal power plant has broken the original steady state which could be high efficiency state or low efficiency state. Mutation would occur in the system efficiency, changes of the variables are quite different compared with the state before mutation. Critical state is corresponding to the branch point of potential function, that is, the mutated point.
4.3. Dynamic Performance Evaluation on Energy Saving and Emission Reduction of Thermal Power Plant
After obtaining the potential function of energy saving and emission reduction system in thermal power plant, performance valuation could be achieved by analyzing the characteristics of the potential function. As the state of energy saving systems at any time is corresponding to one point of the potential function space, the following method can be used to evaluate the performance of the system, take one-dimensional potential function as an example:
(1) For the state variable of energy saving and emission reduction at any time, define the membership
function , , .the value of
1
n
i i i
r
ω
x=
=
∑
i
x
1 1 n
i i
ω
= =
∑
0≤ωi≤1dV dx
dt = −dt
0 / , 0
/ = 2 2> dx v d dx dv
0 / , 0
/dx= d2v dx2= dv
0 / , 0
/ = 2 2< dx v d dx dv
0
≠
dx dv
x
)
(x
indicates the membership degree that reduction condition of energy saving system corresponding to belongs to state L.
(2) The first derivative and the second derivative are
denote as , where . The order
parameter at any time, when , the
potential function is at the minimum point, the energy
saving system is in high efficiency state, in this case, ;
when , the potential function is at the
maximum point, the energy saving system is in low
inefficiency state, in this case, ; when
, the potential function is at the mutated point, the energy saving system is in a critical state, at this point,
.
(3) Calculate respectively when and
denote as , .For the order parameter at
any time, the degree of membership can be denoted by the
similarity degree between and ,that is,
the gray correlation can indicate this similarity. As for sequence contains two variables, the membership is:
(5)
Where, , ,
is resolution factor , usually taken as 0.5 .
(4) Calculate and sort , select the
state where the membership is maximum as performance state of energy saving and emission reduction system of thermal power plant.
5. Empirical Analysis
5.1. Select the State Variables for Evolutionary Model
The energy saving and emission reduction of thermal power plant is divided into two subsystems, one is energy saving and the other is emission reduction. Through the analysis of factors which influence the performance of energy saving and emission reduction in thermal power plant, the factors affecting the performance of the thermal power enterprise energy saving are: electricity generation, coal input, calorific value of coal, rate of house power, power supply coal consumption, on-grid power, water consumption rate. And all the follows are emission reduction factors: the amount of desulfurization, the amount of denitrification, the amount of dust falls, SO2 emissionsper unit power, nitrogen oxide emissionper unit power, soot emissionsper unit power, solid waste utilization, sewage gain [16,17].
The basic thought of synergetic is through transferring high-dimensional problems into low- dimensional problems
to deal with complex problems. From the results of the current study, the most scientific and rigorous method is the "adiabatic elimination" in order parameter identification, but the biggest problem faced by adiabatic elimination method is that the large number of influencing factors can’t build evolution equation, and the order parameter can’t be recognized. Therefore, at the beginning of modeling, the first question is how to select explanatory variables (state variables) into the model among various factors appropriately.
Correlating-analysis method is used in this paper to analyze the impact of various factors on the system, in order to determine which state variables should be included in the model. Firstly, target value of system should be built; secondly, making correlation analysis for the actual value of each factor and the actual value
o
f the target system; finally, looking for the main factors affecting the target value. The bigger the correlation is, the higher the impact degree of the factors on the system, the more likely they can reflect the evolution law of the system. The social benefit of energy saving and emission reduction of thermal power plant is set as the target value of system (Y), that is, Y = [(power supply coal consumption-the national standard value ) * coal price+ (SO2 emissions per unit power-the national standardvalue)*SO2 environmental value+(nitrogen oxide emissions
per unit power-the national standard value)*nitrogen oxides environmental value+(soot emissions per unit power-the national standard value)*soot environmental value]* electricity generation.
Substituting the actual value of affecting factors in energy saving and emission reduction and their total social benefits of power plant from 2011 to2013 into SPSS software for correlating-analysis, the correlation coefficient between each factor and the target value can be obtained, which is shown in the following table.
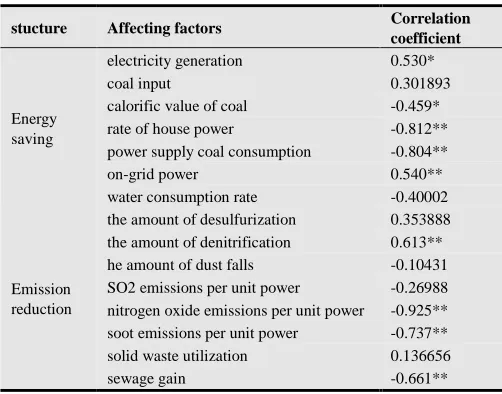
Table 1. The correlation coefficient between target factors and affecting factor.
stucture Affecting factors Correlation coefficient
Energy saving
electricity generation 0.530*
coal input 0.301893
calorific value of coal -0.459* rate of house power -0.812** power supply coal consumption -0.804**
on-grid power 0.540**
water consumption rate -0.40002
Emission reduction
the amount of desulfurization 0.353888 the amount of denitrification 0.613** he amount of dust falls -0.10431 SO2 emissions per unit power -0.26988 nitrogen oxide emissions per unit power -0.925** soot emissions per unit power -0.737** solid waste utilization 0.136656
sewage gain -0.661**
** indicates a correlation coefficient is significantly in the 0.1 level
The three factors who have the biggest correlation
)
(x
u
L x p rx
x ,
22, dx v d x dx dv
xr= p=
0
x
x
0r=
0
,
x
0p>
0
1 ) (x = uA
0 , 0 0 0r = x p<
x
1 ) (x = uB
0 , 0 0 0r= xp= x
1 ) (x = uC
p
r x
x , uL(x)=1
Lp
Lr x
x , L∈{A,B,C}
} ,
{x0r x0p {xLr,xLp}
)
)
(
2
1
)
(
0 0 0Q
x
x
Q
P
Q
x
x
Q
P
x
u
p Lp r Lr Lξ
ξ
ξ
ξ
+
−
+
+
+
−
+
×
=
) , min(xLr x0r xLp x0pP= − − Q=max(xLr−x0r,xLp−x0p)
ξ
)
(
),
(
),
(
x
0u
x
0u
x
0coefficient among the energy saving and emission reduction, they are taken as the state variables for energy saving and eimission performance of thermal power enterprise. They are the rate of house power, power supply coal consumption, on-grid power, nitrogen oxide emissions per unit power, soot emissions per unit power and sewage gain, and these six state variables to build co-evolution equations where the
state variables are denoted by .
5.2. Co-Evolution Equations and Order Parameter for Energy Saving and Emission Reduction in Thermal Power Plant
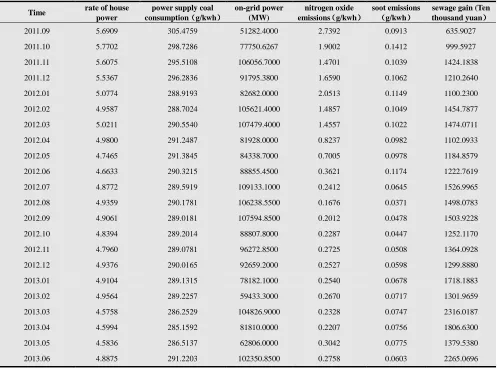
The actual data of state variables of energy saving and emission reduction in thermal power plant from September 2011 to June 2013 is shown in the following table:
Table 2. Actual data of state variables in energy saving and emission reduction system of thermal power plant.
Time rate of house power
power supply coal consumption((((g/kwh))))
on-grid power (MW)
nitrogen oxide emissions((((g/kwh))))
soot emissions (
( ( (g/kwh))))
sewage gain (Ten thousand yuan))))
2011.09 5.6909 305.4759 51282.4000 2.7392 0.0913 635.9027
2011.10 5.7702 298.7286 77750.6267 1.9002 0.1412 999.5927
2011.11 5.6075 295.5108 106056.7000 1.4701 0.1039 1424.1838
2011.12 5.5367 296.2836 91795.3800 1.6590 0.1062 1210.2640
2012.01 5.0774 288.9193 82682.0000 2.0513 0.1149 1100.2300
2012.02 4.9587 288.7024 105621.4000 1.4857 0.1049 1454.7877
2012.03 5.0211 290.5540 107479.4000 1.4557 0.1022 1474.0711
2012.04 4.9800 291.2487 81928.0000 0.8237 0.0982 1102.0933
2012.05 4.7465 291.3845 84338.7000 0.7005 0.0978 1184.8579
2012.06 4.6633 290.3215 88855.4500 0.3621 0.1174 1222.7619
2012.07 4.8772 289.5919 109133.1000 0.2412 0.0645 1526.9965
2012.08 4.9359 290.1781 106238.5500 0.1676 0.0371 1498.0783
2012.09 4.9061 289.0181 107594.8500 0.2012 0.0478 1503.9228
2012.10 4.8394 289.2014 88807.8000 0.2287 0.0447 1252.1170
2012.11 4.7960 289.0781 96272.8500 0.2725 0.0508 1364.0928
2012.12 4.9376 290.0165 92659.2000 0.2527 0.0598 1299.8880
2013.01 4.9104 289.1315 78182.1000 0.2540 0.0678 1718.1883
2013.02 4.9564 289.2257 59433.3000 0.2670 0.0717 1301.9659
2013.03 4.5758 286.2529 104826.9000 0.2328 0.0747 2316.0187
2013.04 4.5994 285.1592 81810.0000 0.2207 0.0756 1806.6300
2013.05 4.5836 286.5137 62806.0000 0.3042 0.0775 1379.5380
2013.06 4.8875 291.2203 102350.8500 0.2758 0.0603 2265.0696
Simulating the data through successive sweep method in Eviews software, the co-evolution mode for dynamic
performance evaluation on energy saving and emission reduction of thermal power plant could be obtained as follows:
(7) 1
,
2,
3,
4,
5,
6x x x x x x
2 2 2 2
1
1 2 3 4 5 3 4 5 6
2 2 2 2
2
1 2 4 5 6 1 3 4 6
3
3.594 1.441 -1.884 +1.261x 3.098 1.446 0.042 0.204 0.077 0.137
1.639 0.600 0.358x 0.441 3 1.471 0.520 1.025 0.029 0.020 0.0270 +0.063x
4.066 3.425
dx
x x x x x x x x
dt dx
x x x x x x x x
dt dx dt
= + − + − + − +
= + + + − − − − − +
= + 2 2 2 2
1 2 4 6 1 2 4 5
2 2 2 2 2
4
1 2 3 4 5 6 1 2 3 5 6
5
1 2 3
6.682 3.302 0.732 0.447 0.792 0.263 0.296
0.623 1.811 -1.59 -0.54 1.113 1.84 0.723 0.182 0.228 +0.022 0.114 -0.056
2.362 3.615 5.260 0.706
x x x x x x x x
dx
x x x x x x x x x x x
dt dx
x x x
dt
− − + − + + −
= + + − − − − +
= − − + − + 2 2 2 2
4 1 2 3 4
2 2 2 2 2
6
4 5 6 1 2 3 4 5
1.517 0.346 0.589 0.320 0.150
3.076 3.533 2 1.837 3.542 +1.526 0.115 0.514 0.037 +0.067 -0.299x
x x x x x
dx
x x x x x x x x
dt
+ − + −
= − − + − + −
The residual value of each state variable evolution
equations is , the fluctuations in energy saving
and emission reduction is periodic function, that is .
Simulating the equation with Eviews software, when k>6, the goodness of fit did not change, so residual value just contains the section of k<6 as follows:
(8)
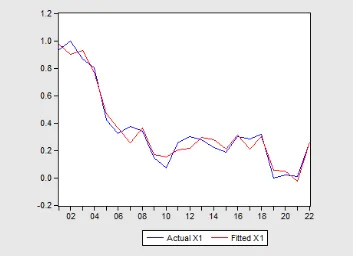
The equations of (7) and (8) constitute the co-evolution equations of energy saving and emission reduction. The comparisons of fitted value and actual value of state variable are shown as follows:
Fig 1. rate of house power comparison.
Fig 2. power supply coal consumptioncomparison.
Fig 3. on-grid powercomparison.
Fig 4. nitrogen oxide emissions per unit power comparison.
Fig 5. soot emissions per unit power comparison.
Fig 6. sewage gain comparison.
As shown in Figure 1-6, the overall model fit better.
( ) i
f t f ti( )
( ) 1sin sin 1cos cos
i
f t =ai t+ +⋯ aik kt+
β
i t+ +⋯β
ik kt1
2
( )= 0.013sin 0.003cos 0.001sin 2 0.023cos 2 0.012sin3 0.014cos3 0.002sin 4 0.029cos 4 0.014sin5 0.055cos5
( )= 0.007sin 0.003cos 0.020sin 2 0.004cos 2 0.010sin3 0.019cos3 0.008sin 4 0.01
f t t t t t t t t t t t
f t t t t t t t t
− + + − + + − − − −
− − + + − + − −
3
4
3cos 4 0.010sin5 0.018cos5
( )= 0.044sin 0.106cos 0.065sin 2 0.087cos 2 0.041sin3 0.009cos3 0.007sin 4 0.020cos 4 0.011sin5 0.010cos5
( )= 0.014sin 0.030cos 0.006sin 2 0.016cos 2 0.007sin3
t t t
f t t t t t t t t t t t
f t t t t t
− −
− + + + + − − + + −
− + + − +
5
6
0.016cos3 0.019sin 4 0.008cos 4 0.011sin5 0.026cos5
( )=0.016sin 0.042cos 0.029sin 2 0.022cos 2 0.000sin3 0.036cos3 0.040sin 4 0.008cos 4 0.026sin5 0.003cos5
( )= 0.037sin 0.015cos 0.06
t t t t t t
f t t t t t t t t t t t
f t t t
− + − − +
− + + + + + − − +
Among the six evolution equations of state variables, the highest goodness of fit R2 = 0.983, the lowest R2 = 0.73. Meanwhile, as we can see from the results of evolutionary model, the damping coefficients of the six state variables reflecting the energy saving performance of thermal power
enterprises are:
.
Minimum damping coefficients are the variables and
, namely, on-grid power and soot emissions, both coefficients are zero. Its practical significance shows that: almost no attenuation of these two variables would occur in the evolution process, at the critical point of the evolution the system will show critical undamped phenomenon, this is the order parameter in the study period of thermal power enterprise energy saving system evolution.
5.3. Potential Function of Order Parameter of Energy Saving and Emission Reduction in Thermal Power Plant
Let the integrated order parameter be ,
would be obtained through relevant weighting method.
Taylor series expansion method is used to construct a comprehensive co-evolution equation of order parameter, the fitting results (9) are as follows:
(9)
From (4), the potential energy saving function of energy saving and emission reduction system of thermal power plant is:
(10)
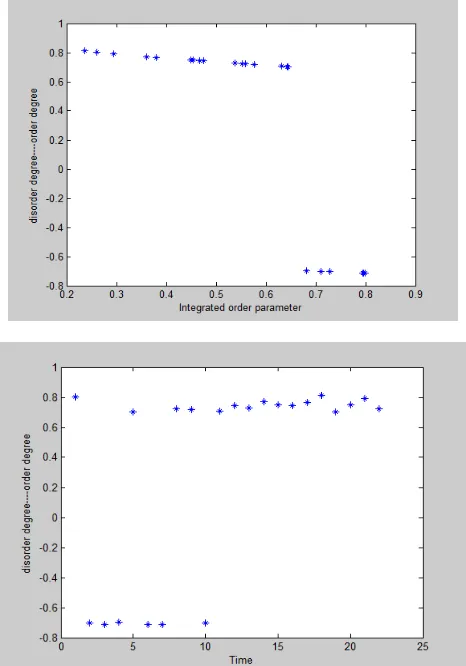
Evolutionary image of potential function is shown in Figure 7:
Fig 7. Potential energy saving function of energy saving and emission reduction.
It can be seen that in the study period, the performance of energy saving system may appear high efficiency and low efficiency two states, and there is no critical state, that is the
state of the energy saving system performance in thermal power plant is not mutated.
5.4. Performance State Evaluation of Energy Saving and Emission Reduction in Thermal Power Plant
When evaluated in accordance with the above rules, when the plant state in energy saving and emission reduction is
highly efficient , ; When
the plant is in low efficiency state ,
.
After performance state evaluation of the thermal power plant from September 2011 to June 2013 in energy saving and emission reduction, the overall situation is shown in Figure 8. Wherethe positive Y-axis represents a high state of efficiency, the negative Y-axis represents low efficiency state, the absolute value represents the degree of membership.
Fig 8. Performance evaluation result of energy saving and emission reduction.
During the 22 months from September 2011 to June 2013, the energy saving and emission reduction performance of the thermal power plant is ideal. Before June 2012, there exists inefficient state, after June 2012, the energy saving performance of the thermal power plants is highly efficient state. From data observation, it is obvious that before June 2012, the soot emissions per unit power of the thermal power plant is compared high, with low efficiency of the
1 1.141, 2 0.358, 3 0, 4 1.113, 5 0, 6 1.526
a = a = a = a = a = a =
3
x
5
x
5 2 4
1x x
r=
ω
+ω
5 . 0
2 1=ω =
ω
3
0.803 2.041* 1.546 *
dr
r r
dt = − +
2 4
0.803*
1.021*
0.387 *
V
= −
r
+
r
−
r
1
)
(
x
=
u
A (xAr,xAp)=(0,1.2005)1
)
(
x
=
u
B1 1
energy saving and emission reduction performance. In April and September of 2012, the company has improved its lectorstatic precipitator control system of Units 1 and 2. According to North EPRI testing result, energy consumption has decreased by 50%. Meanwhile, the soot emission indicator also met the new standards. The power plant has canceled unit 1 desulfurization bypass damper in April 2012 and realizeda 100% operation rate of desulfurization unit 1, the integrated desulfurization efficiency has reached more than 90%. In March 2012, denitration system technical innovation work has been completed and operated for unit 2. While the same improvement work for unit 1 was completed in May 2012.The denitrification running rates of these two units have reached 99.62% and 98.27%, while the comprehensive denitrification efficiency has reached above 70%, which met the government requirements in Duty agreement. These series of energy saving technological transformation work have reduced the power consumption rate of the power plant, power supply coal consumption and the emissions of various pollutants, while improving the energy saving efficiency of the entire plant After June 2012, the energy saving performance has reached a steady state of high efficiency.
6. Conclusions
Through the complex features study of energy saving and emission reduction of thermal power plant, using self-organization synergetic theory to study the performance of energy saving and emission reduction of thermal power plant. Based on correlation analysis the state variables characterizing the evolution of energy saving and emission reduction was determined. Then, a co-evolution model for thermal power enterprises energy saving and emission reduction based on the synergetic theory was proposed, which revealed the dynamic relationship among state variables and identified the order parameters who dominant system evolution. Meanwhile, taking advantage of mutation theory, the potential function of energy saving and emission reduction was established according to the changes of order parameters, while the performance can be evaluated through the characteristic of the potential function. Finally, an empirical analysis has been done for performance of energy saving and emission reduction in a thermal power plant. The results show that the order parameters of this thermal power plant are on-grid power and soot emissions per unit power, these two variables are the decisive factors in the plant energy saving and emission reduction performance. Meanwhile, in the study period, the system has shown two states of high efficiency and low efficiency. The running state is always of high efficiency after June 2012 and the whole performance is ideal, which indicates that technology projects in the power plant has significant effect.
Acknowledgments
This study is supported by the National Natural Science Foundation of China (Grant no. 71373076) and the Humanities and Social Science project of the Ministry of
Education of China (Project no.11YJA790217).The authors are grateful to the editor and anonymous reviewers for their suggestions on improving the quality of the paper.
References
[1] R. Rajeev, C. Brian, ”Modeling complex systems macroscopically: Case agent based modeling, synergetics, and the continuity equation,” Complexity, vol.18, no.2, pp.8-17.2012.
[2] A. Liening, G. Strunk, E. Mittelstadt,” Management Learning in Times of Crisis: An Experimental Study based on Synergetics,” Nolinear dynamics psychology and life sciences, vol.17, no.4, pp.517-541.2013.
[3] Z.-K. Song,” A Study on Integrated Mechanism of Metallurgy Enter Prise Technology Innovation Based on Synergetic Theory,” Tian Jin University. 2006.
[4] S.-Y. Li, et al,” Nonlinear Science and Complexity Science,”Harbin Institute of Technology Press, pp.44-53.2006. [5] Harken, Z.-A. Guo, “Higher Synergetics,” Beijing Science
Press.1989.
[6] Q.-H. Zeng, et al (Translation),” From chaos to order,” Shanghai Translation Publishing House. 1987.
[7] Y. Yao,” Technique evolutionary mechanisms and organizational order parameter,” Dialectics of Nature, vol.23, no.4, pp. 47-49.
[8] Q. Feng,” Enterprise research on sustainable development capacity applied with synergetic theory,” Proceedings of International Conference on Enterprise Engineering and Management Innovation, pp.142-146.2007.
[9] S.-F. Liu, Y.-G. Dang, Z.-G. Fang,” System theory and application,” Beijing: Science Press,no.5, pp.146-147.2010. [10] J.-Q. Sun, D.-X. Niu, L. Yuan, C.-J. Li,” Empirical Study of
the Complex Characteristics of the Electricity Market and its Evolution,” Economic and Management Research, no.11,pp.3-8.2012.
[11] X.B. Hong, H. Wang, T. Wang,” Dynamic cooperative identification based on synergetics for pipe structural health monitoring with piezoceramic transducers,” smart materials and structures, vol,22, no.4. 2013.
[12] J.-Q. Sun, L. Yuan, C.-J. Li,” Recognition of the electricity market operator status based on complex systems theory,” Management Science, vol.6,no.25, pp.111-118.2012. [13] F.-L. Feng, L.-W. Yang, L. Dan,” Order parameter model for
synergetic theory based railway freight system and evolution in China. Promet-traffic & transportation, vol,25, no,3, pp.195-207.2013.
[14] P. Wang, K.-Y. Zhang,” The synergetic theory of enterprise management in the dynamic and complicated environment,” Integration and innovation through measurement and management. pp. 2327-2334. 2006.
[16] L.-J. Liu, L.-M. Wang,” Establishing System Dynamic Model for Energy Saving and Emission Reduction in Electric Power Enterprise,” East China Electric Power, vol.38,no.10, pp.1498-1500,2010.