http://www.sciencepublishinggroup.com/j/ccr doi: 10.11648/j.ccr.20170102.13
Shape Optimization of a NURBS Modelled Coronary Stent
Using Kriging and Genetic Algorithm
Anierudh Vishwanathan
Mechanical Engineering Department, Birla Institute of Technology and Science, Pilani, Rajasthan, India
Email address:
To cite this article:
Anierudh Vishwanathan. Shape Optimization of a NURBS Modelled Coronary Stent Using Kriging and Genetic Algorithm. Cardiology and Cardiovascular Research. Vol. 1, No. 2, 2017, pp. 39-47. doi: 10.11648/j.ccr.20170102.13
Received: January 23, 2017; Accepted: February 9, 2017; Published: April 17, 2017
Abstract:
In this paper, structural shape of stent has been optimized using NURBS for parameterization of stent structure and target those objectives which are critical for vascular injury. NURBS modeling is done using python coding in RHINO 3D software. For later part of the design, Solidworks is used. The objectives considered in our study are dogboning, foreshortening and arterial wall stresses, all of which are strongly linked to vascular injury leading to restenosis. We use control point weights, strut thickness and strut width as design variables for Latin Hypercube sampling (LHS) in order to generate dataset for Stent deployment simulations. In our study, we generate 80 design data points using LHS in Matlab R2014a. Finite element analysis of stent deployment process is then carried out using ANSYS for all 80 designs of stent generated using LHS. Thereafter, we use Kriging for surrogate modeling and non-dominated sorting genetic algorithm (NSGA-II) in MATLAB for multi-objective design optimization so as to minimize dogboning, foreshortening and arterial wall stresses. As a result, we obtain a range of pareto optimal design parameter values which can be used in clinical design guides so as to accommodate variations observed across different patients.Keywords:
Stent, Kriging, Foreshortening, Recoil Ratio, Maximum Stress, Optimization1. Introduction
Atherosclerosis is the buildup of cholesterol and fatty deposits (called plaque) on the inner walls of the arteries that restrict blood flow to the heart. Without adequate blood, the heart becomes starved of oxygen and the vital nutrients it needs to work properly, which, in turn, causes chest pain called angina. Angioplasty with stenting is most commonly recommended for patients who have a blockage in one or two coronary arteries. A stent is a small, metal mesh tube that acts as a scaffold to provide support inside the coronary artery. A balloon catheter, placed over a guide wire, is used to insert the stent into the blocked artery. Once in place, the balloon is inflated and the stent expands to the size of the artery and holds it open. The balloon is deflated and removed, and the stent stays in place permanently. Restenosis is a gradual re-narrowing of the stented segment that occurs mostly between 3 to 12 months after stent placement. Although, use of stents has decreased the chances of restenosis, when compared with balloon angioplasty alone, but it still continues to be a significant figure of 25% (Foin
et. al., 2014). Since, there are millions of stent deployment procedures being carried out worldwide, even rates of complications in low single digit percentages of the total represents a large cohort of patients. In this context, there is clearly room for improvement in the precision of stent delivery and optimization. Vascular injury caused due to depth of penetration of the stent wires or by an aggressiveness score, has consistently been found to determine the degree of restenosis and hence, restenosis is strongly linked to stent design (Schwartz et. al., 1994).
NURBS modeling is done using python coding in RHINO 3D software. For later part of the design, Solidworks is used. The objectives considered in our study are dogboning, foreshortening and arterial wall stresses, all of which are strongly linked to vascular injury leading to restenosis. Further, in our design, we exploit the longitudinal and circumferential symmetry of stent by using a single repetitive segment in analysis and optimization to represent the overall stent. We use control point weights, strut thickness and strut width as design variables for Latin Hypercube sampling (LHS) in order to generate dataset for Stent deployment simulations. Latin Hypercube designs have become very popular among strategies for computer experiments. It allows the creation of experimental designs with as many points as desired along with the space filling properties. In our study, we generate 80 design data points using LHS in Matlab R2014a. Finite element analysis of stent deployment process is then carried out using ANSYS for all 80 designs of stent generated using LHS. Thereafter, we use Kriging for surrogate modeling and non-dominated sorting genetic algorithm (NSGA-II) in MATLAB for multi-objective design optimization so as to minimize dogboning, foreshortening and arterial wall stresses. As a result, we obtain a range of pareto optimal design parameter values which can be used in clinical design guides so as to accommodate variations observed across different patients. Results of the study show the merits of the NURBS based parameterization approach, which models a broader range of shapes then was previously possible with traditional approaches.
2. Geometric Modelling of Stent
This section describes the various aspects of a NURBS curve, its subsequent application to Stent modeling and the generation of three-dimensional design in this paper.
Non-Uniform Rational Basis Spline(NURBS) are popular industry standard tools that are used for the design and representation of geometry (Rogers David and Earnshaw, 1991). The properties of NURBS functions are same as that of integral B-splines, but with capability of representing a wider class of geometries.
NURBS curves can be controlled by changing the following parameters: -
1.Degree of the spline which is a positive whole number. 2.The control points which determine the shape of the
curve. Changing the control points is the easiest method to change the shape of the overall curve.
3.Control points have weights associated with them. The relative weight of the control point defines the “attraction” of the curve towards that control point. The relative value of weights of the control points can be used to change the shape of the curve even when the control point position cannot be changed.
4.Knots
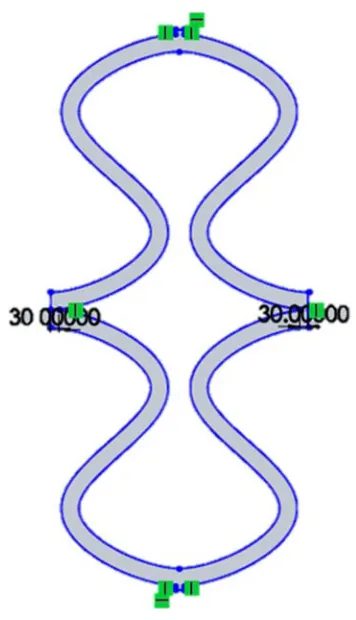
The overall stent structure can be generated by repeating a single element in the longitudinal and circumferential directions, as shown in fig 1. The stent used in the study has
an axial length of 8mm, inner radius of 0.75mm. There are 20 repeated segments which, when combined with a mid-plane radius of 1.458 mm, gives the mid-plane circumferential length of 0.458 mm. The model generation consists of the following steps:
1. The centreline of fundamental stent segment is modelled using a NURBS curve of degree 7 and using 8 control points.
2. The weights of the control points are assigned. Considering the anti-symmetry of the fundamental stent segment, weights of control points 0-3 are same as that of 7-4, in order.
3. The centreline is then offset both side by a distance which has been generated by Latin Hypercube Sampling as explained in further sections.
Figure 1. 2D Sketch of a Section of Stent.
This 2-D stent, Figure 1. Has been imported in Solidworks in the IGES format. Each repeating sketch was wrapped around surface extruded of cylinder of the required diameter which was 1.5mm for performing the analysis. The wrapped sketch was used to develop a surface which would be a 2-D surface representation of the stent model. Thicken feature was used to develop a 3-D model of the stent to obtain the required extrusion length in accordance to each data point generated by LHS technique as shown in Figure 2. It was then converted into parasolid text file for the analysis. The following table and Figure 3. give the values of the design parameters and the corresponding 3-Dimensional designs of the same:
Table 1. Design Parameters for the First 10 Designs in the Design Space of Research.
W1 W2 W3 2-D Thickness Extrusion Length
A 3.97 2.59 3.34 0.0302875 0.10725
B 1.34 4.16 3.09 0.0601875 0.09225
C 4.03 4.47 0.59 0.0429375 0.09325
D 0.84 3.28 2.47 0.0624875 0.10525
E 0.34 2.03 2.66 0.0515625 0.07125
F 2.22 1.84 4.66 0.0469625 0.10625
G 1.78 3.91 4.16 0.0314375 0.08675
H 4.78 1.03 4.47 0.0360375 0.07175
I 4.91 0.41 3.03 0.0320125 0.09825
J 1.72 1.47 2.03 0.0561625 0.07475
Figure 3. Ten Three Dimensional Models of Symmetric and Repeating Unit of the Coronaty Stent.
An elasto-plastic material model along with bilinear isotropic strain hardening has been used to model the stent to study the large deformations during the analysis. Two Parameter Mooney Revlin model has been used to model the balloon to be inflated. The values of the parameters corresponding to the material of the stent and the balloon have been given in the following table.
Table 2. Mesh Parameters in ANSYS.
SNo. Name of Parameter Element Size/Value
1 Stent Body Sizing 0.04mm
2 Catheter Body Sizing 0.05mm
3 Mapped Face Meshing Diaphragm-Balloon Interface
4 3-D Element Type Solid 187/Solid 186
Table 3. Material Properties of the Stent-Balloon Assembly.
SNo Name of Property Value Comments
1 Yield Strength 1.96E+08Pa Stent
2 Tangent Modulus 6.92E+08Pa Stent
3 C10 1.06MPa Balloon
4 C01 0.114MPa Balloon
3. Structural Analysis of Balloon Stent
Model
ANSYS 14.0 has been used for performing the static finite element analysis the stent-catheter assembly for calculation of the values of foreshortening, recoil ratio and maximum von-misses stress.
The problem addressed in this paper involves bodies of dimensions in the order of microns; hence meshing of the stent-catheter assembly plays an important role to ensure high accuracy of the calculated parameters from the analysis. Table 2. Gives the meshing settings for the analysis performed.
Figure 4. Meshed Model of Stent-Balloon Assembly.
Due to computational restrictions, the entire stent-catheter assembly has been divided into repeating and cylindrically axis-symmetric units. Frictionless supports have been applied on the side faces and top face of the stent to indicate that an identical unit will repeat at the face where supports have been applied. Since a reduced symmetric portion of the entire stent has been considered for the analysis, translational displacements have been fixed on the right side and longitudinal translational displacements have been fixed on the top nodes in order to prevent rigid rotation along the longitudinal axis of the stent. This model assumes that the balloon does not experience any tangential or longitudinal displacement thereby expanding only in the radial direction.
a radial displacement of 0.3mm that is, the final diameter of the stent mesh will be 0.6mm more than its actual diameter. Hence, the stent will push the plaque thereby opening up the artery for blood flow. The balloon will expand for the first half of the cycle and for the second half of the cycle, it will relax to its original diameter.
Surface to surface contact elements have been implemented in ANSYS where the elements are not allowed to penetrate into the target surface but target elements are allowed to penetrate. Frictionless contact has been modelled with the internal surfaces of stent being the contact while the external surface being the target. Penalty method has been used as a contact algorithm to determine a relationship between the contact surfaces using springs. Spring/Contact stiffness have been carefully determined to ensure that the penetration and slip are under safe limits.
Table 4. Analysis Settings.
SNo. Name of Parameter Value
1 Contact Stent
2 Target Balloon
3 Contact Type Frictionless
4 Scope Manual
5 Behaviour Asymmetric
6 Formulation Augmented Lagrange
7 Detection Nodal-Projected Normal from
Contact
8 Interference Treatment Adjust to Touch
9 Normal Stiffness Factor 0.004
10 Number of Steps 2
11 Initial Number of Substeps 200
12 Minimum Substeps 20
13 Maximum Number of Substeps 1E+05
14 Solver Type Iterative
15 Large Deflection On
Figure 5. Boundary Supports of Stent-Balloon Assembly.
Figure 7. Stress at Maximum Inflation.
Figure 6-7 shows the simulation corresponding to one data point where the values of stress corresponding to the completion of cycle and the situation of maximum inflation has been depicted. Figure 8-10 depict the values of Radial Displacement, Maximum Stress and Change in length of the stent at the end of the entire inflation-deflation cycle accompanied with a graph showing the variation of the same through the entire cycle. It can be observed that the maximum stress acts at the curved regions of the stent and at
the faces corresponding to the symmetric lateral ends of the stent as the expansion of the balloon causes maximum strains at these locations. maximum diameter is attained at the end of the inflation cycle and it holds till the pressure on the balloon begins to decrease which is attributed to the elastic rebounding of the stent material. Large inelastic deformations induce residual stresses in the stent after the completion of cycle. It may also be possible that these residual stresses enable the stent to hold to its shape.
Figure 8. a) Radial Deformation of Stent at the End of Cycle b) Curve Depicting Change of Radial Deformation Over the Entire Cycle.
Figure 10. a) Longitudinal Deformation of Stent at the End of Cycle b) Curve Depicting Change of Longitudinal Deformation Over the Entire Cycle.
4. Selection of Design Parameters
Two sets of variables have been selected, the first set comprises of the control variables which define the design space and are determined by the manufacturers. The second set comprises of the uncertain variables which change in an uncertain manner but have a significant impact on the performance of the stent (Tammareddi et. al., 2016).
Three control weights, two-dimensional thickness and extrusion length have been selected as the design parameters which have been optimized in this research paper. According to the existing literature, the deployed stent is expected to have minimum recoil ratio, minimum value of maximum stress and a limited foreshortening which forms the base of the optimization model of this research paper (Li et. al., 2009). This implies that the deployed stent is desired to be stiff during recoil and compression while it is expected to be soft during the expansion process, lowest stresses and strains must be experienced by the stent during implantation and the stent should also withstand uniform radial pressure and retain its original shape (Clune et. al. 2014)
1.Recoil Ratio: - This refers to the ratio of the decrease in the diameter of the stent section when the balloon is fully inflated to the state when the balloon is deflated and diameter of the stent when the balloon is inflated to the maximum pressure.
2.Maximum Stress: - This is the maximum value of von-misses stress that any part of the stent experiences in an entire cycle. This parameter has been selected
3.Foreshortening: -This refers to the percentage by which the length of the stent decreases after completion of the inflation-deflation cycle in comparison to its original length.
Foreshortening= 0 0
*100%
unload
L L
L −
5. Sample Generation
In our study, we use the Latin hypercube designs, which is one of the most popular space filling designs for deterministic computer simulation models. Latin Hypercube Sampling (LHS) is a stratified random procedure for efficient sampling of variables from their multivariate distributions. It was initially developed for efficiently selecting input variables for computer models for the purpose of Monte-Carlo simulations (McKay et. al., 2000; Iman and Conover, 1980). It is efficient when used for structural analysis for estimating standard deviations and mean values. (Olsson et al., 2003). Latin Hypercube designs have become very popular among strategies for computer experiments. One advantage it offers is the creation of experimental designs with as many points as desired along with the space filling properties. It has been used by several researchers for sampling of design data points for stent simulations. Eighty data sets were extracted in the four-dimensional workspace using the technique of Latin Hypercube Sampling in MATLAB. Table 5. Gives the selected range of values for generation of the design space and Table 6 gives the values of the output parameters which have been calculated after performing finite element analysis using ANSYS.
Table 5. Selected Range of Values to Develop the Design Space for the Analysis.
SNo Name of Property Maximum Value Minimum Value
1 W1 4.968756 0.032244
2 W2 4.968756 0.032244
3 W3 4.968756 0.032244
4 Strut Width 0.0757125 0.0302875
5 Strut Thickness 0.10975 0.07025
Table 6. Analysis Table for the Entire Set of Latin Hypercube Sampling Generated Points.
W1 W2 W3 2D Thickness (mm) Extrusion Length (mm) Recoil Ratio Maximum Stress (MPa) Foreshortening
3.97 2.59 3.34 0.0302875 0.10725 0.169021088 351.03 0.040227984
1.34 4.16 3.09 0.0601875 0.09225 0.066610019 266.59 0.147298148
4.03 4.47 0.59 0.0429375 0.09325 0.106622241 279.61 0.066031458
0.84 3.28 2.47 0.0624875 0.10525 0.060008137 265.25 0.160624504
0.34 2.03 2.66 0.0515625 0.07125 0.065361275 350.19 0.208482854
2.22 1.84 4.66 0.0469625 0.10625 0.096794574 349.1 0.109387588
1.78 3.91 4.16 0.0314375 0.08675 0.143119198 349.85 0.120984887
W1 W2 W3 2D Thickness (mm) Extrusion Length (mm) Recoil Ratio Maximum Stress (MPa) Foreshortening
4.91 0.41 3.03 0.0320125 0.09825 0.143152264 355.04 0.024938669
1.72 1.47 2.03 0.0561625 0.07475 0.072929995 332.21 0.10494736
0.41 2.72 4.72 0.0452375 0.07425 0.069644458 345.22 0.206503377
3.16 4.53 2.34 0.0676625 0.09375 0.0678 267.95 0.08122594
4.41 3.66 1.22 0.0705375 0.07875 0.071027222 282.93 0.06307003
4.47 1.28 2.09 0.0739875 0.08175 0.068480643 258.18 0.056109213
0.22 1.34 3.66 0.0544375 0.08625 0.055007423 334.22 0.223713602
2.34 4.66 2.91 0.0400625 0.08575 0.113560491 353.72 0.106704837
3.09 4.91 3.53 0.0406375 0.08475 0.121940013 353.71 0.096991907
3.28 2.97 4.78 0.0521375 0.09475 0.087273531 275.61 0.088268269
3.34 1.16 4.97 0.0665125 0.07525 0.067403722 322.98 0.073461053
3.84 0.59 2.53 0.0463875 0.07575 0.103172414 254.67 0.052651094
3.66 4.72 4.84 0.0527125 0.07275 0.087732178 362.63 0.076848052
1.84 2.84 0.66 0.0584625 0.08075 0.074978939 276.52 0.101391134
2.91 4.22 0.22 0.0688125 0.10075 0.067439161 280.24 0.087980913
0.91 0.53 1.34 0.0371875 0.07825 0.10333253 346.27 0.125975566
0.16 2.47 3.28 0.0596125 0.09725 0.053551223 336.45 0.202902617
4.84 1.09 2.41 0.0532875 0.09575 0.09155743 278.03 0.043541658
1.28 3.97 4.34 0.0458125 0.10325 0.092013536 342.38 0.15101115
2.59 0.28 2.78 0.0699625 0.10375 0.064289543 264.39 0.077996096
4.97 2.53 1.84 0.0481125 0.07975 0.102158694 284.92 0.053458624
1.09 2.22 2.97 0.0394875 0.08025 0.105737431 343.81 0.154746602
0.53 4.09 3.91 0.0578875 0.08825 0.061882475 341.4 0.181659299
1.47 3.78 0.41 0.0567375 0.08125 0.075229593 285.69 0.125503938
4.72 0.72 3.59 0.0412125 0.10475 0.113540651 291.62 0.051993041
1.91 1.22 0.84 0.0636375 0.10275 0.070307885 263.32 0.092392713
0.72 0.34 2.84 0.0757125 0.09175 0.044720707 274.94 0.174030689
0.28 3.09 1.53 0.0751375 0.07925 0.046521875 281.21 0.184895328
2.84 2.91 1.28 0.0348875 0.09625 0.14668412 357.14 0.074500081
2.03 0.91 3.47 0.0435125 0.07725 0.09743895 276.22 0.100676614
1.53 0.84 0.34 0.0325875 0.08875 0.148417316 349.26 0.072308972
2.28 2.34 1.16 0.0555875 0.08525 0.082119644 331.09 0.07436512
0.97 4.78 0.97 0.0343125 0.08975 0.126897748 360.58 0.158866148
3.91 2.16 0.72 0.0423625 0.10975 0.116594638 289.39 0.06265945
0.09 0.09 1.47 0.0693875 0.10025 0.034417262 314.2 0.247983103
2.53 0.03 3.97 0.0504125 0.10925 0.086696338 352.53 0.077432777
4.28 4.34 2.28 0.0475375 0.07775 0.10050858 282.25 0.070133622
1.59 2.41 1.66 0.0389125 0.08925 0.11815925 346.31 0.117910652
2.97 2.28 0.91 0.0509875 0.07225 0.083029335 272.63 0.071324388
1.66 3.16 4.91 0.0728375 0.09975 0.056249654 291.19 0.137458873
0.78 1.72 1.78 0.0331625 0.09425 0.123906706 366.66 0.151100007
1.97 1.97 3.84 0.0486875 0.10575 0.090570236 342.91 0.10747297
2.78 2.78 3.22 0.0670875 0.10875 0.066883726 262.97 0.089787747
1.41 4.28 1.09 0.0308625 0.10775 0.149091715 348.63 0.119733284
3.72 1.53 4.28 0.0590375 0.08725 0.07994039 327.17 0.068689753
4.09 3.22 4.22 0.0745625 0.07025 0.063880805 269.62 0.081847115
4.59 4.97 1.97 0.0417875 0.09025 0.115028881 274.82 0.338896959
3.03 0.66 4.03 0.0377625 0.07625 0.129907063 354.57 0.070519085
0.66 3.03 4.53 0.0607625 0.07675 0.057885158 270.14 0.179518199
3.59 1.78 2.22 0.0734125 0.08225 0.064943853 263.86 0.073343668
1.16 1.66 1.91 0.0573125 0.07325 0.067880702 279.31 0.131405765
4.22 0.47 3.16 0.0711125 0.09925 0.067228279 284 0.053750056
3.41 3.84 4.09 0.0354625 0.09875 0.14253598 353.17 0.078491226
2.66 4.84 3.78 0.0630625 0.09075 0.069183427 266.96 0.107596495
1.22 0.97 1.59 0.0440875 0.08275 0.091848135 348.32 0.122942139
0.59 3.53 3.72 0.0446625 0.10425 0.085332986 340.07 0.174819827
1.03 0.78 4.41 0.0366125 0.09275 0.10798572 335.61 0.139702186
4.16 4.41 2.72 0.0642125 0.10825 0.07529725 253.68 0.079548246
4.53 3.59 2.59 0.0538625 0.10675 0.090280319 278.63 0.068170673
3.53 1.91 1.41 0.0619125 0.08325 0.076326774 287.26 0.062684772
3.78 3.47 0.28 0.0653625 0.09125 0.076270106 257.38 0.068636358
2.09 2.66 0.47 0.0337375 0.08375 0.147250355 359.18 0.08779221
2.72 3.72 0.53 0.0716875 0.09525 0.065437956 272.41 0.095144589
4.34 1.41 1.72 0.0492625 0.10175 0.099164468 274.91 0.053594201
2.16 0.22 0.03 0.0613375 0.09775 0.082153598 253.28 0.052784978
4.66 3.34 4.59 0.0647875 0.07375 0.074632057 268.48 0.067451741
W1 W2 W3 2D Thickness (mm) Extrusion Length (mm) Recoil Ratio Maximum Stress (MPa) Foreshortening
2.41 1.59 0.16 0.0383375 0.07075 0.124408669 299.77 0.069439797
3.22 2.09 0.09 0.0498375 0.08775 0.098225868 276.22 0.062520294
0.47 3.41 1.03 0.0550125 0.09675 0.067341003 274.69 0.171835664
3.47 0.16 2.16 0.0722625 0.10125 0.066572055 267.27 0.059258678
2.47 4.59 0.78 0.0682375 0.08425 0.067026377 272.32 0.101926201
6. Kriging and Design Optimization
A surrogate modelling approach based on Kriging has been used to approximate the underlying true objective functions which determine the behaviour of the stent. True objective values for optimization have been replaced with kriging response surfaces which prove to be computationally inexpensive (Pant et. al., 2011). The Kriging response surfaces were fit to each set of design points. the fitted response surfaces were checked for minimum values of mean squared resubstitution errors which was chosen as a parameter to determine their relevance for optimization. We encounter a multi-objective optimization problem which will enable the designer to select the best geometry of the stent under the defined However the solving the optimization problem requires nonlinear programming. The multiobjective problem has been solved using MATLAB implementation of NSGA-II algorithm. The Multi-Objective Genetic Algorithm model attempts to create a set of Pareto optima for a multi objective minimization. A solution can be considered Pareto optimal if there is no other solution that performs at least as well on every criterion and strictly better on at least one
criteria. In genetic algorithms, a chromosome is a set of parameters which define a proposed solution to the problem it is trying to solve (Konak et. al., 2006). The genetic operators such as cross-over, mutation and selection make use of the fitness evaluation of the chromosomes. Selection operators are more likely to choose the fit parents for cross-over, while mutation is inclined towards the least fit individuals.
A population size of 100 was evolved over 1000 generations through binary tour selection after which the 100 designs of the NSGA-II population converged to the set of optimum set of data points solving the trade-off between the output parameters.
7. Results and Discussion
Table 7. gives the pareto set of design parameters which represents the best set of design parameters which would give the minimum stress, recoil ratio and foreshortening. There would be no solution which would perform at least same on two of the three output parameters and better for the third parameter.
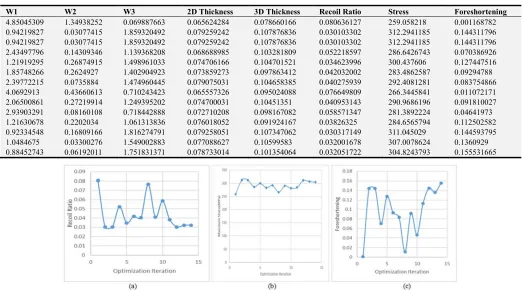
Table 7. Set of Optimized Design Parameters of the Coronary Stent.
W1 W2 W3 2D Thickness 3D Thickness Recoil Ratio Stress Foreshortening
4.85045309 1.34938252 0.069887663 0.065624284 0.078660166 0.080636127 259.058218 0.001168782
0.94219827 0.03077415 1.859320492 0.079259242 0.107876836 0.030103302 312.2941185 0.144311796
0.94219827 0.03077415 1.859320492 0.079259242 0.107876836 0.030103302 312.2941185 0.144311796
2.43497796 0.14309346 1.139368208 0.068688985 0.103281809 0.052218597 286.6426743 0.070386926
1.21919295 0.26874915 1.498961033 0.074706166 0.104701521 0.034623996 300.437606 0.127447516
1.85748266 0.2624927 1.402904923 0.073859273 0.097863412 0.042032002 283.4862587 0.09294788
2.39772215 0.0735884 1.474960445 0.079075031 0.104658385 0.040275939 292.4081281 0.083754866
4.0692913 0.43660613 0.710243423 0.065557326 0.095024088 0.076649809 266.3445841 0.011072171
2.06500861 0.27219914 1.249395202 0.074700031 0.10451351 0.040953143 290.9686196 0.091810027
2.93903291 0.08160108 0.718442888 0.072710208 0.098167082 0.058571347 281.3892224 0.04641973
1.21630678 0.2202034 1.061313836 0.076018052 0.091924167 0.03826325 284.6565794 0.112502582
0.92334548 0.16809166 1.816274791 0.079258051 0.107347062 0.030317149 311.045029 0.144593795
1.0484675 0.03300276 1.549002883 0.077088627 0.10599583 0.032001678 307.0078624 0.1360929
0.88452743 0.06192011 1.751831371 0.078733014 0.101354064 0.032051722 304.8243793 0.155531665
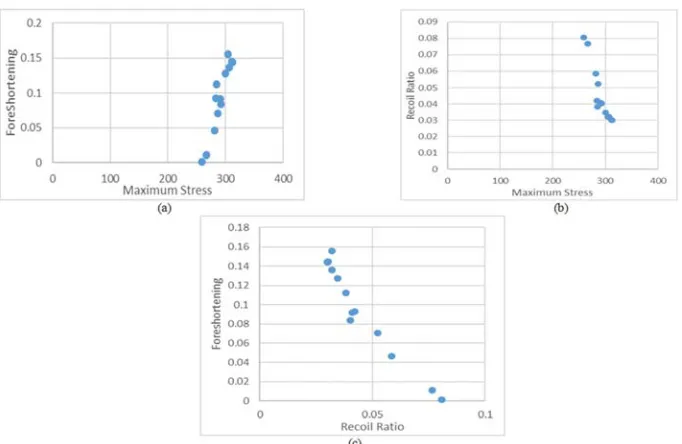
Figure 12. (a) Relation Between Foreshortening and Maximum Stress (b) Relation Between Recoil Ratio and Maximum Stress (c) Relation Between Foreshortening and Recoil Ratio.
Table 8. Correlation Between Output Parameters.
Maximum Stress Foreshortening Recoil Ratio
Maximum Stress NA +ve -ve
Foreshortening +ve NA -ve
Recoil Ratio -ve -ve NA
It can be seen from Figure 11. (a), (b) and (c) that the recoil ratio is between 3% to 8%, maximum value of stress varies between 259MPa and 312MPa and the foreshortening values fall between 0.1% and 15%. We can observe from Figure 12. (a), (b) and (c) that when recoil ratio and maximum stress reach the minimum value for one set of observation, the foreshortening value reaches its maximum for the same data point clearly highlighting the need for assigning priorities/weights for each output parameter. The designer can select the desired set of values of the parameters to minimize the possibility of restenosis thereby maximizing the life of the stent depending on the importance that the designer wishes to assign to a specific parameter. Surface finish, method of manufacturing and type of materials are a few parameters which can be included to broaden the scope of this research.
References
[1] Foin, N., Lee, R. D., Torii, R., Guitierrez-Chico, J. L., Mattesini, A., Nijjer, S., & Joner, M. (2014). Impact of stent strut design in metallic stents and biodegradable scaffolds.
International journal of cardiology, 177 (3), 800-808. [2] SCHWARTZ, R. S., & HOLMES, D. R. (1994). Pigs, dogs,
baboons, and man: lessons for stenting from animal studies. Journal of Interventional Cardiology, 7 (4), 355-368.
[3] Kelliher, D., Clune, R., Campbell, J. S., Robinson, J. C., Appelbe, B., & Buttimer, C. (2008). Sensitivity of shape change on the performance of stainless steel cardio-vascular
stents. In Proceedings of the 7th ASMO UK conference on engineering design optimization, Bath (pp. 274-283).
[4] Pant, S., Bressloff, N. W., & Limbert, G. (2012). Geometry parameterization and multidisciplinary constrained optimization of coronary stents. Biomechanics and modeling in mechanobiology, 11 (1-2), 61-82.
[5] Clune, R., Kelliher, D., Robinson, J. C., & Campbell, J. S. (2014). NURBS modeling and structural shape optimization of cardiovascular stents. Structural and Multidisciplinary Optimization, 50 (1), 159-168.
[6] Rogers David, F., & Earnshaw, R. A. (1991). State of the Art in Computer Graphics-Visualization and Modeling.
[7] Pant, S., Limbert, G., Curzen, N. P., & Bressloff, N. W. (2011). Multiobjective design optimisation of coronary stents. Biomaterials, 32 (31), 7755-7773.
[8] Li, N., Zhang, H., & Ouyang, H. (2009). Shape optimization of coronary artery stent based on a parametric model. Finite Elements in Analysis and Design, 45 (6), 468-475.
[9] Tammareddi, S., Sun, G., & Li, Q. (2016). Multiobjective robust optimization of coronary stents. Materials & Design,
90, 682-692.
[10] McKay MD, Beckman RJ, Conover WJ. A comparison of three methods for selecting values of input variables in the analysis of output from a computer code. Technometrics. 2000 Feb 1;42 (1):55-61.
[11] Iman RL, Conover WJ. Small sample sensitivity analysis techniques for computer models. with an application to risk assessment. Communications in statistics-theory and methods. 1980 Jan 1; 9 (17):1749-842.
[12] Olsson A, Sandberg G, Dahlblom O. On Latin hypercube sampling for structural reliability analysis. Structural safety. 2003 Jan 31;25 (1): 47-68.