ISSN: 2231-5381
http://www.ijettjournal.org
Page 576
Extracting Large Data using Big Data Mining
Ms. Neha A. Kandalkar1, Prof. Avinash Wadhe2
1
ME-CSE (Scholar), G.H.R.C.E.M Department of Computer Science & Amravati University, India
2Asst.Professor, G.H.R.C.E.M Department of Computer Science & Amravati University, India
Abstract
—
Innovations in technology and greater affordability of digital devices have presided over today’s Age of Big Data, inthe quantity and diversity of high frequency digital data. These
data hold the potential to allow decision makers to track
development progress, improve social protection, and
understand where existing policies and programmes require
adjustment. For example Turning Big Data—call logs,
mobile-banking transactions, online user-generated content such as blog
posts and Tweets, online searches, satellite images, etc.—into
actionable information requires using computational techniques
to unveil patterns within and between these extremely large
socioeconomic datasets. The data-driven decision-making is now
being recognized broadly, and there is growing enthusiasm for
the notion of ``Big Data.’’ But there is currently a wide gap
between its potential and its realization of real Big Data.
Heterogeneity, scale, timeliness, complexity, and privacy
problems with Big Data impede progress at all phases of the
pipeline that can create value from data. When the data requires
us to make decisions, the problems start right away during data
acquisition, , currently in an ad hoc manner, about what data to
keep and what to discard, and how to store what we keep reliably
with the right metadata. Much data today from tweets and blogs
are weakly structured pieces of text and is not natively in
structured format, while images and video are structured for
storage and display, but not for semantic content and search.
With this, transforming such content into a structured format for
later analysis it is a major challenge. A major investment in Big
Data which should be properly directed, can result not only in
major scientific advances, but also lay the foundation for the next
generation of advances in science, medicine, and business.
Keywords—Big data, Autonomous sources, Data mining, Data
acquisition, Aggregation .
Introduction
Recent years have witnessed a dramatic increase in our
ability to collect data from various sensors, devices, in
different formats, from independent or connected applications.
This data ood has outpaced our capability to process, analyze,
store and understand these datasets. Consider the Internet data.
The web pages indexed by Google were around one million in
1998, but quickly reached 1 billion in 2000 and have already
exceeded 1 trillion in 2008. This rapid expansion is
accelerated by the dramatic increase in acceptance of social
networking applications, such as Facebook, Twitter, Weibo,
etc., that allow users to create contents freely and amplify the
already huge Web volume. Furthermore, with mobile phones
becoming the sensory gateway to get realtime data on people
from different aspects, the vast amount of data that mobile
carrier can potentially process to improve our daily life has
significantly outpaced our past CDR (call data record)-based
processing for billing purposes only. It can be foreseen that
Internet of things (IoT) applications will raise the scale of data
to an unprecedented level. People and devices (from home
co_ee machines to cars, to buses, railway stations and airports)
are all loosely connected. Trillions of such connected
components will generate a huge data ocean, and valuable
information must be discovered from the data to help improve
quality of life and make our world a better place. For example,
after we get up every morning, in order to optimize our
commute time to work and complete the optimization before
we arrive at once, the system needs to process information
from tra_c, weather construction, police activities to our
ISSN: 2231-5381
http://www.ijettjournal.org
Page 577
tight time constraints. In all these applications, we are facing
significant challenges in leveraging the vast amount of data,
including challenges in (1) system capabilities (2) algorithmic
design (3) business models.
I. Big Data Mining
The term 'Big Data' appeared for first time in 1998 in a Silicon
Graphics (SGI) slide deck by John Mashey with the title of
"Big Data and the Next Wave of Infra Stress" . Big Data
mining was very relevant from the beginning, as the _rst book
mentioning 'Big Data' is a data mining book that appeared also
in 1998 by Weiss and Indrukya .However, the _rst academic
paper with the words 'Big Data' in the title appeared a bit later
in 2000 in a paper by Diebold . The origin of the term 'Big
Data' is due to the fact that we are creating a huge amount of
data every day. Usama Fayyad in his invited talk at the KDD
BigMine'12Workshop presented amazing data numbers about
internet usage, among them the following: each day Google
has more than 1 billion queries per day, Twitter has more than
250 milion tweets per day, Facebook has more than 800
million updates per day, and YouTube has more than 4 billion
views per day. The data produced nowadays is estimated in
the order of zetta bytes, and it is growing around 40% every
year. We need new algorithms, and new tools to deal with all
of this data. Doug Laney[19] was the _rst one in talking about
3 V's in Big Data management:
_ Volume: there is more data than ever before, its size
continues increasing, but not the percent of data that our tools
can process
_ Variety: there are many different types of data, as text,
sensor data, audio, video, graph, and more
_ Velocity: data is arriving continuously as streams of data,
and we are interested in obtaining useful information
from it in real time Nowadays, there are two more V's:
_ Variability: there are changes in the structure of the data and
how users want to interpret that data
_ Value: business value that gives organization a compelling
advantage, due to the ability of making decisions based in
answering questions that were previously considered beyond
reach Gartner[15] summarizes this in their definition of Big
Data in 2012 as high volume, velocity and variety information
assets that demand cost-e_ective, innovative forms of
information processing for enhanced insight and decision
making. There are many applications of Big Data, for example
the following
_ Business: costumer personalization, churn detection
_ Technology: reducing process time from hours to seconds
_ Health: mining DNA of each person, to discover, monitor
and improve health aspects of every one
_ Smart cities: cities focused on sustainable economic
development and high quality of life, with wise management
of natural resources.These applications will allow people to
have better services, better costumer experiences, and also be
healthier, as personal data will permit to prevent and detect
illness much earlier than before .
Structured, or semi-structured and unstructured data
In order to talk about Big Data you have to know a little about
data types. The BI data just referred to is also called structured
data because, surprise, surprise, it is very structured.
Structured data can best be thought of as transaction data:
CRM data, point of sale (POS) data, loyalty data, phone
numbers, addresses, etc. These are rows and columns that fit
nicely into a data warehouse and can be accessed via SQL
queries and viewed via Excel spreadsheets. Semi-structured
data is a bit more nebulous. It consists of things like
clickstream data, weblogs, the meta data in a Word document;
things that contain certain structured elements like a time and
date stamp but may otherwise be made up of information that
doesn’t lend itself to rows and columns like text. Unstructured
data (often referred to as non-relational) is everything else: the
contents of Word documents, natural language processing
(NLP) data from call center interactions with customers, video,
images, pics, graphics, social media streams like Twitter and
ISSN: 2231-5381
http://www.ijettjournal.org
Page 578
basically, all the stuff you and I would recognize easily as
content but a machine would have no clue what to do with. It
is this portion of the data world that is growing fastest and is
also the hardest to analyze using traditional methods.
Big data vs lots of data
Just because you have lots of data, which you do, that doesn’t
automatically make it Big Data. Yes, it qualifies for the for the
first V, volume, but lots of structured data sitting in a
corporate database’s somewhere is not very interesting by
itself. To turn lots of data into Big Data you have to combine
it with a time and/or velocity dependent business need like
fraud detection, event-based marketing, or markdown
optimization and then do everything really, really fast using a
wide variety of data sources … that’s Big Data -- the “3Vs” in
motion. Now to be clear, not everything has a real-time
component to it but it usually has a business-time or
human-time element. If you’re a sports team using Big Data analytics
to improve game to game, getting results back in three to five
days isn’t going to cut it. You’ll want results within hours of
the last game so you can apply them in practice during the
coming week.
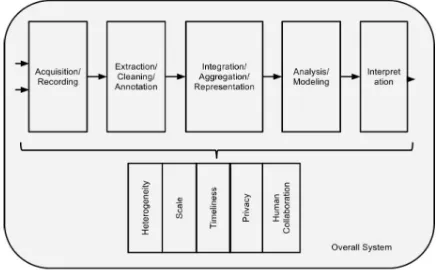
Fig. 1 The Big Data Analysis Pipeline System with major
steps involved in Big Data Mining
II. Phases In The Processing Pipeline
A. Data Acquisition and Recording
Big Data does not arise out of a vacuum: it is recorded from
some data generating source. For example, consider our
ability to sense and observe the world around us, from the
heart rate of an elderly citizen, and presence of toxins in the
air we breathe, to the planned square kilometer array
telescope, which will produce up to 1 million terabytes of raw
data per day. Similarly, scientific experiments and simulations
can easily produce petabytes of data today.
Much of this data is of no interest, and it can be filtered and
compressed by orders of magnitude. One challenge is to
define these filters in such a way that they do not discard
useful information. For example, suppose one sensor reading
differs substantially from the rest: it is likely to be due to the
sensor being faulty, but how can we be sure that it is not an
artifact that deserves attention? In addition, the data collected
by these sensors most often are spatially and temporally
correlated (e.g., traffic sensors on the same road segment). We
need research in the science of data reduction that can
intelligently process this raw data to a size that its users can
handle while not missing the needle in the haystack.
Furthermore, we require “on-line” analysis techniques that can
process such streaming data on the fly, since we cannot afford
to store first and reduce afterward.
The second big challenge is to automatically generate the right
metadata to describe what data is recorded and how it is
recorded and measured. For example, in scientific
experiments, considerable detail regarding specific
experimental conditions and procedures may be required to be
able to interpret the results correctly, and it is important that
such metadata be recorded with observational data. Metadata
acquisition systems can minimize the human burden in
recording metadata. Another important issue here is data
provenance. Recording information about the data at its birth
is not useful unless this information can be interpreted and
carried along through the data analysis pipeline. For example,
a processing error at one step can render subsequent analysis
useless; with suitable provenance, we can easily identify all
subsequent processing that dependent on this step. Thus we
ISSN: 2231-5381
http://www.ijettjournal.org
Page 579
data systems that carry the provenance of data and its
metadata through data analysis pipelines.
B. Information Extraction and Cleaning
Frequently, the information collected will not be in a format
ready for analysis. For example, consider the collection of
electronic health records in a hospital, comprising transcribed
dictations from several physicians, structured data from
sensors and measurements (possibly with some associated
uncertainty), and image data such as x-rays. We cannot leave
the data in this form and still effectively analyze it. Rather we
require an information extraction process that pulls out the
required information from the underlying sources and
expresses it in a structured form suitable for analysis. Doing
this correctly and completely is a continuing technical
challenge. Note that this data also includes images and will in
the future include video; such extraction is often highly
application dependent (e.g., what you want to pull out of an
MRI is very different from what you would pull out of a
picture of the stars, or a surveillance photo). In addition, due
to the ubiquity of surveillance cameras and popularity of
GPS-enabled mobile phones, cameras, and other portable devices,
rich and high fidelity location and trajectory (i.e., movement
in space) data can also be extracted.
C. Data Integration, Aggregation, and Representation
Given the heterogeneity of the flood of data, it is not enough
merely to record it and throw it into a repository. Consider, for
example, data from a range of scientific experiments. If we
just have a bunch of data sets in a repository, it is unlikely
anyone will ever be able to find, let alone reuse, any of this
data. With adequate metadata, there is some hope, but even so,
challenges will remain due to differences in experimental
details and in data record structure.
Data analysis is considerably more challenging than simply
locating, identifying, understanding, and citing data. For
effective large-scale analysis all of this has to happen in a
completely automated manner. This requires differences in
data structure and semantics to be expressed in forms that are
computer understandable, and then “robotically” resolvable.
There is a strong body of work in data integration that can
provide some of the answers. However, considerable
additional work is required to achieve automated error-free
difference resolution.
Even for simpler analyses that depend on only one data set,
there remains an important question of suitable database
design. Usually, there will be many alternative ways in which
to store the same information. Certain designs will have
advantages over others for certain purposes, and possibly
drawbacks for other purposes. Witness, for instance, the
tremendous variety in the structure of bioinformatics
databases with information regarding substantially similar
entities, such as genes. Database design is today an art, and is
carefully executed in the enterprise context by highly-paid
professionals. We must enable other professionals, such as
domain scientists, to create effective database designs, either
through devising tools to assist them in the design process or
through forgoing the design process completely and
developing techniques so that databases can be used
effectively in the absence of intelligent database design.
D. Query Processing, Data Modeling, and Analysis
Methods for querying and mining Big Data are fundamentally
different from traditional statistical analysis on small samples.
Big Data is often noisy, dynamic, heterogeneous, inter-related
and untrustworthy. Nevertheless, even noisy Big Data could
be more valuable than tiny samples because general statistics
obtained from frequent patterns and correlation analysis
usually overpower individual fluctuations and often disclose
more reliable hidden patterns and knowledge. Further,
interconnected Big Data forms large heterogeneous
information networks, with which information redundancy
ISSN: 2231-5381
http://www.ijettjournal.org
Page 580
conflicting cases, to validate trustworthy relationships, to
disclose inherent clusters, and to uncover hidden relationships
and models.
Mining requires integrated, cleaned, trustworthy, and
efficiently accessible data, declarative query and mining
interfaces, scalable mining algorithms, and big-data
computing environments. At the same time, data mining itself
can also be used to help improve the quality and
trustworthiness of the data, understand its semantics, and
provide intelligent querying functions. As noted previously,
real-life medical records have errors, are heterogeneous, and
frequently are distributed across multiple systems. The value
of Big Data analysis in health care, to take just one example
application domain, can only be realized if it can be applied
robustly under these difficult conditions. On the flip side,
knowledge developed from data can help in correcting errors
and removing ambiguity. For example, a physician may write
“DVT” as the diagnosis for a patient. This abbreviation is
commonly used for both “deep vein thrombosis” and
“diverticulitis,” two very different medical conditions. A
knowledge-base constructed from related data can use
associated symptoms or medications to determine which of
two the physician meant.
Big Data is also enabling the next generation of interactive
data analysis with real-time answers. In the future, queries
towards Big Data will be automatically generated for content
creation on websites, to populate hot-lists or recommendations,
and to provide an ad hoc analysis of the value of a data set to
decide whether to store or to discard it. Scaling complex query
processing techniques to terabytes while enabling interactive
response times is a major open research problem today.
E. Interpretation
Having the ability to analyze Big Data is of limited value if
users cannot understand the analysis. Ultimately, a
decision-maker, provided with the result of analysis, has to interpret
these results. This 7 interpretation cannot happen in a vacuum.
Usually, it involves examining all the assumptions made and
retracing the analysis. Furthermore, as we saw above, there
are many possible sources of error: computer systems can
have bugs, models almost always have assumptions, and
results can be based on erroneous data. For all of these
reasons, no responsible user will cede authority to the
computer system. Rather she will try to understand, and
verify, the results produced by the computer. The computer
system must make it easy for her to do so. This is particularly
a challenge with Big Data due to its complexity. There are
often crucial assumptions behind the data recorded. Analytical
pipelines can often involve multiple steps, again with
assumptions built in. The recent mortgage-related shock to the
financial system dramatically underscored the need for such
decision-maker diligence -- rather than accept the stated
solvency of a financial institution at face value, a
decision-maker has to examine critically the many assumptions at
multiple stages of analysis.
III. System Architechture
Companies today already use, and appreciate the value of,
business intelligence. Business data is analyzed for many
purposes: a company may perform system log analytics and
social media analytics for risk assessment, customer retention,
brand management, and so on. Typically, such varied tasks
have been handled by separate systems, even if each system
includes common steps of information extraction, data
cleaning, relational-like processing (joins, group-by,
aggregation), statistical and predictive modeling, and
appropriate exploration and visualization tools as shown in
Fig. 1. With Big Data, the use of separate systems in this
fashion becomes prohibitively expensive given the large size
of the data sets. The expense is due not only to the cost of the
systems themselves, but also the time to load the data into
multiple systems. In consequence, Big Data has made it
necessary to run heterogeneous workloads on a single
ISSN: 2231-5381
http://www.ijettjournal.org
Page 581
workloads. The challenge here is not to build a system that is
ideally suited for all processing tasks. Instead, the need is for
the underlying system architecture to be flexible enough that
the components built on top of it for expressing the various
kinds of processing tasks can tune it to efficiently run these
different workloads. The effects of scale on the physical
architecture were considered in Sec 3.2. In this section, we
focus on the programmability requirements. If users are to
compose and build complex analytical pipelines over Big
Data, it is essential that they have appropriate high-level
primitives to specify their needs in such flexible systems. The
Map-Reduce framework has been tremendously valuable, but
is only a first step. Even declarative languages that exploit it,
such as Pig Latin, are at a rather low level when it comes to
complex analysis tasks. Similar declarative specifications are
required at higher levels to meet the programmability and
composition needs of these analysis pipelines. Besides the
basic technical need, there is a strong business imperative as
well. Businesses typically will outsource Big Data processing,
or many aspects of it. Declarative specifications are required
to enable technically meaningful service level agreements, 13
since the point of the out-sourcing is to specify precisely what
task will be performed without going into details of how to do
it. Declarative specification is needed not just for the pipeline
composition, but also for the individual operations
themselves. Each operation (cleaning, extraction, modeling
etc.) potentially runs on a very large data set. Furthermore,
each operation itself is sufficiently complex that there are
many choices and optimizations possible in how it is
implemented. In databases, there is considerable work on
optimizing individual operations, such as joins. It is
well-known that there can be multiple orders of magnitude
difference in the cost of two different ways to execute the
same query. Fortunately, the user does not have to make this
choice – the database system makes it for her. In the case of
Big Data, these optimizations may be more complex because
not all operations will be I/O intensive as in databases. Some
operations may be, but others may be CPU intensive, or a mix.
So standard database optimization techniques cannot directly
be used. However, it should be possible to develop new
techniques for Big Data operations inspired by database
techniques. The very fact that Big Data analysis typically
involves multiple phases highlights a challenge that arises
routinely in practice: production systems must run complex
analytic pipelines, or workflows, at routine intervals, e.g.,
hourly or daily. New data must be incrementally accounted
for, taking into account the results of prior analysis and
pre-existing data. And of course, provenance must be preserved,
and must include the phases in the analytic pipeline. Current
systems offer little to no support for such Big Data pipelines,
and this is in itself a challenging objective.
IV. CONCLUSION
We have entered an era of Big Data. Through better analysis
of the large volumes of data that are becoming available, there
is the potential for making faster advances in many scientific
disciplines and improving the profitability and success of
many enterprises. However, many technical challenges
described in this paper must be addressed before this potential
can be realized fully. The challenges include not just the
obvious issues of scale, but also heterogeneity, lack of
structure, error-handling, privacy, timeliness, provenance, and
visualization, at all stages of the analysis pipeline from data
acquisition to result interpretation. These technical challenges
are common across a large variety of application domains, and
therefore not cost-effective to address in the context of one
domain alone. Furthermore, these challenges will require
transformative solutions, and will not be addressed naturally
by the next generation of industrial products. We must support
and encourage fundamental research towards addressing these
technical challenges if we are to achieve the promised benefits
ISSN: 2231-5381
http://www.ijettjournal.org
Page 582
ACKNOWLEDGMENT
I would like to thank to all the people those who have help me
to give the knowledge about these research papers and I
thankful to my guide with whose guidance I would have
completed my research paper and make it to published, finally
I like to thank to all the website and IEEE paper which I have
gone through and have refer to create my review paper
successful.
REFERENCES
[1]. “Data Mining with Big Data”, Xindong Wu, Fellow, IEEE, Xingquan
Zhu, Senior Member, IEEE, Gong-Qing Wu, and Wei Ding, Senior Member,
IEEE
[2] “Cross-platform aviation analytics using big-data methods “Larsen, T.
[3]. “A Sketch of Big Data Technologies “Zaiying Liu; Ping Yang; Lixiao
Zhang
[4] .M.H. Alam, J.W. Ha, and S.K. Lee, “Novel Approaches to Crawling
Important Pages Early,” Knowledge and Information Systems, vol. 33, no. 3,
pp 707-734, Dec. 2012.
[5]. S. Aral and D. Walker, “Identifying Influential and SusceptibleMembers
of Social Networks,” Science, vol. 337, pp. 337-341, 2012.
[6] A. Machanavajjhala and J.P. Reiter, “Big Privacy: Protecting
Confidentiality in Big Data,” ACM Crossroads, vol. 19, no. 1, pp. 20-23,
2012.
[7]IntelBigthinkersonBigData,
http://www.intel.com/content/www/us/en/bigdata/big-thinkers-on-big-data.html, 2012.
[8]. U. Fayyad. Big Data Analytics: Applications and Opportunities in
On-line Predictive Modeling. http:// big-data-mining.org/keynotes/#fayyad, 2012.
[9]. E. Dumbill, \What is big data? An introduction to the big data
landscape." O'Reilly Strata. January 11, 2012.
http://strata.oreilly.com/2012/01/what-is-big-data.html.
[10]. J . Bughin, M. Chui, and J. Manyika, Clouds, Big Data, and
SmartAssets: Ten Tech-Enabled Business Trends to Watch. McKinSey
Quarterly, 2010.
[11]. S. Papadimitriou and J. Sun, “Disco: Distributed Co-Clustering with
Map-Reduce: A Case Study Towards Petabyte-Scale End-to- End Mining,”
Proc. IEEE Eighth Int’l Conf. Data Mining (ICDM ’08), pp. 512-521, 2008.
[12]. “From Databases to Big Data” Sam Madden , Massachusetts Institute of
Technology
[13] R. Ahmed and G. Karypis, “Algorithms for Mining the Evolution of
Conserved Relational States in Dynamic Networks,” Knowledge and