Journal of Water Resources and Ocean Science
2014; 3(5): 61-68Published online October 20, 2014 (http://www.sciencepublishinggroup.com/j/wros) doi: 10.11648/j.wros.20140305.12
ISSN: 2328-7969 (Print); ISSN: 2328-7993 (Online)
A comparative analysis of Lajeunesse model with other
used bed load models - effects on river morphological
changes
Mohamed Gharbi
1, Amel Soualmia
1, Denis Dartus
2, Lucien Masbernat
21
Laboratory of Water Sciences and Technology, National Institute of Agronomy of Tunisia, University of Carthage, Tunis, Tunisia
2
Institute of Fluid Mechanics of Toulouse, National Polytechnic Institute of Toulouse, University of Toulouse, Toulouse, France
Email address:
[email protected] (A. Soualmia), [email protected] (M. Gharbi), [email protected] (D. Dartus), [email protected] (L. Masbernat)
To cite this article:
Mohamed Gharbi, Amel Soualmia, Denis Dartus, Lucien Masbernat. A Comparative Analysis of Lajeunesse Model with other Used Bed Load Models - Effects on River Morphological Changes. Journal of Water Resources and Ocean Science. Vol. 3, No. 5, 2014, pp. 61-68.
doi: 10.11648/j.wros.20140305.12
Abstract:
Among the phenomena that greatly influence the river morphology is the sediment transport, especially the bed load mode causing a significant changes in the river morphology. Indeed, the choice of a model or a methodology that can better quantify sediment transport, remains always poorly understood. In this context, a new approach to studying the morphological evolution of rivers is proposed by Charru in 2004, it is based on a model for the erosion and deposition of the particles under laminar flow. In 2006, Charru proposes an extension of this model to turbulent flow. In more advanced research, Lajeunesse in 2010, realizes an experimental study to support the erosion deposition model of Charru, and proposes a new formula to calculate the bed load transport rate. The current research focuses on the effects of bed load transport on the morphological changes in rivers. In the first part, a comparative analysis of empirical laws of bed load transport with experimental data was conducted, in order to test and validate the new bed load model proposed by Lajeunesse, then to check the grain size effect on the sediment transport capacity. In the second part, we are interested in the study of the morphological evolution in rivers. It was performed through numerical modeling using TELEMAC 2D coupled with SISYPHE. The aim is to understand and analyze the morphological changes in the channel bottom. The analysis of the results presented in this paper showed that through the calculated score, most formulas give satisfactory results. In particular at the grain scale, the new bed load transport relation of Lajeunesse, provides an excellent fit to the experimental data. Finally, we were interested in the study of the morphological changes in the channel bottom, it appers clear that the bed load transport has large impacts on river morphology.Keywords:
Bed Load Transport Models, River Morphology, Bed Load Transport, Erosion, Deposition1. Introduction
The prediction of sediment transport in rivers is one of the most important tasks in fluvial hydraulics, because of its wide applications in nature. It is useful for solving the problems encountered in the river flows, such as turbulent flow in alluvial channels, deposition and erosion, etc... Indeed, the sediments entrained in a flow can be transported along the bed as bed load in the form of sliding and rolling grains, or in suspension as suspended load advected by the main flow [25]. The current research is about the sediment transport modeling and its effects on morphological changes
in rivers. In particular, the bed load transport mode causing a significant change in the river morphology is considered here. In fact, the modeling of bed load has a great importance for the management and landscaping job streams and risk prevention. The purpose is to cover the basic phenomena related to sediments transport in order to fully understand the sediment transport processes [1].
62 Mohamed Gharbi et al.: A Comparative Analysis of Lajeunesse Model with other Used Bed Load Models - Effects on River Morphological Changes
relations with the bottom (erosion and deposition) [23]. The second part is about the morphological changes in rivers. A model was set up to simulate the bed load transport rate for non-cohesive sediment (fine sand) using TELEMAC 2D coupled with SISYPHE. Several tests calculations were performed in this study to analyze and interpret morphological changes in the channel bottom.
2. Context and Issues
Morphological changes in river depend on climatic and geological conditions (soil type, flow rate, slope, particle size of the bottom, etc.). Various factors influence the morphology of a river system; among these factors that greatly influence the river morphology are water flow, flood, hydraulic structures, and largely the sediment transport, especially the bed load transport which may generate huge consequences on the morphology of the bed profile. In fact, the bed load consists of particules that roll, slide or saltate in a layer close to the bed [19]. The bed load transport has been studied exensively in open channel flows, rivers and flumes [13, 14, 16]. The accumulation of large datasets has led to the development of several laws for predicting the bed load transport [24]. Yet the choice of a such corresponding relation that can better quantify the bed load, remains always poorly understood.
In this study, we will focus on the fluid-sediment interaction using the new formula of Lajeunesse to estimate the bed load transport rate and its effects on river morphological changes [4].
In order to better predict the morphological changes in rivers, various methods to quantify the sediment transport rate have been reported from the literature [10]. Typically, there are several approaches to calculating bed load transport in river. Two main approaches can be distinguished. The first one is called the Bagnold Approach [19], defines the bed load transport as that in which the successive contacts of the particles with the bed are strictly limited by the effect of gravity. Whereas the second one, is based on a model for the erosion and deposition of the particles [1], where the bed load transport can also be defined as the product of the number of moving particles per unit area, the particle volume and the particle velocity.
Many formulas to predict the bed load transport rate are established in the Literature. One way to formulate the problem of sediment transport in river and to identify the relevant controlling parameters is to proceed to dimensional analysis [9]. Dimensional analysis of bed load involving three dimensions (length, time and mass), leads to the following relation:
,
,
*,
*
=
D
H
S
R
f
q
τ
(1)One dimensionless form for dimensionless bed load transport q* where:
3 *
RgD q
q = b
(2)
S
hgR
ρ
τ
=
(3)) (
*
gD s ρ
ρ τ
τ
−
= (4)
3 / 4
² ²
H K
U S
s
= (5)
ρ ρ ρ − = s
R (6)
Where qb = bed load transport rate; τ= bed shear stress; τ∗=
Shields number; H = water depth; U = flow velocity; g = the gravitational acceleration; Rh= the hydraulic radius; S = bed
slope; Ks = Strickler coefficient; ρ = density of water usually
1000 kg m-3; ρs = sediment density usually 2650 kgm-3; and R
= relative density [27].
In general, most of the bed load models involve a threshold valu ae of the Shields number τ*c below which no sediment is
transported, [12]. They all predict the same dependence q* α τ*3/2. In the literature, there are two main groups; the first one predicts the bed load transport by “(7)”:
(
* *)
32 *c
q
∝
τ
−
τ
(7) Such as Meyer Peter & Müller (M-P-M) [14]; Einstein [16]; Fernandez-Luque & Van Beek [18]; Wong [21]; and Recking [11].Where τc∗is the critical Shields number:
) (
* c
gD
s c
ρ
ρ
τ
τ
−
= (8)
Whereas the second one proposes the following form “(9)”:
(
* *)
(
* *)
*c c
q
∝
τ
−
τ
τ
−
τ
(9)Such as Ashida & Michiue [15]; Engelund & Fredsoe [17]; and Bridge & Dominic [20].
The next part is devoted to the description of the most commonly used formulas established in the literature for calculating bed load transport rate.
Meyer Peter & Müller (M-P-M) 1948
(
)
8
*
* * 3/2c
q
=
τ
−
τ
(10)Where τc* =0.047. This relation is empirical in nature [14]; it
has been verified with data for uniform coarse sand and gravel. It was developed for Alpine streams in Switzerland [3].
Einstein 1950
Journal of Water Resources and Ocean Science 2014; 3(5): 61-68 63
of the grain and the flow causing the movement [26].
(
)
≥ < − = 0.182 τ si Kτ 40 0.182 τ si 0.465 /τ 0.391 exp K * 3 * * * *q (11)
Where
(
)
3* 2 3 2 36 -1 36 3 2 D D R g
K ν ν
− +
= (12)
υ = the kinematic viscosity, usually υ =10-6 m2/s.
Van Rijn 1984
(
)
(
)
>
−
<
−
=
− −3
T
1
1
.
0
3
T
1
053
.
0
5 . 1 3 . 0 * 5 . 1 50 5 . 0 5 . 0 5 . 1 3 . 0 * 5 . 1 50 5 . 0 5 . 0 *T
D
D
g
R
T
D
D
g
R
q
(13)It’s used to calculate bed load transport rates of particles with mean sizes in the range between 0.2 and 2.0 mm [3]. This equation is based on a dimensionless particle diameter and the transport stage parameter T, defined, respectively [13], as:
(
)
1/350 * ² 1 − = v g s D
D (14)
(
)
cr cr T τ τ τ −= (15)
Lajeunesse 2010
In further research, Van Rijn submits an alternative way to treat the problem of bed load transport; it is to consider that qb can be written:
V
n
v
q
b=
δ
.
.
(16)Where n = the surface density of moving particles; V = the mean particle velocity; and δv = the volume of an individual particle [13]. This new alternative has motivated many researchers to study the trajectory of bed load particles [1, 4, 13].
Up to now, the majority of the bed load transport laws proposed in the literature have been focused on the establishment of a relation between the local volumetric flow rate of particles and the local shear stress exerted by the fluid flow on the bed. These relations implicitly consider that the particle flux is in equilibrium with the shear stress, and consequently ignore any relaxation effect [9]. In order to overcome this limitation, in 2004, Charru developed an erosion-deposition model from viscous flow experiments [1], which accounts for a relaxation effect related to the time needed for a particle to settle once it is entrained in the fluid flow. This model was applied for laminar flow and a small bed shear stress where the particles are transported as bed load. In 2006, Charru propose an extension of this model to turbulent flow [2].
Referring to “(16)”, the bed load flux is proportional to n,
the surface density of moving particles. For steady and spatially uniform flow, this density corresponds to dynamical equilibrium between the particles eroded from the fixed bed and deposited onto it [2]. The variation of n(x, t) is governed by the conservation equation “(17)”:
V
n
Q
where
x
Q
n
n
t
n
de
=
.
∂
∂
−
−
=
∂
∂
• • (17)“Equation (17) states that the variation rate of n is related to exchanges with the fixed bed, through the erosion rate (ṅe)
and the deposition rate (ṅd); and to the divergence of the bed
load flux”.
In more advanced research, Lajeunesse in 2010 realize an experimental study to support the erosion deposition model of Charru [2], and allow the calibration of the involved coefficients [9].
In addition, based on the new approach of Charru “(17)” and experimental data, Lajeunesse propose a new bed load relation for a steady and uniform flow above a flat topography. The new law is given by the following equation:
(
)
(
0
.
025
)
6
.
10
* * * *3
=
−
c−
c+
sat
RgD
q
τ
τ
τ
τ
(18)In the first part of this current research, we are interested in a comparative analysis of experimental data of Lajeunesse’s experiment and those calculated through different empirical laws “(10)”, “(11)”, “(13)”, and “(18)”. The aim is to test the new bed load law proposed by Lajeunesse [9].
Thereafter, on the first hand in order to validate this new model another comparative study was conducted with other experimental data measured by Sequeiros 2010 [15].
On the other hand and in order to visualize the influence of the grain size on sediment transport; several performance simulation tests of the main sediment transport formulas on a set of data were investigated. It was considered the variation of the particle diameter ranging from 1 µm, to 2000 µm, (from silt-clay to coarse sand).
The second part is devoted to the numerical modeling using TELEMAC 2D coupled with SISYPHE; the objective is to study the morphological change of the channel bottom due to the bed load transport.
3. Materials and Methods
With the intention of testing and validating the new formula proposed by Lajeunesse in 2010, we conducted a comparative study [9], based on literature experimental data. In the first step we tested the model by using the results of the Lajeunesse experiment. In the second step, to validate this new model, we used the Sequeiros experiment [24]. But before that, we start here by giving a brief description of these experiments.
3.1. Lajeunesse Experiment 2010
64 Mohamed Gharbi et al.: A Comparative Analysis of Lajeunesse Mode
inclinable flume of width W = 9.6 cm and length 240 cm 1” partially filled with an erodible bed of quartz grains of density ρs = 2650 kg m−3 (R = 1.65).
Figure 1. Photo of the Lajeunesse experimental setup
The bed slope S was measured with a digital inclinometer with accuracy 0.1°. Once the bed was ready, water was injected by a pump at the upstream flume inlet with constant discharge W.qw, where qw is the water discharge per unit width.
To prevent any disturbance of the bed, water was not injected as a point source but rather it overflowed smoothly onto the flume bed via a small reservoir. For all runs the discharge was high enough for the flow to fill the whole width of the flume.
The water depth H was measured from the deviation of a laser sheet. This depth was found to be constant along the section of the flume within the experimental precision. Assuming that the depth- averaged flow velocity was
in the spanwise direction, the velocity was given by [8].
At the flume outlet, particles transported by the flow settled out in an overflow tank with constant water level. The tank rested on a high-precision scale connected to a computer th recorded the weight every ten seconds. The sediment discharge per unit river width qb was deduced from the
sediment cumulative mass [8].
The influence of the grain size on sediment transport was investigated by performing three series of experiments. In first series D is equal to 1 mm, in the second ones D=2.24 mm, and for the third ones D = 5.50 mm.
3.2. Sequeiros Experiment
An experimental study was conducted to
transport and to validate the modified formula of Mayer Peter by Sequeiros in 2010. The experience was
flume 15 m length, 0.45 m wide and 1.
University of Illinois Ven Te Chow Hydrosystems Laboratory (V.T.C.H.L) “Fig. 2”.
The tank was initially filled with fresh water. Dense mixtures of water were fed into the flume from a 4 mixing tank by means of a pump. The discharge rate was measured by a magnetic McCrometer
sediment was injected uniformly along the flume width at its
: A Comparative Analysis of Lajeunesse Model with other Used Bed Load Models Morphological Changes
inclinable flume of width W = 9.6 cm and length 240 cm “Fig. partially filled with an erodible bed of quartz grains of
experimental setup 2010 [8].
The bed slope S was measured with a digital inclinometer with accuracy 0.1°. Once the bed was ready, water was injected by a pump at the upstream flume inlet with constant is the water discharge per unit width. To prevent any disturbance of the bed, water was not injected as a point source but rather it overflowed smoothly onto the flume bed via a small reservoir. For all runs the discharge was ll the whole width of the flume. The water depth H was measured from the deviation of a laser sheet. This depth was found to be constant along the section of the flume within the experimental precision. averaged flow velocity was uniform
in the spanwise direction, the velocity was given by U =qw/H
At the flume outlet, particles transported by the flow settled out in an overflow tank with constant water level. The tank precision scale connected to a computer that recorded the weight every ten seconds. The sediment was deduced from the
he influence of the grain size on sediment transport was investigated by performing three series of experiments. In the first series D is equal to 1 mm, in the second ones D=2.24 mm,
An experimental study was conducted to studying bed load transport and to validate the modified formula of Mayer Peter experience was carried out in a .4 m deep, at the University of Illinois Ven Te Chow Hydrosystems Laboratory
The tank was initially filled with fresh water. Dense water were fed into the flume from a 4.5 m3 mixing tank by means of a pump. The discharge rate was measured by a magnetic McCrometer flow meter. The sediment was injected uniformly along the flume width at its
upstream end [24]. A layer of plane bed sedime
particles with a specific gravity of 2650 was placed on the bed and smoothed to a constant thickness before each run. This sediment served as the source for bed load. The water depth in the tank was 0.41 m at the upstream end of the sedimen covered reach. At the downstream end, the water depth ranged from 0.71 to 0.43 m. A set of five sediment traps located immediately downstream of the movable bed ensured the collection of bed load [24]. The traps consisted of box like transversal slots, 4 cm high and 15 cm long, covering the whole width of the flume, located at the same level as the sediment bed, to avoid local erosion at the boundary between the traps and the bed. The velocity profiles were taken with an Acoustic Doppler Velocimeter (ADV)
conducted to measure each time the bed load transport channel bed evolution
4. Results and Discussion
Let us summarize our results on the motion of bed load particles above a plane bed [9, 2
into 4 parts: The first part is a comparative analysis of Lajeunesse data and simulation
different empirical laws “(10)”, “(11)”, “(13)”, and “(18)” The second part is about the validat
proposed by Lajeunesse. For this, we data, the Sequeiros experiment the most commonly used model
intend to visualize the particles size effects on the predic of bed load transport rate. The last
morphological changes under water flow.
Figure 2. Sketch of the Sequeiros experimental set 4.1. Tests of the Lajeunesse New Bed Load Model
Figure 3. Simulations of the dimensionless transport rate q* versus Shields number τ* for D = 1000 µm (Lajeunesse Data
l with other Used Bed Load Models - Effects on River
. A layer of plane bed sediment consisted of particles with a specific gravity of 2650 was placed on the bed and smoothed to a constant thickness before each run. This sediment served as the source for bed load. The water depth in the tank was 0.41 m at the upstream end of the sediment covered reach. At the downstream end, the water depth ranged from 0.71 to 0.43 m. A set of five sediment traps located immediately downstream of the movable bed ensured the . The traps consisted of box like cm high and 15 cm long, covering the whole width of the flume, located at the same level as the sediment bed, to avoid local erosion at the boundary between the traps and the bed. The velocity profiles were taken with an ustic Doppler Velocimeter (ADV). Several tests were conducted to measure each time the bed load transport rate and
Results and Discussion
Let us summarize our results on the motion of bed load 24]. The results may be divided 4 parts: The first part is a comparative analysis of simulations that we done with the “(10)”, “(11)”, “(13)”, and “(18)”. validation of the new formula . For this, we used other experimental experimental ones and simulations with the most commonly used models [9]. In the third part, we particles size effects on the prediction . The last part is devoted to the river under water flow.
Sketch of the Sequeiros experimental set-up 2010 [24].
New Bed Load Model
Journal of Water Resources and Ocean Science 2014;
We consider the same conditions of Lajeunesse experiment carried out in 2010. This mean the same hydraulic conditions (water flow, water depth, velocity) and also the same sediment properties (uniform non-cohesive sediments, the particles diameter D = 1000 µm). The critical Shields number determined from the proposed formulas of Van Rijn “(13)” based on the Shields diagram [12].
Several simulations were carried out to test the new bed load transport model proposed by Lajeunesse in 2010. The results of our performed simulations are summarized in the “Fig. 3”:
The analysis indicates that the proposed model of Lajeunesse gives satisfactory results. The simulated bed rate is closely correlated with the experimental data. Furthermore, we note that the Van Rijn
acceptable results but with a little lag. Each of the models used in calculating bed load transport rates has some to predict reliably the bed load rate. We a
Einstein [16] and Meyer Peter & Müller
unable to reproduce correctly the bed load transport rate. To check the reliability of the results
different tested formulas used to quantify the calculate the Percent Ratio given by the following
obs sim
Q
Q
r
=
Where r= is the percent ratio within a Qobs= observed solide discharge, and Qsim=
discharge.
For example, a score of 50% shown for the interval [0.1 10] means that 50% of predictions are correct, which is a reasonable interval considering the natural
bed load transport. For our case study, we two intervals. The results are summarized below.
Table 1. Scores (%) obtained with the tested formulas on the Lajeunesse in the considered intervals r
Formulas 0.5 < r < 4
Einstein 60
Meyer-Peter & Müller 64
Van Rijn 69
Lajeunesse 72
All the tested formulas have a score higher than 70% corresponding to the ratio r within the interval
the range 0.2 < r < 4, a good score (up 60%) is obtained by some formulas. The obtained scores confirmed again that the new law proposed by Lajeunesse give satisfactory results 83%).
4.2. Validation of the Lajeunesse Model
In order to check the validity of the Lajeunesse formula on other experimental cases, we applied it to the Sequeiros experiment carried out in 2010.
We desired to compare the experimental data measured
Journal of Water Resources and Ocean Science 2014; 3(5): 61-68
We consider the same conditions of Lajeunesse experiment carried out in 2010. This mean the same hydraulic conditions (water flow, water depth, velocity) and also the same sediment cohesive sediments, the particles diameter D = 1000 µm). The critical Shields number τ∗c is
determined from the proposed formulas of Van Rijn “(13)”
Several simulations were carried out to test the new bed d transport model proposed by Lajeunesse in 2010. The results of our performed simulations are summarized in the
The analysis indicates that the proposed model of Lajeunesse gives satisfactory results. The simulated bed load with the experimental data. model [13] gives Each of the models used in calculating bed load transport rates has some failure . We also note that the Müller [14] models are unable to reproduce correctly the bed load transport rate.
reliability of the results obtained by the to quantify the bed load rate, we given by the following equation :
(19)
ercent ratio within a given interval, = simulated solide
of 50% shown for the interval [0.1 - 10] means that 50% of predictions are correct, which is a ing the natural fluctuations of . For our case study, we have considered are summarized in the Table 1
on the Lajeunesse data,
0.1 < r < 10 71 75 79 83
formulas have a score higher than 70% within the interval [0.1 - 10]. For good score (up 60%) is obtained by scores confirmed again that the nesse give satisfactory results (up
In order to check the validity of the Lajeunesse formula on other experimental cases, we applied it to the Sequeiros
We desired to compare the experimental data measured
during Sequeiros experiment [25] and the calculated bed load transport by various laws. The “Fig.
results of our performed simulations.
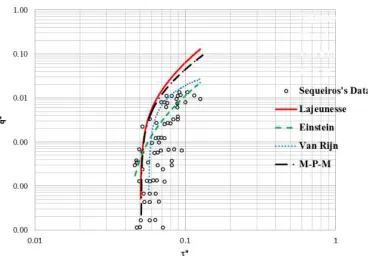
Figure 4. Simulations of the dimensionles Shields number τ* (Sequeiros Data case).
It appears clear that the tested bed load transport relation fitted well the experimental data, it gives satisfactory results. Particular for a low bed shear stress the Lajeunesse mode define a coherent relation with the
We also note that the value of q* predicted by the Lajeunesse and M-P-M models
data trend especially for τ*>0.1, whereas the Van Rijn and Einstein relations provide a better fit with measured data.
In order to verify the reliability of performed with the different models experimental data, we calculate
results are summarized in Table
Table 2. Scores (%) obtained with the tested formulas on in the considered intervals r
Formulas 0.5 < r < 4
Einstein 58
Meyer-Peter & Müller 69
Van Rijn 64
Lajeunesse 71
Most of the models have a score higher than 70% when the ratio r at the range of [0.1 - 10].
model, the calculated score is
good correlations with the experimental data
4.3. Effects of Particle Size on the
The “Fig. 5” below show the particeles size effects on the prediction the bed load transport capacity.
(a) Particles diameter 1
65
during Sequeiros experiment [25] and the calculated bed load The “Fig. 4” below summarizes the performed simulations.
Simulations of the dimensionless transport rate q* versus the Data case).
the tested bed load transport relation fitted well the experimental data, it gives satisfactory results. a low bed shear stress the Lajeunesse model
the experimental data. note that the value of q* predicted by the
models are somewhat higher than the *>0.1, whereas the Van Rijn and a better fit with measured data. the reliability of the calculations the different models on the Sequeiros calculate the Percent Ratio “(19)”. The
able 2.
obtained with the tested formulas on the Sequeiros data,
0.1 < r < 10 68 79 71 78
have a score higher than 70% when the 10]. Concerning the Lajeunesse is higher that 70%, it represents good correlations with the experimental data.
on the Bed Load Transport Rate
The “Fig. 5” below show the particeles size effects on the prediction the bed load transport capacity.
66 Mohamed Gharbi et al.: A Comparative Analysis of Lajeunesse Model with other Used Bed Load Models - Effects on River Morphological Changes
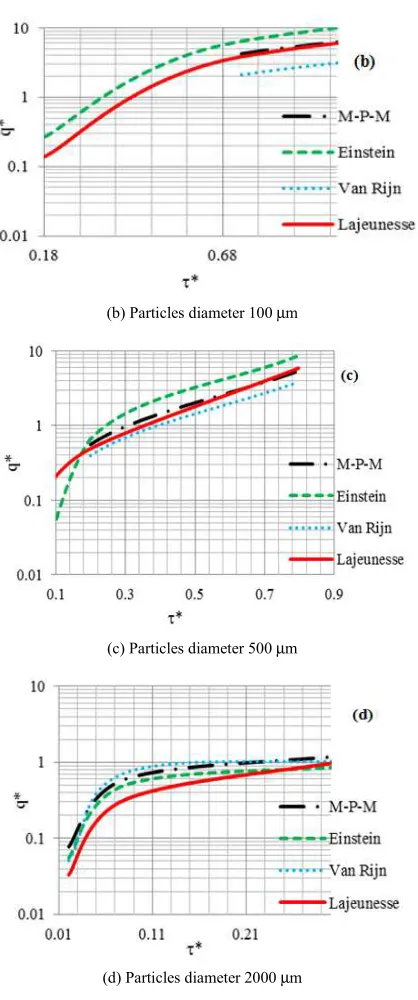
(b) Particles diameter 100 µm
(c) Particles diameter 500 µm
(d) Particles diameter 2000 µm
Figure 5. Simulations of the dimensionless transport rate (q*) versus the Shields number (τ*): Influence of grain size (D).
Here, it was considered the particle’s diameter variation
(from D = 1 µm to D = 2000 µm), to calculate the bed load
transport rate by 4 of the most commonly used empirical laws given by the equations “(10)”, “(11)”, “(13)”, and “(18)”.
The “Fig. 5” illustrates the results of bed load transport rate calculated for several set of materials having different diameters ranging from 1 µm to 2000 µm (from silt-clay to coarse sand).
Four formulas were applied to predict the sediment transport rate by bed load. The aims is to visualize the effect of the particle diameter on the bed load transport rate. Thus we note that for a 25% variation of the particle diameter (D = 500 µm – D = 2000 µm) results in about 17% variation of the transport rate (2.95 10-4 – 0.425 10-4 m2/s).
Our observations show that when the particle diameter is
greater than 100 µm “Fig. 5c”, “Fig. 5d”, the results become
acceptable. Whereas for the lower particle size such as D = 1 µm, we note that these models cannot replicate the reality because they are tested outside of their domain of validity “Fig. 5a”, “Fig. 5b”. We also note that when the grain size exceeds 100 µm, both formulas Van Rijn 1984 and Lajeunesse 2010 give remarkable agreement. Finally, it appears clear that the bed load transport rate depends strongly on the material diameter.
4.4. Bed Load Transport Effects on Morphological Changes in River
Several phenomena may greatly influence the river morphology, in particular the sediment transport. Generally, rivers are constantly seeking equilibrium between the shape of their bed and their flow rates. Sediment deposits tend to offset their wrenched off. In fact, rivers are always looking for a dynamic equilibrium between the two operating processes of erosion and deposition [3].
This current research focuses on the study of morphological changes in channel bottom, by using the Lajeunesse’s experimental data. In order to achieve this, a modeling of sediment transport was performed using TELEMAC 2D coupled with SISYPHE to calculate the bed load transport rate, and subsequently to deduce the channel bottom evolution.
TELEMAC 2D is the hydrodynamic module, it solve the two dimensional Saint Venant equations to simulate free surface flows in two dimensions of horizontal space [6, 7]. At each point of the mesh, the program calculates the water depth and the two velocity components. Whereas SISYPHE is the sediment transport module, it can be used to model complex morphodynamics processes in diverse environments. To calculate the bed evolution, SISYPHE solves the Exner equation:
(
1
)
+
( )
=
0
∂
∂
−
bf
q
Div
t
Z
p
(20)Where p = the bed porosity (p~0.4 for non-cohesive sediment); Zf = the bottom elevation; qb = the solid bed load
transport per unit width [22].
The Exner “equation (20)” states that the variation of sediment bed thickness can be derived from a simple mass balance. “Equation 20 is strictly valid for bed load only”. In this contribution, the effect of the bed slope will be considered by SISYPHE in computing the bed load transport rate. In truth, SISYPHE offers several empirical formulas to calculate the bed load transport rate, but not the Lajeunesse formula.
Therefore, we programmed this new law “(18)” in SISYPHE in order to compare the results given by the different models.
Journal of Water Resources and Ocean Science 2014;
m, and the friction coefficient is constant, corresponding to Strickler coefficient of Ks = 60 m1/3/s
In TELEMAC 2D, we imposed on the upstream of the channel a flow rate qw = 0.001 m3/s for a water depth imposed
on the downstream of the channel H= 0.01 m (Lajeunesse's experiment conditions). In SISYPHE, the sediment transport at the entrance of the channel is calculated assuming equilibrium conditions. The shear stress is calculated by TELEMAC 2D at each time step. During the Lajeunesse experience, the bed load was the sole mode of sediment transport.
Two dimensional river modeling and especially its applications to channel bed morphology can be considered as a relatively new technique [5]. The purpose is
study of 4 bed load laws, Meyer Peter & Müller [16]; Van Rijn [13]; and Lajeunesse [9], was con
aims are to compute the sediment transport rate, and to determine the morphological evolution of the considered channel.
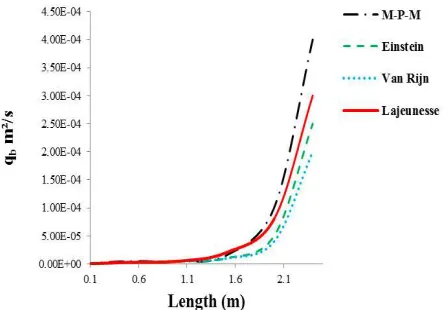
In a first step, we determine the bed load trans the most commonly used bed load transport model 6” below shows the results.
Figure 6. Evolution of the bed load transport along the channel for sediments diameter D = 1000µm.
We note that the different tested models lead to accepta results compared with the sediment discharge
with the exception of MeyerPeter & Müller [14] that presents an overestimation of the
compared with the measured data. These results confirm again the first part of this work, showing that both of Van Rijn and the Lajeunesse model give acceptable results
In a second step, we are interested in the study of the channel bed elevation changes referring to the numerical modeling by using TELEMAC 2D coupled with
fact, once the bed load has been determined, the resulting change of the bed level Zf is calculated from
is coupled (internally) with the hydrodynamic model TELEMAC 2D, where it’s called inside th
model, the data will be exchanged directly between the two programs.
The results of the numerical modeling using TELEMAC 2D coupled with SISYPHE show that there is a longitudinal
Journal of Water Resources and Ocean Science 2014; 3(5): 61-68
m, and the friction coefficient is constant, corresponding to
In TELEMAC 2D, we imposed on the upstream of the /s for a water depth imposed on the downstream of the channel H= 0.01 m (Lajeunesse's conditions). In SISYPHE, the sediment transport channel is calculated assuming equilibrium conditions. The shear stress is calculated by TELEMAC 2D at each time step. During the Lajeunesse experience, the bed load was the sole mode of sediment
Two dimensional river modeling and especially its applications to channel bed morphology can be considered as The purpose is a comparative & Müller [14]; Einstein was conducted. The the sediment transport rate, and to determine the morphological evolution of the considered
he bed load transport rate by bed load transport models. The “Fig.
Evolution of the bed load transport along the channel for sediments
We note that the different tested models lead to acceptable compared with the sediment discharge measurements,
Müllermodel (M-P-M)
presents an overestimation of the bed load rate . These results confirm again g that both of Van Rijn and model give acceptable results [13, 9].
In a second step, we are interested in the study of the channel bed elevation changes referring to the numerical coupled with SISYPHE. In been determined, the resulting is calculated from “(19)”. SISYPHE is coupled (internally) with the hydrodynamic model TELEMAC 2D, where it’s called inside this hydrodynamic model, the data will be exchanged directly between the two
using TELEMAC 2D coupled with SISYPHE show that there is a longitudinal
evolution of the channel bed. We note that the
Müller model show an overestimation of sediment transport
rate, hence there is excessive digging that exceeds 4 cm into the sand layer
In the “Fig. 7” is showed the channel bottom evolution under the flow effect; using different models to calculate the bed load transport (not including suspended sediment).
Figure 7. Morphological evolution of the Experiment).
Our observation show that the Einstein and Lajeunesse models gives practically the same values
hence we observed that there was a digging of the channel bottom under the flow effect. For the diff
that there is a digging in the sand layer of about
average. These changes in the morphological channel bed are induced by the bed load transport.
5. Conclusion
Several formulas have been established in literature to calculate bed load transport, particularly the Lajeunesse model, based on the Charru approach.
comparaisons between model predictions and field data, have been made in order to test and validate t
transport model. The analysis shows
have a score greater than 70% when the ratio range [0.1 - 10]. In particular
Lajeunesse has a score that exceeds simulations analysis showed
capacity depends strongly on the particles diameter. Yet, the use of a such model still requires accurate data
considered site, especially for higher accuracy predictions. Regarding the river morphological evolution, it appears clear from the numerical modeling realized by
coupled with SISYPHE that the changes in the channel bottom depend greatly on the bed load transport rate.
In perspective, we will focus on the inclusion of the Charru’s full model in SISYPHE, and its
laboratory set (Both suspended and bed load transport) then to a real case, which is the Medjerda River situated in the north west of Tunisia.
67
evolution of the channel bed. We note that the MeyerPeter &
an overestimation of sediment transport ence there is excessive digging in the channel bottom exceeds 4 cm into the sand layer.
the channel bottom evolution different models to calculate the bed load transport (not including suspended sediment).
Morphological evolution of the channel bottom (Lajeunesse
Our observation show that the Einstein and Lajeunesse s practically the same values of the bed load rate, observed that there was a digging of the channel bottom under the flow effect. For the different cases, we note that there is a digging in the sand layer of about 3 cm in average. These changes in the morphological channel bed are induced by the bed load transport.
Several formulas have been established in literature to ed load transport, particularly the Lajeunesse model, based on the Charru approach. Model intercomparaisons, and comparaisons between model predictions and field data, have been made in order to test and validate this new bed load ysis shows that most of the formulas when the ratio r is tested in the the proposed new formula of that exceeds 80%. Furthermore the showed that the sediment transport capacity depends strongly on the particles diameter. Yet, the of a such model still requires accurate data on the
especially for higher accuracy predictions. Regarding the river morphological evolution, it appears lear from the numerical modeling realized by TELEMAC 2D that the changes in the channel bottom depend greatly on the bed load transport rate.
68 Mohamed Gharbi et al.: A Comparative Analysis of Lajeunesse Model with other Used Bed Load Models - Effects on River Morphological Changes
Acknowledgments
The authors acknowledge the cooperation of the National Polytechnic Institute of Toulouse (INPT), and particulary the members of HydroEco groups worked under the Institute of Fluid Mechanics of Toulouse (IMFT), France.
Financial support for this study was provided by a grant from the Ministry of Higher Education and Scientific Research in Tunisia.
References
[1] F. Charru, H. Mouilleron, and O. Eiff, “Erosion and deposition of particles on a bed sheared by a viscous flow,” Journal of Fluid Mechanic, Vol. 519, pp. 55–80, 2004.
[2] F. Charru, “Selection of the ripple length on a granular bed sheared by a liquid flow,” Journal Physics of Fluids, Vol. 18, pp. 121508-1, 2006.
[3] E. M. Franklin, “Dynamique de dunes isolées dans un écoulement cisaillé, ” Thesis, University of Toulouse, 2008.
[4] M. García, “Sedimentation Engineering: Processes, Measurements, Modeling, and Practice, in Examining the Confluence of Environmental and Water Concerns,” World Environmental and Water Resource Congress, Graham, pp. 91-94, 2006.
[5] P. Belleudy, “Restoring flow capacity in the Loire River bed,” Hydrological Processes. Hydrol, Process 03. 1220-1233, 2000.
[6] M. Gharbi, and A. Soulamia, “Modélisation de la prévision des crues éclair au niveau du bassin versant de la Medjerda,” Revue de Mécanique Appliquée et Théorique, Vol. 2, 6, pp.585-595, 2013.
[7] M. Gharbi, and A. Soulamia, “Simulations des crues éclair au niveau de la haute vallée de la Medjerda,” Deuxième Congrès Tunisien de Mécanique COTUME, Sousse, Tunisie, pp.81-86, 2012.
[8] M. Houssais, and E. Lajeunesse, “Bed load transport of a bimodal sediment bed,” Journal of Geophysical Research, pp 115-1, 2012.
[9] E. Lajeunesse, L. Malverti, and F. Charru, “Bed load transport in turbulent flow at the grain scale: Experiments and modeling,” Journal of Geophysical Research, Vol. 115, 2010.
[10] A. Recking, “An analysis of nonlinearity effects on bed load transport prediction,” Journal of Geophysical Research: Earth Surface, Vol. 118, pp.1-18, 2013.
[11] A. Recking, P. Frey, A. Paquier, and P. Belleudy, “An experimental investigation of mechanisms involved in bed load sheet production and migration,” Journal of Geophysics Research Vol.114, 2009.
[12] A.F. Shields, Application of similarity principles and turbulence research to bed-load movement, Mitteilungen der Preussischen Versuchsanstalt fur Wasserbau und Schiffbau, Germany,” pp 5–24, 1936.
[13] L. C. Van Rijn, “Principles of Sediment Transport in rivers, Estuaries and Coastal Seas,” Aqua Publications in Netherlands: pp.1-612, 1993.
[14] E. Meyer‐Peter, and R. Müller, “Formulas for bed‐load transport, “ The 2nd Meeting of International Association for Hydraulic Research,” Int. Assoc. for Hydraul, Stockholm, Germany, 1948.
[15] K. Ashida, and M. Michiue, “Studies on bed-load transport rate in open channel flows,” International Association for Hydraulic Research International, Symposium on River Mechanics, Bangkok, Thailand, pp.407–417, 1973.
[16] H. Einstein, “The bed-load function for sediment transportation in open channel flows,” Tech. Bull, U.S, Departement of Agriculture, Washington, D. C, 1950.
[17] F. Engelund, and J. Fredsoe, “A sediment transpot model for straight alluvial channels,” Nord. Hydrol, Vol 7(5), pp.293–306, 1976.
[18] R. Fernandez-Luque, and R. Van Beek, “Erosion and transport of bed load sediment,” Journal of Hydraulic Research, Vol.14, pp.127–144, 1976.
[19] R. Bagnold, “The flow of cohesionless grains in fluids,” Philos. Trans. R. Soc. London A, Vol.249, pp.235–297, 1956.
[20] J. S. Bridge, and D. F. Dominic, “Bed load grain velocity and sediment transport rates,” Water Resourc. Res, Vol.20, pp. 476–490, 1984.
[21] M. Wong, “Does the bedload equation of Meyer Peter and Müller fit its own data,” 30th Congress of the International Association for Hydraulic Research, Int. Assoc. of Hydraul. Res., Thessaloniki, Greece, 2003.
[22] C Villaret, and J. M. Hervouet, “Comparaison croisée de différentes approches pour le transport sédimentaire par charriage et suspension, ” Laboratoire National d'Hydraulique et Environnement. IXèmes Journées Nationales Génie Civil – Génie Côtier, 2006.
[23] Wu Weiming, W Rodi, and T. Wenka, “3D Numerical Modeling of Flow and sediment transport in open Channels,” Journal of Hydraulic Enginee.
[24] O. E. Sequeiros, B. Spinewine, R. T. Beaubouef. T. Sun, M. H. Garcia, and G. Parker, “Bed load transport and bed resistance associated with density and turbidity currents,” Journal of International Association of Sedimentologists, Sedimentology, Vol. 57, pp.1463–1490, 2010.
[25] H. Chanson, “The Hydraulics of Open Channel Flow: An Introduction,” Butterworth-Heinemann, 2nd edition, Oxford, UK, pp. 3-8, 2004.
[26] S. Talukdar, Bimlesh Kumar, and S. Dutta, “Predictive capability of bedload equations using flume data,” Journal of Hydrol. Hydromech, Vol. 60, pp. 45–56, 2012.