1. Introduction
Today, the digital game industry has become one of the most profitable industries, along with other main industries. Also, this fore-mentioned industry has led to economic growth and increase of employment in many countries in the world. According to the statistics from internet resources in the United States, "the turnover of this industry was about twenty-five billion dollars in 2010". Around forty percent of China annual revenue is allocated to the sale of digital games. This volume of sales has been contributed many gaming companies to gamble on mobile games, along with computer game products [1]. In spite of the high sale and income of existing companies in the game industry and along with the best-selling games, there are always unsuccessful game products and failed companies. This indicates the emergence of a performance evaluation system in the game industry [2]. To this end, in this paper, we introduce a new performance evaluation model based on BSC-AHP for the digital game industry.
Quality has already become the top priority among plastics industries. As the surveys are conducted every year, the plastics industry in US responds that no single attribute ranked lower than 3 out of 5 in terms of importance of quality [1]. This importance puts as the stressed of plastics industry to perform
Corresponding author
E-mail address: [email protected] DOI: 10.22105/jarie.2019.163584.1068
Quality Improvement of Molding Machine through Statistical
Process Control in Plastic Industry
Teuku Mirwan Saputra1, Hernadewita Hernadewita1, Akmal Yudha Prawira Saputra1, Lien
Herliani Kusumah1, Hermiyetti ST2
1Master of Industrial Engineering Program, Mercu Buana University, Indonesia. 2Faculty of Economic and Social Science, Bakrie University, Indonesia.
A B S T R A C T P A P E R I N F O
Enhancing the process capability is a must in quality improvement of process manufacturing in the industry. Usually, Statistical Process Control (SPC) is applied to measure the activity of quality improvement. In this case, the statistical process control is used to measure the process capability of molding machine in regard to force the result of inner contact rubber button in the plastic industry. The forces of inner contact rubber button which are produced by molding machine already become the critical point as a judgment of malfunctions or not. Meanwhile, the forces problem still is found in molding machine that affects to the inner contact rubber button as defect product. Furthermore, as the show of SPC, the process capability of molding machine is 0.63. This means the process capability is needed for improvement. Seeing that the result of quality improvement is made by applying Poka-Yoke, the process capability of molding machine is improved to 1.65. Chronicle:
Received: 20 November 2018 Revised: 07 February 2019
Accepted:11 February 2019
Keywords:
Statistical Process Control. Process Capability. Quality Improvement. Poka-Yoke Buzzer.
Journal of Applied Research on Industrial
Engineering
quality improvements in achieving quality requirements. These improvements have to perform in every stage of production in order to produce the final product of customer needs [2]. Thus, the Statistical Process Control (SPC) could be applied to improve the process capability.
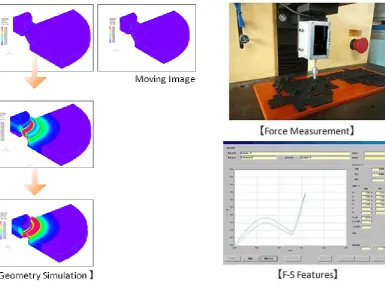
As in a plastic industry which produces inner contact rubber button for automotive component, the quality improvements have to carry out in molding machine in regard to customer complains. Historically, the customer has complained on the malfunctions of inner contact rubber button produced in molding machine which is caused by force problem. The force of inner contact rubber button was found as the critical point for the consideration, either the product can be used or not. However, the force check cannot be detected for every single product produced in molding machine. As of the force check is required a long time and a special measurement instruments which makes sampling method to carried out for checking the force. The force of inner contact rubber button can be detected by using intelligent load tester. This measurement instrument will check the force of the production line that produced in molding machine. The illustrations of force checking as shown in the Fig. 1.
Fig. 1. The process of force checking using intelligent load tester.
Fig. 1 shows the intelligent load tester that checks the inner contact rubber button by push every single of button in order to check the force. If the force of button is out of specification, the product will be malfunctions. In this case, every product that produces in molding machine has a variation of force result, and makes molding machine still having potential to produce a malfunctions product.
variation of force cannot be predicted and the malfunctions product can possibly produce. Therefore, the statistical process control needs to be carried out as a quality improvement in molding machine in order to make sure the force is meet the specification and molding machine is continuing producing the product that meet customer specification.
2. Literature Review
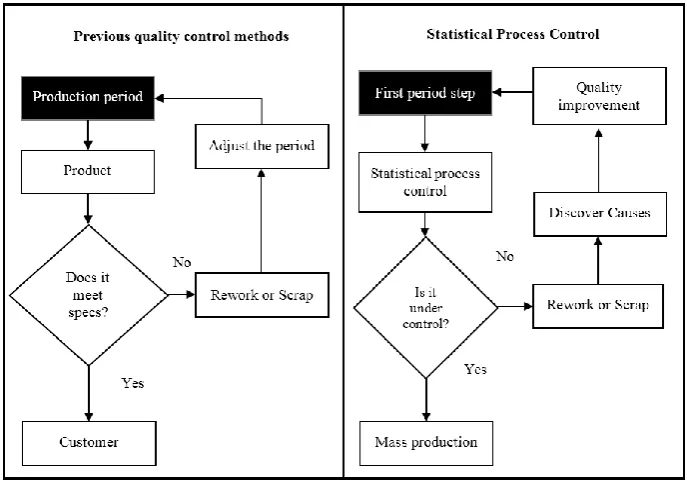
As in the stage of mass productions, statistical process control has a signification contribution in improving quality control. In the previous description, the quality control methods were performed by checking the product produced to determine whether they meet the customer specifications or not. The product that does not meet the specification will be categorized as reject and sent back to machine for re-work or counting as a scrap. Thus, the statistical process control is applying as the vital part of quality production to make sure all production activity is under control while it is used as the quality control methods [3]. The product, which is categorized as under control will be short in production that does not meet the customer specification. The illustration of previous quality control methods and statistical process control will be shown in the Fig. 2 as below.
Fig. 2. Quality control methods.
Furthermore, statistical process control also can be used to determine whether a process is stable or not by differentiating between the presence of common cause variation and assignable cause variation [4]. The difference of variation could be seen through control charts and at the same time also could be used to check for process stability. In this case, a process will be defined as under control, if the probability distribution representing the quality characteristic is constant. If there is some change over the time in this distribution, the process will be defined as out of control [5].
defined based on quality requirements from customer. However, the requirements that still not enough attention for quality were paid by managements. It was happened when there were several decisions that need to execute which do not meet the quality requirement in regard to resources in performing production activity [7]. Thus, the statistical techniques and roles for process development considering recent research works were some examples especially on statistical techniques that were used for quality improvement. Then, the application of statistical process control in manufacturing of chemical and plastic products also have discussed the successfully optimizing the process capability in producing product that meet customer requirements [8].
In the other hand, as in automotive industry, the quality is expressed through the customers’ satisfaction in relation to the products and offered services [9]. As the increasing of quality requirement, the statistical process control can be defined as a set of tools for process management and for determination and monitoring of the quality of an organization objective [10]. This tool also becomes the strategy for improving capability through the reduction of variability of products, deliveries, processes, materials, tools, and equipment [11-13]. The successful implementation of the statistical process control can be lead to decisions making based on facts, a growing perception about quality at all levels, a systematic methodology concerning problem resolution, a gathering of experience of all kind of improvement, even in communication. Majority in manufacturing and focusing on quality, the statistical process control is the most widely used technique [14] and once it appropriately apply, it will improve the operational and achieve the financial benefits [15].
The process control can also be used in creating a qualification measurement for potential and performance of process industry, which includes capacity [16]. The capacity analysis was carried out by elaborating data in statistical calculations for defining the systems capability. Thus, the capability analysis could be used to determine the ability of manufacturing parts on the tolerance limits and engineering values. Capability analysis also gives the information on the system development during the period of time [3]. Process Capability (Cpk) could also be used to determine the process ability that work better in the system rather than specification limits. If the value of Cpk be equal to 1, it means that the production activity is going on track in the system specification limits staying at 99.73% level (±3 sigma limits) [17].
3. Methodology
Fig. 3. Flow process of research.
4. Result and Discussion
4.1. Data Collection
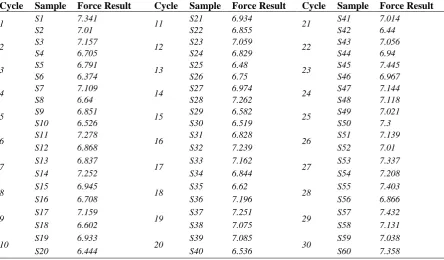
Data collection started from collecting the sample of product after molding as much as 30 cycles. A cycle of molding machine produces two inner contact rubber buttons which means there is 60 samples that need to check. These samples were taken from molding machine that run normally. Then, the force checking will be performed used intelligent load tester in order to know the force result of samples. The force result of samples will be shown in table below.
Table 1. Force result of samples before improvement.
Cycle Sample Force Result Cycle Sample Force Result Cycle Sample Force Result
1 S1 7.341 11 S21 6.934 21 S41 7.014
S2 7.01 S22 6.855 S42 6.44
2 S3 7.157 12 S23 7.059 22 S43 7.056
S4 6.705 S24 6.829 S44 6.94
3 S5 6.791 13 S25 6.48 23 S45 7.445
S6 6.374 S26 6.75 S46 6.967
4 S7 7.109 14 S27 6.974 24 S47 7.144
S8 6.64 S28 7.262 S48 7.118
5 S9 6.851 15 S29 6.582 25 S49 7.021
S10 6.526 S30 6.519 S50 7.3
6 S11 7.278 16 S31 6.828 26 S51 7.139
S12 6.868 S32 7.239 S52 7.01
7 S13 6.837 17 S33 7.162 27 S53 7.337
S14 7.252 S34 6.844 S54 7.208
8 S15 6.945 18 S35 6.62 28 S55 7.403
S16 6.708 S36 7.196 S56 6.866
9 S17 7.159 19 S37 7.251 29 S57 7.432
S18 6.602 S38 7.075 S58 7.131
10 S19 6.933 20 S39 7.085 30 S59 7.038
S20 6.444 S40 6.536 S60 7.358
4.2. Statistical Process Control
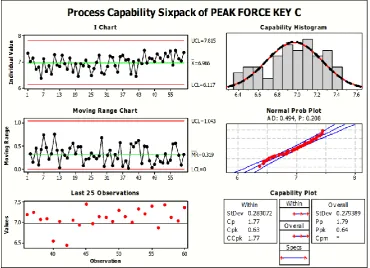
Fig. 4. The result of statistical process control before quality improvement.
In Fig. 4, the process Capability (Cpk) of molding machine is equal to 0.63 which means the variant of force is still high. The variant of force also can be shown in capability histogram that the result of force is start from 6.4 until 7.4. If this conditions continue, the force problem will be possibly occurred. This force problem will be lead to malfunction of inner contact rubber button.
4.3. Discovered the Main Caused
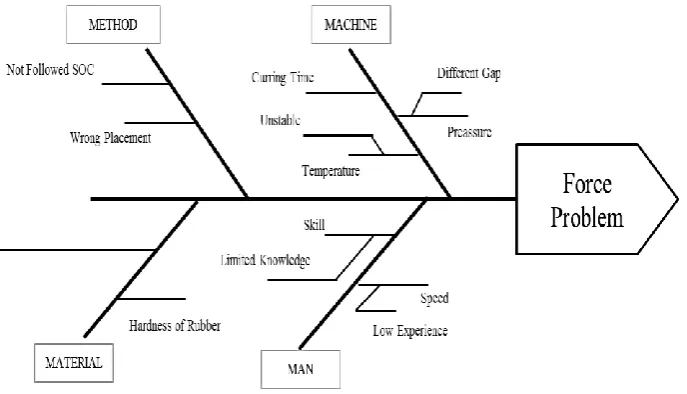
Fig. 5. Fish bone of force problem.
In Fig. 5, it is shown a number of problems that cause force problem. After discussion with experts in the manufacturing line, the main causes that create the force problem are happened in machine, which are curing time, temperature, and pressure. Therefore, the quality improvement needs to perform in order to solve the force problem as the cause of malfunction.
4.4. Quality Improvement
In performing quality improvement, the several activities were decided to solve the problem that were caused by curing time, temperature, and pressure. Previously, the curing time, temperature, and pressure were set manually. The setting of those parameter followed the specification from customer. However, during production activity, those parameters were possibly changed by several external factors. The change sometimes was not recognized by operators which make them to continue run the molding machine although those parameters were changed.
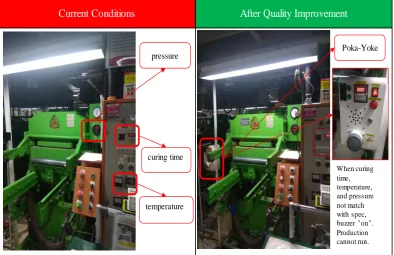
Fig. 6. Quality improvement activities.
As shown in Fig. 6, the current conditions of molding machine do not have any kind alert system to make sure whether the machine runs based on specification parameter. Then, the Poka-Yoke system was applied in molding machine with connecting to the buzzer system of current molding system. The Poka-Yoke buzzer will show a signal if the parameter changes. When one of the parameter changes, the buzzer will be “ON” and the machine cannot be run until the Poka-Yoke system shuts down. Therefore, the operator cannot run the machine with parameter that do not meet the customer specification.
4.5. Statistical Process Control
After performing the quality improvement, the product from molding machine that already is improved by additional Poka-Yoke buzzer will be take as much as 30 cycles. As explained before, in 30 cycles, the molding machine will be produce 60 samples. Those samples will be checked in order to know the force result. Then, the result of force data will be used in statistical process control for analyzing the process capability of molding machine that uses Poka-Yoke system. The following force result is shown in Table 2 and the statistical process control is shown in the Fig. 7.
Table 2. Force result of samples after improvement.
Cycle Sample Force Result Cycle Sample Force Result Cycle Sample Force Result
1 S1 6.745 11 S21 6.694 21 S41 7.054
S2 6.411 S22 6.391 S42 6.753
2 S3 6.384 12 S23 6.156 22 S43 6.817
S4 6.893 S24 6.651 S44 6.654
3 S5 6.375 13 S25 6.625 23 S45 6.698
S6 6.429 S26 6.4 S46 7.131
4 S7 6.615 14 S27 6.523 24 S47 6.665
S8 6.224 S28 6.132 S48 7.137
5 S9 6.406 15 S29 6.699 25 S49 6.995
S10 6.213 S30 6.393 S50 6.97
Current Conditions After Quality Improvement
pressure
curing time
temperature
Poka-Yoke
Cycle Sample Force Result Cycle Sample Force Result Cycle Sample Force Result
6 S11 6.65 16 S31 6.188 26 S51 6.512
S12 6.241 S32 6.437 S52 6.946
7 S13 6.509 17 S33 6.203 27 S53 6.871
S14 6.269 S34 6.458 S54 7.05
8 S15 6.451 18 S35 6.597 28 S55 6.892
S16 6.068 S36 6.709 S56 6.9
9 S17 6.319 19 S37 6.861 29 S57 6.847
S18 6.578 S38 6.453 S58 6.722
10 S19 6.166 20 S39 6.582 30 S59 6.582
S20 6.71 S40 6.445 S60 6.519
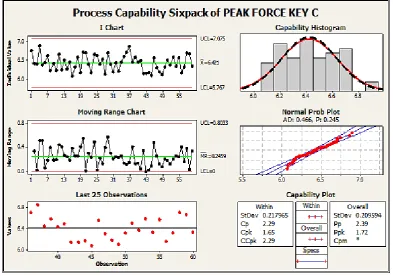
Fig. 7. The result of statistical process control after quality improvement.
As shown in Fig. 7, the process Capability (Cpk) of molding machine was equal to 1.65 which means the process capability gets better. The variant of force becomes controls with small variant of force result which is from 6.1 up to 6.7. It can be seen in I chart, moving range chart, and capability histogram that the range of data separation becomes small. It means the potential of molding machine to produce the product with force problem becomes small.
5. Conclusions
variant of inner contact rubber button malfunctions product (reduce defect), the quality improvement are already applied as a Poka-Yoke buzzer in molding machine.
References
[1] 2017 plastics manufacturing survey results: U.S. manufacturing at all-time high, growth predicted, shifts in process popularity (n.d.). Retrieved May 15, 2019 from https://www.rayplastics.com/plastics-manufacturing-survey-results/
[2] Das, S., & Nanda, A. K. (2013). Some stochastic orders of dynamic additive mean residual life model. Journal of statistical planning and inference, 143(2), 400-407.
[3] Motorcu, A. R., & Güllü, A. (2006). Statistical process control in machining, a case study for machine tool capability and process capability. Materials & design, 27(5), 364-372.
[4] Baldassarre, T., Boffoli, N., Caivano, D., & Visaggio, G. (2004, April). Managing software process improvement (SPI) through statistical process control (SPC). International conference on product focused software process improvement (pp. 30-46). Springer, Berlin, Heidelberg.
[5] Woodall, W. H. (2000). Controversies and contradictions in statistical process control. Journal of quality technology, 32(4), 341-350.
[6] John, B., & Areshankar, A. (2018). Reduction of rework in bearing end plate using six sigma methodology: a case study. Journal of applied research on industrial engineering, 5(1), 10-26.
[7] Jabnoun, N. (2002). Control processes for total quality management and quality assurance. Work study, 51(4), 182-190.
[8] Xie, M., & Goh, T. N. (1999). Statistical techniques for quality. The TQM magazine, 11(4), 238-242. [9] Sanches Jr, L., & Batalha, G. F. (2008). Automotive body-in-white dimensional stability through
pre-control application in the subassembly process. Journal of achievements in materials and manufacturing engineering, 31(2), 705-711.
[10] Škulj, G., Butala, P., & Sluga, A. (2013). Statistical process control as a service: an industrial case study. Procedia CIRP, 7, 401-406.
[11] Montgomery, D. C. (2007). Introduction to statistical quality control. John Wiley & Sons.
[12] Fournier, B., Rupin, N., Bigerelle, M., Najjar, D., & Iost, A. (2006). Application of the generalized lambda distributions in a statistical process control methodology. Journal of process control, 16(10), 1087-1098.
[13] Srikaeo, K., Furst, J. E., & Ashton, J. (2005). Characterization of wheat-based biscuit cooking process by statistical process control techniques. Food control, 16(4), 309-317.
[14] Cook, D. F., Zobel, C. W., & Wolfe, M. L. (2006). Environmental statistical process control using an augmented neural network classification approach. European journal of operational research, 174(3), 1631-1642.
[15] Rungtusanatham, M. (2001). Beyond improved quality: the motivational effects of statistical process control. Journal of operations management, 19(6), 653-673.
[16] Pearn, W. L., & Chen, K. S. (2002). One-sided capability indices C PU and C PL: decision making with sample information. International journal of quality & reliability management, 19(3), 221-245. [17] Opit, P. F., Samadhi, T. A., & Singal, Y. M. (2008). Penerapan Six Sigma Untuk Peningkatan Kualitas
Produk Bimoli Classic (Studi Kasus: PT. Salim Ivomas Pratama–Bitung). J@ TI UNDIP: JURNAL TEKNIK INDUSTRI, 3(1), 17-
[18] Cınar A. Study of process capability: An example and difficulties. Engineer and Machine
1987;28(329):31–2.
[19] Kapuria, T. K., Rahman, M., & Haldar, S. (2017). Root Cause Analysis and Productivity Improvement
of An Apparel Industry In Bangladesh Through Kaizen Implementation. Journal of applied research on
industrial engineering, 4(4), 227-239.