Modeling of Stripper Temperature based on
Improved T-S Fuzzy Neural Network
Shuzhi Gao
School of Information and Engineering, Shenyang University of Chemical Technology, Shenyang, China Email: [email protected]
Yihao Zhang
School of Information and Engineering, Shenyang University of Chemical Technology, Shenyang, China Email: [email protected]
Xianwen Gao
School of Information Science and Engineering, Northeastern University, Shenyang, China Email: [email protected]
Abstract—In the Polyvinyl Chloride (PVC) industry, proper control of stripper temperature is directly related to product quality of PVC resin. Considering multivariable, strong coupling, nonlinear and time-varying characteristics of the temperature control system for PVC stripper the current modeling method is difficult to obtain a relatively accurate mathematical model. Then, this paper studies the stripper temperature modeling method based on improved T-S fuzzy neural network, and proposes new nearest neighbor clustering fuzzy rules. In order to improve the learning performance, hybrid learning algorithm based on T-S fuzzy neural networks is developed. As for non-linear layer parameters, conjugate gradient algorithm is applied, while recursive least squares algorithm is adopted to handle the linear parameters. Simulation results demonstrate the effectiveness and accuracy of the proposed modeling method given.
Index Terms— Stripper, T-S fuzzy neural network, New nearest neighbor clustering algorithm, least square method modeling
I. INTRODUCTION
PVC (Polyvinyl Chloride) resin, a kind of general-purpose plastic, is a resultant from polymerization reaction of vinyl chloride monomer (VCM) [1]. Due to toxicity of vinyl chloride monomer in PVC resin products, the concentration of VCM residual must be properly controlled within a certain range. For this purpose, stripping process is normally developed to strip such harzardous elements. It is also recognized that stripping process is a typical and complex industrial process, along with high nonlinearity and time-varying characteristics. Hence, it is critical to accurately model the stripping process and to manipulate the process with advanced control method, so that good quality of PVC resin, low production cost and satisfactory environmental protection
could be achieved.
On the other hand, PVC stripping process is a multivariable, strong coupling and nonlinear time-varying industry process, while temperature is one of the most important impact factors of stripping efficiency. However, it is difficult to analytically model the temperature variation of the stripping operation[2][3], while few research efforts on this topic have been reported in the literature. It is considered that T-S fuzzy model is essentially a nonlinear methodology, which could approximate any nonlinear system precisely, and is able to identify the process with high modeling accuracy. Meanwhile, as characterized by neural networks and fuzzy logic system, it can well describe the complex dynamic characteristics of the multi-variable system by a few rules. Currently, modeling based on T-S fuzzy system has been successfully applied to real industries, such as thermal process of gas temperature[4], distributed coke oven gas collector pressure[5] and system sizing reactor temperature[6].
Therefore, this paper will study temperature modeling method of PVC stripper based on T-S fuzzy model, and will present an improved T-S fuzzy model with established novel fuzzy rules for new and nearest neighbor clustering algorithm. Firstly, the importance of stripper temperature modeling is analyzed. Secondly, main input parameters of the system are obtained by analyzing various parameters that affect the stripper temperature. Next, the structure of T-S fuzzy neural network is described, and the fuzzy rules of the improved nearest neighbor clustering algorithm are determined.
Finally simulation results demonstrating feasibility of the proposed modeling method are given.
II.PROBLEM FORMULATION Manuscript received June 11, 2013; revised June28, 2013;
Corresponding author:Gao Xianwen
As discussed, RMNs are extended from Markov networks to the relational setting. We review Markov networks first, and then RMNs. The definitions and equations mentioned in this section are mainly taken from. The theoretical and practical basis established by Berens for describing the VCM diffusion through a PVC matrix in suspension and emulsion resins successfully treats desorption phenomena at low VCM concentrations as a diffusive fickean process associated with the resin grain primary particles diameter. Desorption kinetics follow a Fickean model:
(
eq)
dC
k C
C
dt
= −
−
(1)Where k is the desorption constant,
h
−1, C is the average VCM concentration in the resin, weight fraction,eq
C
is C for resin at equilibrium with VCM existing the gas phase outside the resin particles.Berens found that the diffusivity of VCM in PVC is a function of temperature following an Arrhenius-like relationship and is independent of molecular weight at least in the commercial resin range. The desorption constant can be calculated from Berens data and primary particle diameter measurements, and follows the same kind of relationship to temperature.
0 ( )
a
E RT
k
=
k e
− (2) WhereE
a is the activation energy, cal/mol, R is ideal gas constant, cal/mol K, T is the temperature, C°.The column trays are considered as perfectly mixed tanks and no effect of residence time distribution is taken in account so the tray-to-tray VCM in resin concentration changes are given by
i 1 eqi ( ktr)
i eqi
C
C
e
C
C
+
−
=
−−
(3)
2
4
A L R
F h
D
t
Q
π
=
(4)Where
t
R is the residence time, h, D is column diameter, m,F
A is the fraction of the column section not occupied by downcomer, hL is liquid height on tray, m, Q is the tray volumetric liquid/solid feed,m
3/
h
.It is known that exposure to high temperatures, especially above 100°C, causes coloring of the resin due to polymer degradation with HCl evolution. This is a major difficulty in removing VCM from PVC as high color is quality non-conformity. Arlman (1954) presented a correlation for HCl evolution from PVC in the absence of oxygen.
HCL n
b
E
M
=
(5)Where
E
HCL is HCl evolution rate, μmol HCl / gPVC-h,b
= ×
7 10
5 μmol HCl / gPVC-h (at 182°C),M
n = PVC molecular weightArlman found for this process an activation energy of 138 KJ/mol, so
E
HCL can be put as a function of temperature and polymer molecular weight:0
exp(
a)
HCL n
k
E
E
M
RT
−
=
(6)Here
k
0=
1
×
10
10μmol HCl / gPVC-h,E
a = 33 000 cal/mol.Associating the HCl evolution to resin damage, a convenient multiple of the amount of HCl evolved during stripping can be used as damage index for comparison between different operations modes. Moreover, based on previous analysis, it can be seen that temperature plays a key role in stripping process, because it affects both VCM desorption and resin damage. Therefore, proper temperature control is becoming crucial for PVC stripping, and an accurate modeling of stripping process is desired.
III.T-SFNN-BASED MODELING
A. Data Preprocessing
During the process of PVC stripping, due to the accuracy of measurement instruments, methods employed and human factors, various errors can not be avoided, which will affect process modeling and control quality. In this paper, gross error detection, measurement error test, filtering and other methods are used in data preprocessing of process variables. Then, normalized method is adopted to eliminate the different magnitude of the model structure and parameters in the process variable data, as follows:
min
max min
jio j ji
j j
a a
a
a a
− =
− , (7)
Among them
a
ji ,a
jio ,a
jmax , ajmin are for normalized value, actual value, maximum value, minimum value of each group respectively. The method guarantees the data are between [0, 1].B. Structure of T-S fuzzy Neural Network
The method of T-S fuzzy modeling has received increasing attention in recent years [7]-[9]. Takagi and Sugeno proposed a T-S model in 1985, called the Sugeno fuzzy model. The post-condition of fuzzy rules is a linear combination of input variables. Without loss of generality, multi-input and multi-output system can be viewed as several multi-input and single-output MISO [10].
Set input vector , ,
1 2
T X ⎡⎢x x xr⎤⎥
⎣ ⎦
= " , every component of
x
iis a fuzzy linguistic variable, and variable value of their language is:
( )
{ ,1 2, , mi}i i i i
( 1,2,3 , )
j
i i
A j= "m is the j linguistic variable value of
i
x
. It is defined as a fuzzy set on the domain of Ux. Thecorresponding membership function is ( )( 1,2, , ; 1,2,3 , )
j
i i i
A x i r j m
μ = " = " .
In the T-S model, the form of j fuzzy rule is as follows:
1 1 2 2
j, j, , j
r r
IF x is A x is A "x is A
0 1 1
j j j j
r r
THEN y =p +p x +"p x
1
( 1,2 , ; m i)
i
j m m m
=
= " =
∏
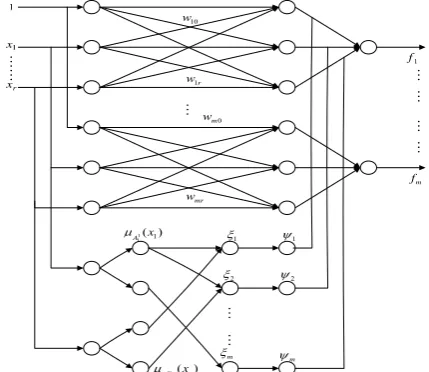
(9)According to Takagi-Sugeno fuzzy inference characteristics, it can be combined with a neural network for the construction of adaptive learning ability of neuro-fuzzy system[11-12]. Fig. 1 is built by the former pieces and back pieces of the network, and the former pieces of the network are used to match the antecedent of fuzzy rules, while the later is used to generate fuzzy rules.
(1)The antecedent network
The antecedent network consists of four layers; the first layer is the input layer, and its role is to transmit the input values to the next layer. The node number isN1=r.
Each node of the second layer represents a linguistic variable, and its role is to calculate the components of the input membership function.
Each node of the third layer represents a fuzzy rule, and its role is to match the antecedent of fuzzy rules to calculate the fitness of each rule.
# # # # # # # # # 1 ψ 2 ψ m ψ 1 ξ 2 ξ m ξ ( ) mr r r A x μ 1 1( )1
A x μ 10 w mr w 0 m w m f 1 f 1r w
Figure 1 Structure diagram of T-S fuzzy neural network
The node number of the forth layer is the same as that of the third layer, and is for normalization, that is
(
)
(
)
2 2 1 2 2 1 1 1 exp 2 exp 2 r i ij i ij l l m m r i ij k kk i ij
x c x c σ ξ ξ σ = = = = ⎡ − ⎤ ⎢− ⎥ ⎢ ⎥ ⎣ ⎦ Ψ = = ⎡ − ⎤ ⎢− ⎥ ⎢ ⎥ ⎣ ⎦
∑
∑
∑
∑
(10)(2) The back network
The fifth layer is fuzzy decision-makingfl=Wl∗ Ψl,Wl=wl0+w xl1 1+"w xl r r, l=1,2"m.
The sixth floor is defuzzification layer. The number of its nodes corresponds to number of output variables.
C. Determination of Rules
The nearest neighbor clustering method is used to determine the rules in this paper. Firstly, the first data is taken as the first group of cluster center. Second, if the distance of a data from the cluster center is less than a preset value, then put the data into this group. In other words, the group of cluster centers and this data should be the closest. Otherwise, put it to a new group of cluster centers [13].
A modification is carried out based on this clustering algorithm. Each cluster center is compared with each other. When the distance between two clustering centers is less than the expected value, these two clustering centers are merged into one. So the clustering center is set up the average value and clustering number is equal to the original number minus one.
With the nearest neighbor clustering, steps to design the fuzzy system are listed as follows:
Step1: Select an appropriate width r of Gaussian function, define vector A l( ) for storing the sum of all output vectors, and counter B l( ) for statistics number of various sample types, where l is the number of categories. Step2: From an input-output data
(
x
10,
y
10)
, setx
10 as a cluster centerx
10, makeC
1=
x
10,A
(1)
=
y
10,B
(1) 1
=
, set the radiusr
.Step3: Considering the second sample data
(
x
02,
y
02)
, calculate|
x
02- |
c
1 the distance fromx
02 to the cluster centerC
1 . If|
x
02- |
c
1≤
r
, thenC
1 is the nearest neighbor clustering ofx
02 , setA
(1)
=
y
01+
y
02 ,(1) 2
B
=
; If|
x
02−
C
1|
>
r
, then takex
02 as a new cluster center, setC
2=
x
02,A
(2)
=
y
02,B
(2) 1
=
.Step4: Suppose k pairs of input-output data
(
0k 0k)
x
,
y
, (k=2, 3,…) , and the existing cluster centers are1 0
x
,x
02,…, the M clusters of the 0Mx
.The distance from 0k
x
to the M clusters centers|
0k-
0l|
x
x
,1, 2,3 ,
l
=
"
M
is calculated. Set the smallest distance is|
x
0k-
x
0lk|
,(
)
k
l
∈
l
, that meansx
0lk is the nearestneighbor clustering of 0k
x
. If|
x
0k-
x
0lk|
>
r
, then take0
k
x
as a new cluster center,set 1 0k
M
C
+=
x
,M =M +1,( )
0kA M
=
y
,B M
( ) 1
=
;If
|
x
0k-
x
0lk|
≤
r
, then0
( )
( )
kA j
=
A
j
+
y
,B j
( )
=
B j
( ) 1
+
.means the distance between
C
iandC
j is small enough, and they are close in width also. Then mergeC
iandC
j, get2
i j
C
C
C
=
+
, numbers of cluster center minus 1. Step6: 0kx
do not create a new cluster, then according to k pairs of input-output data(
0j 0j)
x
,
y
(j = 1, 2 ..., k), the fuzzy system is designed as follows:2 0 1 2 0 1 | |
( ) exp( )
( )
| |
( ) exp( )
l M
i
k M l
i x x A k f x x x B k σ σ = = − − = − −
∑
∑
(11)If a new cluster is created, then it has the fuzzy system:
2 1 0 1 2 1 0 1 | |
( ) exp( )
( )
| |
( ) exp( )
l M
i
k M l
i x x A k f x x x B k σ σ + = + = − − = − −
∑
∑
(12)Step7: Set k=k+1, then back to step 4.
D. Hybrid Learning Algorithm
This study is based on T-S fuzzy neural network, and introduces Gaussian function as fuzzy membership function. The parameters to be identified of the Gaussian membership function are the central value, width value and the link weight function coefficients of the Gaussian membership function. The first two parameters are the premise parameters of fuzzy rules, which are non-linear parameters. The weight function coefficients corresponding to the conclusion of fuzzy inference rules are linear parameters. According to the study of the structural characteristics of the fuzzy neural network, a hybrid learning algorithm could be proposed. The conjugate gradient algorithm can be used for the non-linear Layer parameters. While recursive least squares algorithm is used for the linear parameters, which significantly improve the network learning efficiency [14-15].
The calculation steps with conjugate gradient algorithm to optimize the parameters are as follows:
(1) Set initial point
M
(0) with accuracyε
>
0
,D
is the number of elements of vectorM
;(2) Calculate
g
0= ∇
E M
(
(0))
,k
=
0
; Set( )k
(
K)
k
S
= −
g
= −∇
E M
( ), which is a k-time search direction vector, the gradient directiong
of each parameter ofM
is(
)
li i
ij l ij
E f d y c c ξ ξ ∂ ∂ = − ∂
∂ ∂ ∂ (13)
( ) l
i i
ij l ij
E f
d y ξ
σ ξ σ
∂ ∂ = − ∂
∂ ∂ ∂
(14)
(3)Set the learning rate of the center and width of
M
asη
1,η
2 respectively, orη
=
{
η η
1,
2}
, In order to avoid the inappropriate choice of learning rate causing system instability, this paper adopts an adaptive learningrate method. In the direction of a new vector (k 1)
M
+ is(k 1) ( )k ( )k
M
+=
M
+
η
s
. When0
E
Δ >
,η ηϕ
=
,ϕ
>
1
; When0
E
Δ <
,η ηβ
=
,β
<
1
;ϕ
,β
are constants. The corresponding gradient is 1(
(k 1))
k
g
+= ∇
E M
+(4) If
E
<
ε
, terminate the iteration, otherwise transfer to (5);(5) If
k
< −
D
1
, calculate conjugate direction.( 1) 1 2 ( )
1 2
k k k
k
k
g
s g s
g
+ +
+
= − + (15)
Set
k
= +
k
1
, back to (3); ifk
= −
D
1
, set0 D
M
( )=
M
( ),back to (2).Conclusive parameters, which are the connection weights, are calculated with recursive least squares method.
Specific steps of hybrid learning algorithm are:
(1) Set the initial value:
k
=
0
, set the precision of errorε
>
0
and the initial learning rateη
etc.;(2) For the sample input
p
, via the network prior transmission consequent parametersW
can be obtained by the least squares method, and then the corresponding network output could be obtained, then find out errorE
;(3)Through back-propagation of error
E
, the gradient vector of the parametersc
ij andσ
ij, setk
= +
k
1
;(4) Calculating the value of
c
ij andσ
ij with the conjugate gradient method;(5)The next moment of error
E
could be obtained by prior dissemination based on revised parameter;(6) If
E
reaches the error accuracy, at this timeC
,σ
andW
are the final values, learning terminates; otherwise, repeat step (2) to (6) until it meets the ending conditions.IV.SIMULATION
The structure of stripper temperature fuzzy neural network modeling method is shown in fig. 2.
Stripper
Fuzzy Neural Network
u1(k) y(k)
e(k)
ym(k)
+
-z-1
u2(k)
z-1
Figure 2 Modeling sketch of stripper temperature based on fuzzy neural network
stripper top;
y
mis output value of fuzzy neural network model; z-1 is the delay factor; k is the sampling time.First, a dynamic model of stripper temperature can be built based on 100 groups of data collected from the site, and Fig. 3 shows the modeling results of stripper temperature, compared with that with BP, as showed in Fig. 4.
Figure 3 Modeling of stripper temperature based on FNN
Figure 4 Modeling of stripper temperature based on FNN
Figure 5 The modeling error
Fig. 5 show the modeling errors with both methods, and it can be seen that the variation with FNN is within the range of -0.2-0.2, which is much less than that with BP modeling method, mostly between -0.8—0.8. It
means that accurate stripper temperature model could be obtained with a hybrid learning algorithm of fuzzy neural network. Comparison of performance of BP model error and FNN model error is showed in Tab.Ⅰ.
TABLE I.
COMPARISON OF BP AND FNN MODEL ERROR
BP model error FNN model error min -0.76429 -0.376 max 1.085714 0.344
varriance 0.083195 0.019344
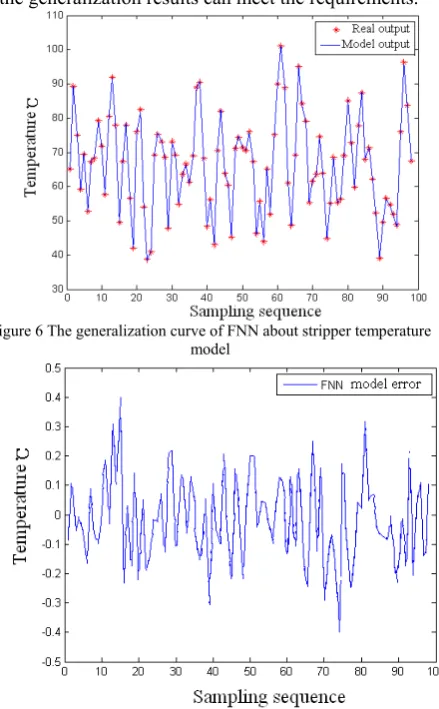
The generalization test results of another 100 sets of data are shown in Fig. 6, and generalization error curve is shown in Fig. 7. Clearly, this fuzzy neural network used in the generalization results can meet the requirements.
Figure 6 The generalization curve of FNN about stripper temperature model
Figure 7 The generalization error curve of the model based on FNN
V. CONCLUSION
approximation accuracy of stripper temperature control system could be obtained with the method based on the T-S fuzzy neural network.
REFERENCES
[1] Hui Zheng-gang,The application of stripping technology in the production of PVC[J], Polyvinyl Chloride, Chemical Industry Press, Huludao, 2007,7(2):8-12. [2] Azeem, MF; Ahmad, N; Hanmandlu, M. Fuzzy modeling
of fluidized catalytic cracking unit [J], Fuzzy modeling of fluidized catalytic cracking unit 2007, 7(1): 298-324. [3] Chang, H; Hou, WC. Optimization of membrane gas
separation systems using genetic algorithm [J]. CHEMICAL ENGINEERING SCIENC, 2006, E (16). 5355-5368.
[4] Guo Ying, Lv Jian-hong, Wu Bo,e.t. Fuzzy modeling Based on TS model and Its Application for Thermal Process[J], Journal of System Simulation,2010,22(1):210-215.
[5] Qin Bin,Wu min,Wang xin,Yang Chun Hua,MAS-based distributed decoupling control for the pressure of gas collectors of coke[J], Control Theory & Applications,2006,23(2):961-966.
[6] Tan Yu-ling ,Chen Yuan, Intell igent Control Based on TS Model to the Temperature for Adhesive Preparation Processing[J], Computer Measurement & Control ,2010,18(2):351-353.
[7] He PL, Hou YX. An asymmetric robust learning algorithm of fuzzy clustering neural networks. Journal of Computer Research and Development, 2001, 38(3):296−301. [8] Mastorocostas, PA; Hilas, CS. A block-diagonal recurrent
fuzzy neural network for system identification [J]. NEURAL COMPUTING & APPLICATIONS, 2009, 18 (7): 707-717.
[9] Hong, YST; White, PA. Hydrological modeling using a dynamic neuro-fuzzy system with on-line and local learning algorithm [J], ADVANCES IN WATER RESOURCES, 2009, 32(1): 110-119.
[10]Li Guo-yong, Intelligent Control and MATLAB Implementation [M], Beijing:Electronics Industry Press, 2005,132-140.
[11]Yuan Yu-Hao, Zhang Guang-Ming, Research on T-Fuzzy Descriptor Systems:A review[J], ACTA AUTOMATICA SINICA, 2010, 36(7): 901-911.
[12]Ding Hai-Shan, Mao Jian-Qin, Lin Yan, Indirect Adaptive Fuzzy Control Based on Fuzzy Tree Model [J],ACTA AUTOMATICA SINICA, 2008, 34(6): 676-683.
[13]Shen HB, Wang ST, Wu XJ. Fuzzy kernel clustering with outliers. Journal of Software, 2004, 15(7):1021−1029. [14]Wang Xue-miao, Fuzzy Neural Network Optimization and
Its Application [D], Da Lian, 2007.
[15]Wang Hong-yuan and Shi Guo-dong, Artificial Neural Network Technology and its application[M], Beijing: China Petrochemical Press , 2002,97-106.
Shuzhi Gao received BSc degree from
Shenyang University of Chemical Technology in 1989 and M. Sc. degree from Northeastern University in 2012. She is currently a professor in Shenyang University of Chemical Technology and PhD supervisor. Her main research interest is modeling of complex industry process and intelligent control.
E-mail; [email protected]
Yihao Zhang received BSc degree from
Henan University in 2010.He is a graduate in Shenyang University of Chemical Technology from 2011. His main research interest is modeling of complex industry process and intelligent control.
E-mail;[email protected]
Xianwen Gao received BSc degree from Shenyang University of Chemical Technology in 1978 and M. Sc. degree from Northeastern University in 1993. In 1998, he received PhD degree in control theory and control engineering from Northeastern University. He is currently a professor in Northeastern University. His main research interests are modeling of complex industry process and
intelligent control, etc.