Modeling and Decision Support for Analysis of
Operator Errors in Complex Systems
Alexander M. Yemelyanov
Georgia Southwestern State University, Americus, GA, USA Email: [email protected]
Abstract— A method of modeling human operator performance in complex systems, which is realized as a DSS, is presented. It allows to conduct a detailed analysis of an operator’s performance to observe the nature of his errors in the different stages of his control action: perception of a problem, motivation for solving it, the evaluation of variants of a solution; then, making a decision, and its implementation. The method provides a deeper analysis of underlying factors using the proposed frame descriptions for errors with logical, decision-making, and classification algorithms, as well as the results of psychological experiments. The specific feature of the suggested approach is that it presents the opportunity to logically analyze errors and their underlying factors in the process of collecting data on them, not by drawing conclusions from the investigation reports as the traditional approach. The advantages of using the decision support systems for working with large amounts of unstructured data, specifically in the process of identifying repeated errors and error-provoking situations, are demonstrated.
Index Terms — operator performance, error, modeling, algorithm for analysis, decision support
I. INTRODUCTION
Human errors are an essential part of any human performance. They are most explored for human-operator activity in complex systems such as aviation, nuclear power, military and hospital systems, etc., where they are associated with severe consequences. Their analysis requires going beyond the limits of an operator’s error to the different facets of a situation to understand the underlying factors which led to the error. For the decision errors, which contribute to more than 60% of all accidents where crew behavior is a causal factor [1], need to be analyzed complex personal and social factors related to conflicts of motives and goals which are hard to recognize and finally treat. In human reliability analysis, these factors are called performance shaping factors, which are outside the operator’s immediate control and indirectly influence system safety [2].
To provide a better understanding on what human factors should be considered within the process of error analysis, Reason [3] stated that failures fall into two main categories: active and latent errors. Active errors are errors that directly lead to accidents and are committed by those who are in direct contact with a system (located at the “sharp end” of the system). Latent errors (more
recently [4]) referred to as latent conditions) are errors which are characterized by circumstances such as poor communication, inadequate training, or interface design, and are located at the “blunt end” of a system and result in an active error. Reason’s model has had by far the greatest impact both on theory and practice. This model has been formally adopted by ICAO and recommended for use in the investigation of human factors in aircraft accidents and incidents [5].
Based largely on the work of Reason [4], Rasmussen [6], Hollnagel [7], and others, different error taxonomies and error classification schemes were constructed [8]– [10]: HFACS, TRASER, ICAM, etc. For example, in the aviation domain, Shappell and Wiegmann [11], [12] proposed a taxonomy – Human Factors Analysis and Classification System (HFACS) – to apply to the investigations of human errors in aircraft accidents. Specifically, HFACS describes four levels of failure, each of which corresponds to one of four layers contained within Reason’s model: unsafe acts, which present active errors, and preconditions for unsafe acts, unsafe supervision, and organizational influence, which present latent conditions. Each of these components has been classified by its own taxonomy. For example, preconditions for unsafe acts include physical and technological environmental factors, personal factors (crew recourse management and personal readiness), and different conditions of operations (adverse mental and psychological states, physical and mental limitations); unsafe acts include two categories of errors (failures): errors (skill-based, decision, perceptual) and violations (routine, exceptional).
directly linked to nearly 80 % of all aviation accidents [12].
The sources of information for these types of taxonomies are mostly safety (accident) reports. For example, the system HFACS used over 300 naval-aviation accidents reports from US Naval Safety Center [12]. At the same time, according to ICAO, in aviation, accident reports regularly contain not “really causes on which safety recommendations can be made (“why” accident occurred), but rather, merely brief descriptions of the accident’ (“what caused it) [5].
So, while the System HFACS successfully classifies the existing causal factors contained within NTSB and other accident reports [12], it is fairly limited in the field during an actual accident investigation.
The model for operator performance, which will be described below, includes characteristics for both active errors and latent conditions and, along with the existing taxonomies, facilitates the determining of those causes on which safety recommendations can be made. This model will be presented without those details that are non-essential for understanding its main idea.
II. OPERATOR PERFORMANCE MODEL
A. Suggested Approach
Human operator error is considered here as the commission or omission of human action that lead the controllable parameters of the system outside of its acceptable limits or is prohibited by rules of the system [15], [16]. This is one of the most general definitions for an error, which is not necessarily associated with guilt, consequences of the error, or the presence or absence of intention, and which is very close to Reason’s “unsafe act” [3]. It will not be discussed here, because the model below considered for error description could be just as successfully applied to each of the existing definitions of an error (see, for example, [17] for the detailed overview of these definitions).
The suggested approach contains the features of six major approaches for human behavior modeling and error analysis in accident causation: cognitive (e.g. [6] – information processing stages), ergonomic (e.g. [18] – interaction between individuals, their tools and machines, and work environment), behavioral (e.g. [19] – performance to obtain rewards and avoid unpleasant consequences or punishments), social psychological (e.g. [20] – interactions among group members), medical (e.g. [21] – mental and physiological conditions), and organizational (e.g. [22] – risks and conflicts in flight operations) [12].
The modeling language for operator performance is similar to a unified modeling language which is widely used in general-purpose visual modeling/software engineering [23]. It includes the following building blocks [14]:
1. Three types of diagrams: action diagram, which shows the stages of operator performance arranged in a time sequence; inception diagram, which shows the basic
schematic behavior of a control system and can be extended or displayed in details; and an elaboration diagram, which is built by adjusting the inception diagram to an actual operator’s performance: pilot, controller, etc.
2. Relationships: interaction, aggregation, realization, evaluation, etc.
3. Specifications for relationships (provide cognitive backplane of the model): extent and likelihood of a deviation, operator’s intent to prevent the deviation, operator’s obligation to predict the deviation, operator’s ability to predict the deviation, operator’s awareness of his abilities and obligations.
4. Classifiers for different types of errors, violations, risk behavior, working conditions, information supplying, etc.
An action diagram provides the description of an operator‘s performance (his control action) and includes the stages of: perception of a problem, motivation for solving it, evaluation of variants of a solution, making a decision, its implementation, and obtained results [24]. An inception diagram presents each of the listed stages as a frame description while the entire operator’s performance is presented as a sequence of these descriptions.
B. Frame of Operator Performance
According to James [25], the operator’s personality can be presented by the following facets – “The material self” (Iph), “The spiritual self” (Isp), and “The social self”
(Isc), which are all capable of regulating and guiding individual behavior [26] and are driven through interactions with the external environment, especially with other people [27]. The external environment for the operator, according to [15], includes: E – the controlled object; C – means of control; N – material environment for operator, the controlled object and means of control;
P– operator’s close social environment; and, S – remote higher social environment.
All of these components with corresponding interactions (influences) present a frame – a basic cognitive structure that guides the perception and representation of the operator’s performance [28], [29].
The specified substructures (slots) of the frame are represented in Fig. 1 by circles. The figure also displays mutual interactions between the frame substructures which appear in the operator’s performance and are marked by arrows.
As shown in Fig. 1, operator I implements his decision by affecting a controllable objectE, either directly or by means of control C. The diagram also shows the reverse effects of the external substructures at the operator and their mutual interactions. Depending on the type of control actions, this description may be extended, added, and some external substructures may be displayed in detail as a sequence of smaller substructures.
). , ( ), , ( ), , ( ), , ( ), , ( }, , ( ), , ( ), , ( ), , ( ), , ( ), , ( ), , ( ), , ( ), , ( ), , {( 2 sp ph ph sp sp ph I P I P E P C P I N E N C N I E P E N E C E I C I C P C N C W
Figure 1. Frame of operator performance (control action)
I – operator (Iph– “The material self”, Isp– “The spiritual self”,
sc
I – “The social self”); E – the controlled object; C– means of control; N– material environment for the operator, the controlled object and means of control; P – operator’s close social environment; S– remote higher social environment
These interactions are subdivided into three groups.
The groupW1 includes the operator’s impact on the controllable object:
The group W2 includes effects which determine the state of the controllable system in the given external conditions:
The group W3 includes effects which give the social
evaluation of the erroneous performance:
As norms are essential grounds for the functioning of control systems, the degree of interaction for the first and second groups are expressed in their deviations (“negative” interactions) from the established norms. The degree for social evaluation in the third group of interactions is expressed by their absolute values (“negative” or “positive”).
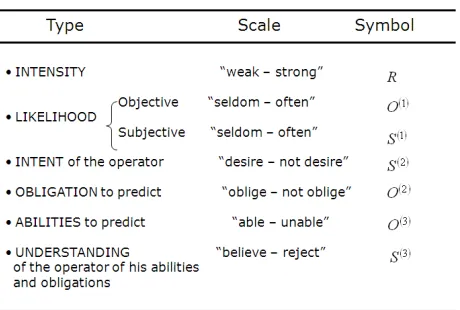
The deviations and absolute values are determined on a fuzzy scale of intensity (“weak” – “strong”). With both resulting and expected effects, the negatives are expressed with a dotted line, and the positives are expressed with a straight line (Fig. 2). The expected effects are presented with different, possible outcomes of an action, while the resulting effects are expressed with one, forward-pointing line that displays the actual outcome.
Besides the intensity of effects, the frame descriptions also contain a number of other parameters. These parameters characterize the likelihood for the occurrence of various effects and the operator’s estimates regarding these likelihood (“seldom” – “often”); his/her intent to avoid undesirable negative consequences (“desire” – “no desire”) as well as obligations (”oblige” – “not oblige”) and abilities (“able” – “unable”) to predict those; and the
Figure 2. Types of interactions
operator’s awareness of his abilities and obligations (“believe” – “reject”). The list of the parameters is presented in Table 1.
TABLE I.
CHARACTERISTICS OF INTERACTIONS
The description of an operator’s performance, as mentioned above, includes the following stages: perception of a problem, motivation for solving it, the evaluation of variants of a solution; then making a decision, its implementation, and the obtained results. We assume that the first five stages (from perception of a problem to decision implementation) are all occurring at the same momentt0, while the last stage – the obtained results, is occurring at t0't ('t period of time later).
Each of the listed stages is described as a frame, while the frame F(A) of the entire actionAis presented as a set of the frame descriptions:
]} [ ], [ ], [ ], [ ], [ ], [ { )
(A F W2 F W2 F W F W F W1 F W
F p m v d i r ,
where W1,W2,W3,and W W1W2W3 are included
groups of interactions. Fig. 3 illustrates the stages of the operator performance along with the corresponding frames and their characteristics.
C. Logical Model and Classifiers
C1. Logic MS. To provide logical completeness of each frame description, verify the logical consistence of all the frames integrated into the action diagram, and to
classify them, the special mathematical apparatus is constructed. )}. , ( ), , ( ), , {(
1 I E I C C E W )}. , ( ), , ( ), , {(
3 S Iph S Isc U Isp
Figure 3. Stages of operator performance
This apparatus includes many sorted modal logic MS, which helps to describe and analyze different types of modalities in the frame description: action, opportunity, intensity, optative, deontic, and epistemic [30].
Seven logical theorems, which were proven in logic
MS, were implemented in the analysis of an operator’s
action. Three of them are presented below as examples.
The theorem T5 states: “if the operator at the moment
0
t performs (D2 ) some action Aj and at the same time
believes (V2), that with necessity (L4– always), this action causes the positive (D ) or negative (D ) consequences PD(w) with the direction
w
and theintensity level Rk, then the operator desires (G2) these
consequences”. More naturally, this theorem can be interpreted: “if an alternative was taken, the unavoidable and visible consequence was judged to be acceptable by the operator”.
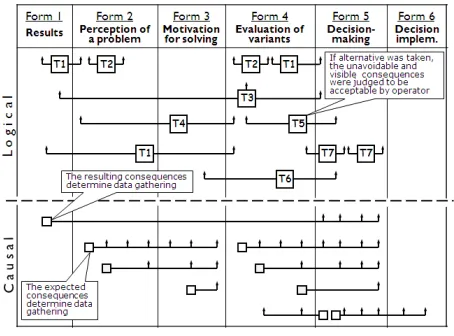
The theorems T1 and T3 can be accordingly interpreted as: “the realized consequence of the action should be considered as one possible outcome” and “the choice of an alternative which will lead to an unavoidable consequence leads to this consequence in the end”. Fig. 4 shows how the theorems actually work in the process of gathering data about different stages of a control action. For example, the theorem T5 provides logical relations between data about variants of a solution (Form 4) and data about decision-making (Form 5). Fig. 4 also shows the causal relations – another type of relations that exists between different data describing the action. These causal relations show how the most expected consequences, that did not happen and those that really happened determine the data gathering in all six stages of analysis of an action.
C2. Logical Classifiers. Aframe F(Ai) of an action
i
A is considered as a well-formed formula in MS. In [30], it was proven that there exists an effective algorithm that, for every action, constructs its frame.
Figure 4. Logical and causal relations
The classification of an action rests upon the analysis of its frame. The underlying principle of this classification is in checking the presence and nature of certain characteristics in the frame of the action.
The classifiers are constructed using the elementary classifiers, which take into account the basic features of the action, based on algebraic operations of union, intersection, and complement.
The classification of action Ai is defined as a procedure for determining whether the formula
j i Kc A
F( )o is inferable in logic MS, where
j c
K is the
classifier of
c
j-type actions. The existence of a decisionprocedure in MS for such formulas was proven in [30]. Thus, attributing the action to a certain type requires the construction of its frame followed by the application of the classifying procedure.
The language of this logic turned out to be very productive in the description of operator actions and the classification of many vague types of an operator’s behavior, such as risky, intentional, negligent, overconfident, etc.
For example, the classifier for overconfidence
(“excessive confidence or too great reliance or trust” – Webster’s Dictionary) can be specified, by three elementary classifiers and operations of intersection ( ) and complement ( ), as
– operator executed (“was acting”) the decision ( ), did not anticipate (“reject”) consequences of this decision ( ) , and was aware (“believed”) that he had (“was obliged”) to predict (“believe”) these consequences (awareness of one’s obligation to predict them) ( ).
C3. Experimental Classifiers. To provide a complete
analysis of all interactions in the frame description through the vision of their preferences to the operator and the decision which he finally made, besides the logical classifiers, the experimental classifiers were created. These classifiers can measure the levels of attractiveness
&
]
&
&
[
C
1,JC
4w,k,,jC
5,k,jK
DJ
C
1,D , , , 4 w j k C j k
C5,,
of emotion-affected events, presented in the frame as effects of different interactions with their characteristics of intensity and likelihood. In other words, they are presented to answer questions such as: “Whether the risk of getting injured was more significant or less significant to the pilot (at the moment of decision-making) than the risk of not performing the task and therefore losing the respect of his colleagues”.
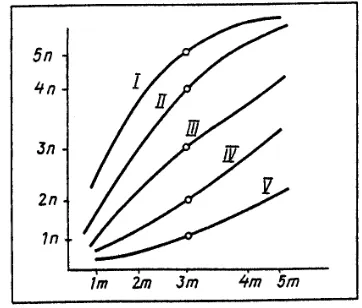
The experimental classifiers were determined by experimental studies [31]. According to these studies, the emotional reaction of the human operator to the negative and positive effects is completely characterized respectively by two indices: significance-as-anxiety and significance-as-value. Each of them in turn is formed on the basis of two primary factors: the intensity of an effect and the likelihood of its realization. To determine the functional relationships between significance-as-anxiety or significance-as-value of the effects and those factors, which characterize them, the special psychological experiments were carried out. The obtained curves were proved to be identical for the effects of different nature (anxiety or value) and are depicted in Fig. 5.
If we now return to the discussed example with the pilot and assume that the risk of getting injured was evaluated by him as a pair (“often”, “weak”), i.e.
) ,
(L3 R1 and the risk of losing the respect of colleagues
as a pair (“not seldom-not often”, “strong”), i.e. )
,
(L2 R3 , then based on Fig 5, it will be possible to
conclude that the significance f of physical hazard (level “middle”) is less than the significance of the social one (level between “middle” and “high”):
In conducting the comprehensive analysis of frame descriptions it will be also necessary to use the procedure that makes it possible to compare the effects, in which the
operator simultaneously perceives both the anxiety and value, i.e., in which both negative and positive components are simultaneously presented. The solution of this problem was obtained by means of another psychological experiment, whose results are presented in Fig. 6.
Based on these results, it is possible, for example, to conclude that the interaction, whose negative component is characterized by a pair (“often”, “weak”), and whose positive one is characterized by pair (“not seldom- not often”, “strong”), has the level of significance between the average and the high.
III. ALGORITHMS FOR ERROR ANALYSIS
To provide the comprehensive analysis of the operator’s performance, the different types of algorithms were developed: elementary algorithms for the analysis of the particular interactions in the frame description; more general algorithms for the analysis of the single
stages of a performance; and the general algorithm,
serving the purpose of analysis of the performance as a whole.
A. Elementary Algorithms
Elementary algorithms are represented in the form of logic trees and provide the analysis of interactions with the specific sign and intensity.
Examples below demonstrate the elementary algorithm
A
(2)w,D,k,j, for determining the type of anoperator’s responsibility for the different outcomes of his erroneous action, and the related elementary algorithm
k w
A
(3) ,D, , that is used for searching the underlyingcauses.
Figure 5. Levels of meaningfulness of emotional events as a function of their intensity (x-axis, horizontal) and likelihood (y-axis, vertical)
I – very high, II – high, III – middle, IV – low, V – very low; 1a – extremely weak, 2a – very weak, 3a – weak, 4a – not weak-not strong, 5a – strong, 6a – very strong, 7a – extremely strong; 1b – extremely seldom, 2b – very seldom, 3b – seldom, 4b – not seldom-not often, 5b – often, 6b – very often, 7b – extremely often, 8b - always
)]. , [( )] ,
[(L3 R1 f L2 R3
f
Figure 6. Levels of attractiveness of emotional events as a function of their significance-as-anxiety (x-axis) and significance-as-value (y-axis)
Algorithm
A
(2)w,D,k, which is used for the analysis ofthe decision-making stage, for every negative (D ) or positive (D ) interaction w
W, with the intensity k
{ weak, not weak-not strong, strong, very strong}determines if the operator caused this interaction (consequence) intentionally, with overconfidence , or with negligence; or that it happened due to some other underlying factors (Fig. 7).
Figure 7. Elementary algorithm A(2)w,D,k,j
The diagram in Fig. 7 shows that the error with indirect intention is a specific type of error when the operator makes a decision, anticipates its consequences, but has no intention to avoid them. It may occur, for example, in a situation where the operator recognizes the risk of a more severe consequence for his action and tries to avoid it first. In other words, the operator follows a principle of choosing “the less of two evils”.
If the operator did not anticipate the consequence of his action, it can be either his responsibility or can be caused by some underlying factors. The operator’s responsibility is presented in the form of overconfidence, when the operator was aware of his obligation to anticipate the consequence; or in the form of negligence, when the operator was not aware, but was obliged and able to predict this consequence. However, if the operator anticipated the consequence and decided to avoid it, his responsibility can be determined by further analysis of the implementation of this action.
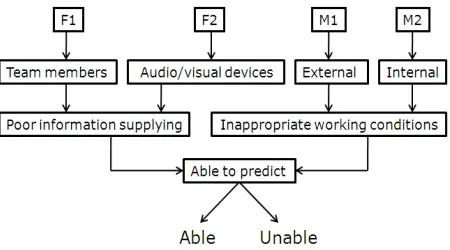
If the operator was not obliged and/or able to predict the consequence, the operator’s error can be caused by some underlying factors. The elementary algorithm
k w
A
(3) ,D, (Fig. 8) examines the existing underlyingfactors to determine if the operator was able to predict the negative consequences (deviations). The underlying factors are comprised of the poor information supplying, provided by team members (factor F1) and audio/video
devices (factor F2), and inappropriate working
conditions, consisting of external conditions – factor M1 (load, climatic conditions, ergonomic factors, etc.) and internal conditions – factor M2 (training, operator conditions: fatigue, hypoxia, medical illness, etc.).
Algorithm
A
(3)w,D,k classifies these four factors (F1,F2, M1, M2) into two categories: “able” and “unable”. This algorithm, specifying the active error, provides the appropriate links to underlying causes (latent
Figure 8. Elementary algorithm A(3)w,D,k,j
conditions), and thereby coordinates with the existing human factors taxonomies and classification systems, particularly with HFACS.
B. Algorithms for Stages of a Performance
These algorithms, using elementary algorithms, for every stage of a performance, analyze all its interactions in the context of their direction, sign and intensity. Stage 1 (perception of a problem). Algorithm A(p)for each deviation PD(w)W2, verifies if its subjective significance corresponds to the objective and, if not, determines, by examining underlying factors, whether the operator had the appropriate information- supplying and working conditions to provide an adequate perception of this deviation.
Stage 2 (motivation for solving). Algorithm A(m)for each deviationPD(w)W2, anticipated by the operator, determines if the operator was motivated to avoid this deviation and, if not, determines whether the operator had the appropriate working conditions to have the proper motivation.
Stage 3 (evaluation of the variants of a solution).
Algorithm A(v) works in the same way as
algorithmA(p), and for all possible
interactionsPD(w)W1W2W3, evaluates two critical solutions for the existing problem: the solution which the operator realized, and the solution which was the best (it can be determined either by experts or by an imbedded decision making algorithm).
Stage 4 (making a decision). Algorithm A(d) analyzes all interactions PD(w)W1W2W3, to determine what types of responsibility the operator performed toward two consequences (intensities) of his action: resulting (which finally happened), and that which did not happen, but which was the most significant out of all the consequences.
Stage 6 (obtained results). Algorithm A(r)for each interaction PD(w)W1W2W3, determines the resulting and the most significant intensities.
C. General Algorithm for Analysis
The general algorithm provides the analysis of the control action as a whole (Fig. 9). It starts from the stage of obtained results (algorithm A(r)) and sequentially analyzes all stages from the perception of a problem to the decision implementation (algorithmsA(p), A(m),
) (v
A , A(d), and A(i)). The analysis of each stage can contribute to the final conclusion on what the main cause of the operator error and its underlying factors were. The algorithm can stop and make a conclusion at any time when the operator’s error and its causes have already been recognized. It may happen when the perception of the problem was completely inadequate (the operator did not anticipate all expected deviations), when the operator has no motivation to resolve the problem (the operator did not try to avoid any deviations of those that he anticipated), when the operator’s solution was not the best (or at least acceptable), or, when making a decision, the operator intentionally caused the resulting deviation.
Figure 9. General algorithm for analysis
This algorithm can be applied to the errors which led to deviations of controllable parameters(W2), and to the errors that only created preconditions for it, without the occurrence of this deviation.
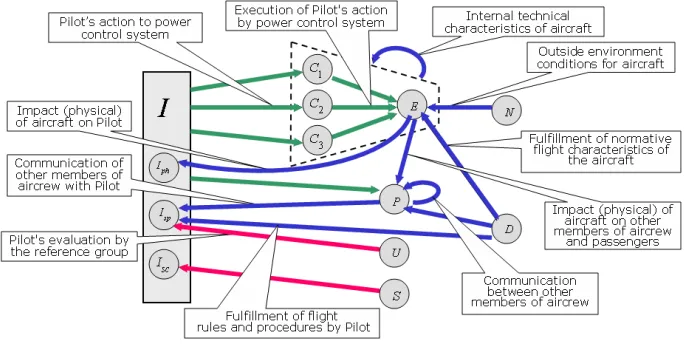
IV. EXAMPLE OF PILOT’SERROR ANALYSIS
Fig. 10 presents the elaboration diagram, which was built by adjusting the general inception diagram to the pilot’s actual performance. As shown in this figure, the pilot ( I) implements his decision via the control systems – (I,C1), (I,C2), and (I,C3), and also via other members
of the aircrew and the passengers – (I,P). The reverse
effect for the pilot is provided by the aircraft and its functional systems – (E,Iph), flight regulation documents
– (D,Isp), other members of the crew and the passengers
– (P,Isp), the reference group – (U,Isp) , and the flight
supervisor – (S,Isc) .
Figure 10. Elaboration diagram for the pilot’s performance (sample schematic for demonstration purposes only)
I– pilot; E – aircraft and its functional systems; C1– flight control system; – power control system; – life support
system; N – outside environment of aircraft (terrain, weather, hazards, etc.); D – flight regulation documents; P – other
members of the aircrew, passengers; U– pilot’s reference group (family, colleagues, etc.); S – flight supervisor (controller)
2
)} , ( ), , ( ), , ( ), , ( ), , ( ), , ( ), , ( ), , ( ), , {( 2 P D I D E D P P I P P E E N CE CE I E W sp sp ph
The aircraft and its control systems –(D,E), as well as
the crew members and the passengers, operate according to flight regulation documents – (D,P) and are exposed
to outside environmental effects (N,E).
All interactions presented in the elaboration diagram for the pilot’s performance are subdivided into three groups:
for the pilot’s control actions (presented by deviations),
for the state of the controllable system (presented by deviations),
– for social assessment (presented by absolute values, “positive” or “negative”).
A. Accident Description
“The captain of a Tu-134 jetliner that was carrying 76 passengers allowed the aircraft to veer off the runway upon landing, which lead to a collision with the landing system lights located near the runway, and resulted in damage to the right landing gear and two ground lights. The landing was conducted at night during instrument meteorological conditions, low ceiling, gusting winds, and low visibility and was complicated further by pouring rain. The accident occurred after the first unsuccessful landing attempt, when the crew was forced to go around. During the first attempt, already in the flare, the aircraft was abruptly blown to the right, off the runway centerline, and a normal landing became impossible. As a result, the captain decided to go around. During the second attempt, conducted in the same, extremely complicated meteorological conditions, the plane flew well past the touchdown zone and, during the flare, it was blown to the right again. The captain did not discontinue the landing, but he was not able to remain close to the runway centerline, either. As a result, the aircraft landed 840 meters beyond the normal landing area onto the right side of the runway, and on the rollout, the right gear came off the pavement into the soil; the aircraft continued to move for another 160 meters, colliding with and breaking off two runway marking lights.”
B. Accident Analysis
Analysis starts with the consideration of the captain’s perception of a control task through the actual implementation of his decision.
During the leveling off at the end of the second approach, the captain had two available solutions:
x a1 – complete the landing (which he opted to do);
x a2– go around and depart for alternate airport with better meteorological conditions (there was enough fuel).
Based upon the elaboration diagram of the pilot's performance, we will conduct a sequential analysis of each frame, which describe the specific aspect of this performance. Due to the concise nature of this paper, this analysis will be generalized. Let us start from the frame describing the consequences. As a result of decision a1
we find the following deviations:
x Interaction P N E( , ) of the outside environment of
the aircraft, that led to the weak (R1)deviation of its condition.
x Interactions P(E,P) and P(E,I) were zero (R0),
since no passengers or crew members were injured.
x InteractionP(D,I), determining the captain’s strong
)
(R3 deviation from the flight rules and procedures.
x InteractionP(S,I), determining the reaction of the remote social environment to the accident, defined as strong (R3).
x InteractionP(U,I), presenting the reaction of the captain’s close social environment (reference group) to this action, turned out to be weak(R1).
This was an initial disposition to the further analysis of underlying factors of the accident.
Now we will consider the frame of the problem being solved by the captain. In this frame, our analysis will be concentrated on the anticipated outcomes and their likelihood for the following interactions: P(E,P) and
) , (E I
P – determining the injuries of passengers and
crew members, P(N,E) – describing the damage to the aircraft itself, and the flight regulations violation
) , (D I
P . Collection of the accident data shows that the
captain realized the level of danger imposed on the passengers and the crew as strong (R3), but with a low
)
(L1 likelihood of such an outcome. At the same time, there was a general threat of a high (R3) level that was realized at an average (L2) likelihood:
f[(L1,R3)s] f[(L2,R3)o], where “o” and “s” point
to the objective and subjective nature of the values. Similarly, he underestimated the level of possible aircraft damage in this situation:
f[(L1,R3)s] f[(L2,R3)o].
At the same time, the captain correctly assumed that by performing this landing, he seriously (R3) deviates from
the flight rules and that is not a rare (L2)occurrence:
f[(L2,R3)s] f[(L2,R3)o].
With the frame of motivation, we can assume that the captain did not wish to cause any harm to the people on the plane, nor any damage to the plane itself, and was very strongly motivated to fulfill his decided course of action a1 and was reluctant to abort the landing and go for the alternate airport.
While evaluating the current frame of the discussed options, we made the following assumptions. With respect to the option a1, we can assume that in such cases the captain often (L3) had successfully (R0) performed the landing without causing harm either to the passengers or to the aircraft itself, and that he often (L3) caused an average (R2) positive reaction of the close social environment, and generated just a little (R1) negative
)} , ( ), , ( ), , ( ), , ( ), , ( ), , ( ), ,
{( 1 2 3 1 1 2 2 3 3
1 I C I C I C C E C E C E I P
W )} , ( ), , {(
3 S Isc U Isp
reaction, which occurred often (L3), from the senior management. Such a conclusion resulted from both the subjective and objective frames of the current decision option.
Evaluating the a2 option, we can assume the following; the captain has always (L4) and without
doing any harm (R0) to the passengers or the crew, could perform a go around and departure to an alternate airport. At the same time, he considered that the a2 option would often (L3) result in a strong (R3) negative reaction from the management. Though, objectively, option a2 with average (L2) likelihood produced an average (R2)
negative reaction from the same management, and shows us that:
] ) , [( ] ) ,
[(L3 R3 s f L2 R2 o
f ! .
C. Conclusion made
Based on the proposed model, the analysis has allowed us to conclude that the captain had sufficient visual clues to appreciate the complexity of the landing in the existing situation and saw the correlation of the task with his ability to resolve it, and understood the severity of the consequences that could result from a landing accident, but still made a decision to perform the landing. Thus, we conclude that the captain consciously committed the violation. But since his purpose was to successfully land the aircraft and he did it to the best of his ability, it should be admitted that the pilot had no direct, but only secondary intentions.
Thus, the analysis of the reasons behind the pilot's errors allows us to make the following conclusions: his error has manifested itself in an incorrect control of the aircraft during the landing, namely his inability to maintain the runway centerline upon touchdown, which was led to by the errors committed during the preceding process of performing this landing:
-incorrect perception of the existing situation; -low motivation for proper decision-making
(departing for alternate airport) and strong motivation to complete the landing;
- inadequate consideration of the available options; - choosing the wrong option;
-lack of personal discipline and emotional stability.
D. Probable Cause and Recommendations
The results of the analysis allow us to conclude that: x The main cause for the captain’s error was the conflict
of motives, where the motivational force for choosing the dangerous option – complete the landing – turned out to be significantly stronger than the motivation to choose a safer option – to go around and depart for the alternate airport with better meteorological conditions.
x All of this has been predetermined by the following underlying factors:
- negative attitude from the higher social environment to any kinds of additional fuel, airframe, and the engine service life expenditures, which could not have been avoided if the option for departure to an alternate airport has been chosen;
-in addition, all of the subsequent attempts to land and the additional flight time are recorded by data recorders. The level of risk that the pilot is willing to accept is known only to a small group and is not recorded anywhere objectively. Therefore, high risk is only punishable when resulting in an accident, such as in the current example.
x Such cases make a strong statement (recommendation) for the senior aviation executives to seriously reconsider their existing policies and search out a means of strengthening the crew motivation to improve flight safety, and to be more diligent in the flight-crew-hiring-process, with respect to their emotional and conative traits.
V. DECISION SYPPORT SYSTEM SAFE
The suggested model of operator performance was implemented in the project SAFE (System for Analyzing and Forecasting Errors) ([33]–[35], and other unpublished research materials1). The purpose of this project was to provide a powerful decision support tool for investigating the pilot and air traffic controller errors, analyzing their underlying causes, and making recommendations. A schematic description of SAFE’s architecture is given below. It includes the following six subsystems (Fig. 11):
Investigation – controlled collection, analysis and classification of data on an error.
Diagnosis – analysis and diagnosis of the causes of an error.
Recommendation – making recommendations for error prevention.
Database – storing and processing information about errors and their causes.
Figure 11. Architecture of SAFE.
1Funded by Russian Air Force and prepared under the direction of
Forecast – the identification of repeated factors and error-provoking situations; evaluation of the efficiency of safety measures.
Search – retrieving information from the database for investigation, making recommendations, and forecasting.
SAFE provides support for two types of users: investigators and system analysts.
It guides the investigator in the gathering and analyzing of the active error characteristics and related underlying factors (latent conditions) in the process of error investigation. Using the embedded mathematical models and computational algorithms, SAFE provides the sufficient completeness and correspondence of all the collected data, according to existing regulations and taxonomies, and checks that the important information is not to be ignored either unintentionally or deliberately. This support should enhance the investigator’s awareness and ensure the necessary qualitative level of the whole process of investigation.
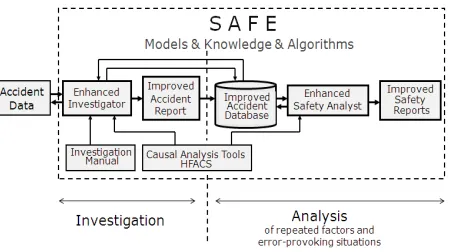
The core of SAFE is its database, which helps in error investigation and in producing recommendations, and making a large amount of statistical data available, as well as helping in the further analysis provided by the safety analyst, who determines repeated factors and error-provoking situations. All of this makes both the investigator and safety analyst much more enhanced, which, in turn, improves the safety of the whole control system (Fig. 12).
Figure 12. Decision support in error analysis and investigation
VI. CONCLUSION
The suggested model for operator performance coordinates with existing human factors taxonomies and classification systems (like HFACS) in determining active errors and latent conditions. It enriches existing human operator performance models with powerful tools for analyzing, investigating, and simulating operator performance, in the context of all factors contributing to errors (including personal and social factors). This model also helps to determine error-provoking situations and improves training by allowing the human operator (pilot, air traffic controller, maintenance specialist, etc.) practice under conditions that correspond to these situations.
More specifically, the model
interprets actual goal-based activities (e.g. flight or ATC) along with normative models for classification and decision making;
specifies types of deviations and their underlying causes, which cannot be detected by existing data-monitoring and tracking systems; for example: in the sphere of motivation and goal prioritization;
presents the opportunity to logically analyze errors and their underlying factors in the process of collecting data on them, not by drawing conclusions from the investigation reports as the traditional approach suggests;
provides coherence between the layers of the system responsible for its safety and an operator’s performance which directly exposes to an accident.
The application of the suggested model is not limited to aviation. It can be used to improve operator training, assessment, and error analysis in other areas such as:
Military systems (fighter aircraft, tank, armored vehicle, etc).
Other transportation modes (automobile, train, ship, spacecraft, etc).
Nuclear power plants and process (chemical, petroleum, electricity, etc) control.
Large-scale, multi-person, geographically distributed command and control systems for military operations and civilian emergencies: police, fire, weather, and terrorist attacks.
Hospital and insurance systems, etc.
ACKNOWLEDGMENT
The author wants to express his gratitude to his daughter, Alina Yemelyanov, for the valuable help which she gave him in preparing and editing this article.
REFERENCES
[1] J. Orasanu and L. Martin, “Errors in aviation decision making: a factor in accidents and incidents. In
Proceedings of the 2ndWorkshop on Human Error, Safety, and System Development, Seattle, 1998, pp. 100-107. [2] A. Mackieh and C. Cilingir, “Effects of performance
shaping factors on human error”, International Journal of Industrial Ergonomics, vol. 22, 1998, pp. 285-292. [3] J.T. Reason, Human error. New York: Cambridge
University Press, 1990.
[4] J.T. Reason, Managing the risks of organizational accidents. Aldershot, England: Ashgate Publishing, 1997. [5] International Civil Aviation Organization. Investigation of
human factors in accidents and incidents (Human factors digest No. 7), Montreal, Canada, 1993.
[7] E. Hollnagel, “Human reliability analysis: context and control”. In B.R. Gaines and A. Monk (Eds.), Computers and People Series, New York: Academic Press, 1993. [8] B. Strauch, Investigating human errors: incidents,
accidents, and complex systems. Aldershot, England: Ashgate Publishing, 2002.
[9] S.T. Shorrock and B. Kirwan, “Development and application of a human error identification tool for air traffic control”, Applied Ergonomics, 33 (4), 2002, pp. 319-336.
[10] P.M. Salmon and M. Regan, and I. Johnston, Human error and road transport: Phase two – A framework for an error tolerant road transport system, Monash University Accident Research Centre, Melbourne, Australia, 2006. [11] S.A. Shappell and D.A. Wiegmann, “A human error
approach to accident investigation: The taxonomy of unsafe operations”, The International Journal of Aviation Psychology, 7, 1997, pp. 269-292.
[12] D.A. Wiegmann and S.A. Shapell, A human approach to aviation accident analysis: the human factors analysis and classification system. Aldershot, England: Ashgate Publishing, 2003.
[13] D.K. Busse and C.W. Johnson, “Using a cognitive theoretical framework to support accident analysis”,
Proceedings of the 2nd Workshop on Human Error, Safety, and System Development, Seattle, 1998.
[14] A. Yemelyanov, “Unified Modeling of Human Operator Activity in a Real-World Environment”, Proceedings of the 2005 IEEE International Conference on Systems, Man, and Cybernetics, Hawaii, 2005, pp. 2476-2481.
[15] M. Kotik and A. Yemelyanov, Human-operator errors: psychological causes and method of computer-aided analysis, Tallinn: Valgus Publishers, 1985.
[16] D. Miller and A. Swain, “Human error and human reliability”. In G. Salvendy (Ed.), Handbook of Human Factors, pp. 219-252. NY: John Wiley, 1986.
[17] P.F. Lourens, “Error analysis and applications in transportation systems”, Accident Analysis & Prevention. Vol. 21, No. 5, pp. 419-426, 1989.
[18] H. Heinrich, D. Petersen, and N. Ross, Industrial accident prevention: A safety management approach (5th ed.), New York: McGraw-Hall, 1980.
[19] B.F. Skinner, About behaviorism, New York: Vintage Books, 1974.
[20] R.L. Helmreich and H.C. Foushee, “Why crew resource management? Empirical and theoretical bases of human factors training in aviation”. In E. Weiner, B. Kanki, and R. Helmreich (Eds.), Cockpit Resource Management (pp. 3-45), San Diego, CA: Academic Press, 1993.
[21] R.O. Reinhar, Basic flight physiology (2nd ed.), New York: McGraw-Hill, 1996.
[22] A. Degani and E. Wiener, “Philosophy, policies, procedures, and practices: the four “P”s of flight-deck Operations”. In N. Jonston, N. McDonald, and R. Fuller (Eds.), Aviation psychology in practice, (pp.44-67). Bookfield, VT: Ashgate, 1994,
[23] G. Booch, J. Rumbaugh, and I. Jacobson, The Unified Modeling Language user guide, Addison-Wesley, 1999. [24] D.A. Norman, “Cognitive engineering”. In D.
Norman and S. Draper (Eds.), User Centered System
Design: New Perspectives on Human-Computer
Interaction (pp.31-62), Hillsdale, N.J.: Erlbaum, 1986. [25] W. James, The Principles of Psychology (2 vols.), New
York: Henry Holt, 1890.
[26] A. Reed, “Social identity as a useful perspective for self-concept-based consumer research”, Psychology and Marketing, 19(3), 2002, pp. 235-266.
[27] S. Onkvisit and J. Shaw, “Self-concept and image congruence: Some research and managerial implications”,
The Journal of Consumer Marketing, 4 (1), 1987, pp.13-2. [28] E. Goffman, Frame Analysis: An Essay on the Organization of Experience. New York: Harper & Row, 1974.
[29] M. Minsky, “A framework for representing knowledge”. In P. Winston (Ed), The Psychology of Computer Vision (pp. 211-277, NY: McGraw-Hill, 1975.
[30] A. Yemelyanov, “Method of analysis of human management performance through use of frames and special modal logic,” Izvestia AN SSSR: Tekhnicheskaia kibernetika (Proceedings of the USSR Academy of Sciences: Technical Cybernetics), no. 4, 1981, pp. 94-102. [31] M. Kotik and A. Yemelyanov, “Emotions as an indicator
for subjective preferences in decision-making (Express decision support method)”, Psikologicheskiy Jurnal (Psychological Journal, Russian Academy of Sciences),
vol. 13, no.4, pp. 118-125, 1992.
[32] A. Yemelyanov, “Towards a definition of intentional and negligent behavior”, Criminal Law. Works of Russian Academy of Sciences, Moscow, Russia,1981, pp. 106-115. [33] M. Kotik and A. Yemelyanov, Origin of human-operator
errors, Moscow: Transport Publishers, 1998.
[34] A. Yemelyanov, “Modeling Operator Performance for Error Analysis”. Proceedings of 2007 IEEE International Conference on Systems, Man, and Cybernetics, Montreal, Canada, October 7-10, 2007, pp. 609-614.
[35] A. Yemelyanov, “Computer-aided system for human error analysis (theory, method, implementation)”, Unpublished Doctor of Science Thesis, Scientific-Research Institute of Aircraft Equipment / NIIAO, Zhukovsky, Russia, 1990.
Alexander M. Yemelyanov is a tenured Professor of Computer Science at Georgia Southwestern State University, USA. He holds a M.S. in Computer Science from Moscow State University (1975), a Ph.D. in Applied Mathematics from the Dorodnicyn Computing Center of Russian Academy of Sciences (1980), and a D.Sc. in Systems Engineering (with a concentration in Ergonomics) from the Institute of Aircraft Equipment, Zhukovsky, Russia (1991).