Available online
www.ijpras.com
International Journal of Pharmaceutical Research & Allied Sciences, 2018, 7(4):86-96
Research Article
CODEN(USA) : IJPRPM
ISSN : 2277-3657
Correlation of Visual, Cognitive, Physical Motor Skills and Risk Perception
with Driving Performances of Young and Elderly Drivers
Indri Hapsari Susilowati1*, Akira Yasukouchi2
1Occupational Health and Safety Department, Faculty of Public Health, Universitas Indonesia, Depok 16417, Indonesia,
2Department of Human Science Design, Graduate School of Design, Kyushu University, Shiobaru 4-9-1 Minami ku, Fukuoka 815-8540, Japan.
*Email: indri @ ui.ac.id
ABSTRACT
Since driving is a complex task involving integration of visual, cognitive, and physical motor skills, elderly drivers are at a higher risk of road crashes because they have limitations in all those skills. This study analyzed the correlation between all the skills, including the drivers’ risk perception, as risk factors impacting on their performance. This research was an experimental study. The young drivers amounted to 7 persons (22 – 24 years old), the elderly subjects constituted two groups including: 9 persons (group 1: 60 - 65 years old) and 12 persons (group 2: 66 - 76 years old). The instruments were the Use full Field Of View (UFOV), the Trail Making Tests (TMT) A & B, the tapping test, the Driver's Stress Intention (DSI), and the Driver Coping Questionnaire (DCQ). The driving performance was evaluated via a driving game simulator. There were correlations between the independent variables (visual, cognitive, and physical skill), including DRP being measured to assess the drivers’ performances. The visual skill, for instance an error of UFOV, influenced all the drivers groups. Cognitive factors (TMT A and B) and DRP (hazard monitoring, reappraisal, avoidance, and dislike driving) were found to be correlated only in the young drivers and the elderly drivers of group 1. Considering the Physical motor-skilled factors, the errors that were occurred during the tapping test were reported to have correlation with the driving ability of the younger drivers and the second elderly group (>65 years old).
Key words: Elderly Driver, Young Driver, Driver Performance, Visual Skill, Cognitive Skil, Physical Motor Skill
INTRODUCTION
Since 2006, Japan’s population has been called a “Super Aging Society” because the percentage of the aging population has been more than 20% out of the overall population. The United Nations has presented Japan as a country with the highest number of the aging people; the percentage of the aging Japanese people out of the overall population has been predicted to be more than 35% in 2050 [1].
87
lower risk of the thrill seeking behaviors. As for the physical skills, the elderly drivers needed more time for the tapping test. However, although the younger drivers could finish the tapping test faster, they scored poorly in the accuracy and carefulness as compared to the older drivers. It was also shown that the elderly drivers had poorer driver performance than their younger counterparts. This was proved by the significant differences between the young and elderly drivers in almost all the parameters of driving performance. It was confirmed that the elderly would be the higher risk drivers on the road even though they spend less time in driving and drive in shorter distances than their younger counterparts. Although many elderly persons self-regulate their driving by reducing the time or circumstances under which they drove, some drive unsafely because of the cognitive or visual difficulties [2]. Therefore, as older people drive more often, for longer time periods and for longer distances, they would be at a higher risk for more accidents. Given the above, elderly drivers had a greater road crash risk than the young ones.
Driving is a complex task involving integration of visual, cognitive, and psychomotor skills, many of which are deteriorated with the passage of time. Hence, this may contribute to a greater risk of crash seen in older drivers [3]. The Road Safety Program in Fukuoka City is one of the ways to prevent accidents related to the visual and physical fitness skill factors. Visual skill also has correlation to the cognitive and judgmental factors. Similarly, physical skills that are related to the fitness have correlation to the driving operations. However, only few studies on the combination of the visual, cognitive, and physical motor skills as risk factors in driving performance have been done. Therefore, such a study needs to analyze the correlation between all the skills, including the drivers’ risk perceptions, as risk factors impacting the drivers’ performances. The hypothesis was that there would be different risk factors when comparing the elderly and young drivers regarding their overall driving performance levels. In this study, it was further hypothesized that these differences in risk factors would require different programmatic safety solutions for both the young and old drivers.
MATERIAL AND METHOD
This research was an experimental study. The subjects were 28 persons, including young and elderly drivers. Young drivers amounted to 7 persons (3 males and 4 females), aged 22 – 24 years ( = 23.14+ 0.38). The number of the elderly subjects was 21 persons, consisted of 9 persons (5 males and 4 females) in group 1 (60 – 65 years old, = 62.56 + 1.33), and 12 persons (6 males and 6 females) in group 2 (66 – 76 years old, = 69.67 + 2.64). The elderly groups were collected from the Silver Manpower Centre, an organization for the elderly people aged 60 and over.
The combination and contribution between the visual (Usefull Field Of View/ UFOV), cognitive (Trail Making Test/ TMT A and B) physical motor (Tapping Test) skills, and the drivers’ risk perceptions (DRP) were examined for both the young and elderly drivers. DRP was measured by Driver Stress Inventory (DSI) and Driver Coping Stress (DCS) questionnaires. The DSI was an extension of an earlier assessment of stress, the Driver Behaviour Inventory (DBI), which aimed to measure the vulnerability to the commonplace stress reactions while driving, such as frustration, anxiety, and boredom [4].
Usefull Field Of View (UFOV)
UFOV assessed declining the visual sensory functions, the visual processing speed, and the visual attention skills, and has been found to be a significant predictor of the elderly-involved crashes [5]. The UFOV determined the range of the visual field over which a driver can process the rapidly-presented visual information [5]. UFOV of this research was developed by a visual basic program into 24 positions (8 radial spoke x 3 distance: 3o, 6o, 9o). The distance between the subject’s eyes and the monitor was 50 cm. The visual stimuli
included color stimuli (red, green, blue) with luminescence between 1.5 – 2.2 cd/m3, shape stimuli (circle,
triangle, and square), and number stimuli (0,1,2,3) with the luminescence ranging from 1.5 – 1.7 cd/m3. Each
88
Figure 1. Measurement position of UFOV test
Figure 1 shows the measurement position of UFOV test. In the task of UFOV, the subjects had to remember the colors/shapes and the numbers which were shown on the monitor. Furthermore, they had to react immediatedly when the same color/shape appearred randomly. In contrast, no reaction should be demonstrated if there was a different color/shape. In the last task, they had to choose the number which was shown previously. The reaction time to finish each task was measured, as well as the wrong reaction, no reaction, and the wrong number. The wrong reaction meant that the subject reacted to the distraction stimuli. No reaction meant that the subject did not respond to all the stimuli. The wrong number meant that the subject wrongly chose the numbers that were previously appeared in his or her target attention. Moreover, the data were presented in 6 plot areas, based on the angles [upper horizontal (45o, 90o, 135o), horizontal (0o, 180o), and below horizontal (225o, 270o, 315o)], and
distance (inner: 3o, middle: 6o, and outer: 9o).
Trail Making Test A and B (TMT A and B)
For TMT A, the subjects were required to make a line connecting the consecutive number targets, whereas, for TMT B, the subjects were required to connect the numbers alternating with the letters (e.g., 1-A-2-B-3-C…). The time taken to complete the test was used as the primary performance metric.
Tapping Test
The tapping test recorded hand responses and cognition according to the speed, accuracy, and the focus of attention. Schematically, the tapping test layout consisted of 5 radial spokes along a half radius, labeled A through E from right to left, with five circles along each spoke. The subjects were told to tap inside the circles starting from the center to the next circle, starting from the line A to B to C and so on. Each line was tapped twice. The test recorded two types of errors, “wrong step,” that is, when the wrong circle was tapped, and “out of circle area,” indicating that no circle was tapped. Additionally, the time needed to complete the test was recorded.
Driver Risk Perception (DRP)
89
states and worries which tended to interfere with the task performance. The third parameter was hazard monitoring, and this was a form of positive appraisal which was related to the alertness on the Driver Behavior Index (DBI); however, hazard monitoring had a narrower scope than the state of the alertness and might be better seen as a specific style of the task-focused coping. Fatigue proneness was a form of the negative appraisal which measured the extent to which a driver was prone to the driver fatigue after the prolonged driving; it was related to the driver’s error and the lower driving speeds, and was the single strongest predictor of the task-induced fatigue symptoms while driving. Thrill seeking has been a negative appraisal behavior associated with the hazardous actions facilitating the sensation and thrill of driving; it was linked to risky driving and increased the accident involvement [6].
The DCQ parameters were comprised of confrontive coping, task focus, emotion focus, reappraisal, and avoidance. Confrontive coping was a manner of negative coping related to several behaviors that can be considered dangerous. Contrarily, task focus was a type of positive coping associated with the behaviors likely to enhance safety. Emotion focus was also a form of negative coping; it has been an ineffective strategy by which a subject criticized and blamed him or herself as a driver, it is an approach that could lead to the drivers’ distraction and contribute to the risk of being involved in a collision. Reappraisal, a means of positive coping, was when the drivers sought to gain something worthwhile from driving and a feeling of becoming more experienced drivers. Lastly, avoidance was determined to be a form of negative coping; it was an ineffective strategy by which the drivers attempted to ignore the actual situation by focusing on other situations and behaviors often occurring in traffic jams and accident situations.
Driving Performance
Driving performance was evaluated via a driving game simulator in a laboratory room. The luminance level in the experiment room was 270 – 300 lx for measures at the LCD (Liquid Crystal Display) of 46 inch, and the room temperature was 23oC with 50% relative humidity. The track was a simulated city road in Japan,
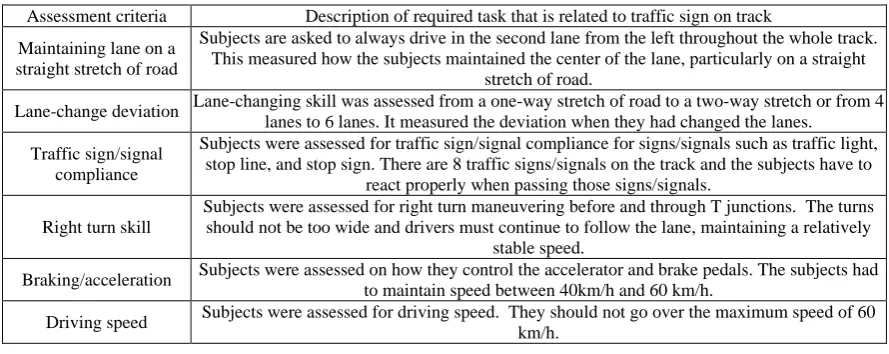
specifically, in the Shinjuku area of Tokyo where drivers must bear to the left side of the road. The subjects were required to drive at a speed of 40 – 60 km/h, and not to go over the maximum speed of 60 km/h. Six-measured-parameters were as followed: maintain lane position, lane change/deviation, traffic sign compliance, right turn skill, braking and acceleration, and driving speed. They were described in the table below.
Table 1: Assessment Criteria of Driver’s Performance
Assessment criteria Description of required task that is related to traffic sign on track
Maintaining lane on a straight stretch of road
Subjects are asked to always drive in the second lane from the left throughout the whole track. This measured how the subjects maintained the center of the lane, particularly on a straight
stretch of road.
Lane-change deviation Lane-changing skill was assessed from a one-way stretch of road to a two-way stretch or from 4 lanes to 6 lanes. It measured the deviation when they had changed the lanes.
Traffic sign/signal compliance
Subjects were assessed for traffic sign/signal compliance for signs/signals such as traffic light, stop line, and stop sign. There are 8 traffic signs/signals on the track and the subjects have to
react properly when passing those signs/signals.
Right turn skill
Subjects were assessed for right turn maneuvering before and through T junctions. The turns should not be too wide and drivers must continue to follow the lane, maintaining a relatively
stable speed.
Braking/acceleration Subjects were assessed on how they control the accelerator and brake pedals. The subjects had to maintain speed between 40km/h and 60 km/h.
Driving speed Subjects were assessed for driving speed. They should not go over the maximum speed of 60 km/h.
Statistical analysis was performed using spearman correlation by SPSS Software, Version 20.0.
RESULT
90
315o)], and distance (inner: 3o, middle: 6o, and outer: 9°) for each color and shape of the stimuli. Moreover, the
errors that occurred at the time of UFOV measurement (i.e. the reaction wrong, wrong number, and no reaction) were presented as a part of the color or shape stimuli. Furthermore, they were grouped into 6 plot areas as mentioned before. Additionally, the errors that occurred on the tapping test were also seen as an independent variable, whereas the dependent variable was the drivers’ performances that consisted of 6 parameters.
Based on the bivariate statistical analysis using Spearman rho correlation, it appeared that there were correlations between the visual, cognitive, and physical skills of the drivers’ performances.
UFOV visual skill was correlated with all the parameters of driving abilities, i.e. maintain lane, lane change deviation, traffic sign compliance, right turn skills, braking/acceleration, and driving speed. An error in UFOV had the highest numbers of dealing with driving ability, such as the ability of young drivers in maintaining vehicles to remain in the same lane. This ability was correlated with the UFO-V error in the inner area (p = 0.045; r = 0.765) and horizontal area (p = 0.042; r = 0.772). It was indicated that the ability to drive to maintain the vehicles to remain in the same lane was getting better, but also many mistakes were occurred by not responding to the stimulus which needed the visual skill in the horizontal area and inner areas/target sight for driving. In contrast, the ability to change lane due to the lane change deviation on the highway showed a correlation with UFO-V error, especially in the outer area (p = 0.035; r = -0.788) and the upper horizontal area (p = 0.035; r = -0.788) as well as the tapping test error (p = 0.019; r = -0.835). If the visual error in response to the stimulus in the peripheral area of the field of view was reduced, the ability of the lane change could be also getting better. When doing lane change, the driver must widen the peripherals of the view. A strength correlation of the visual skill with two driving performance parameters was quite large, which was around 78%.
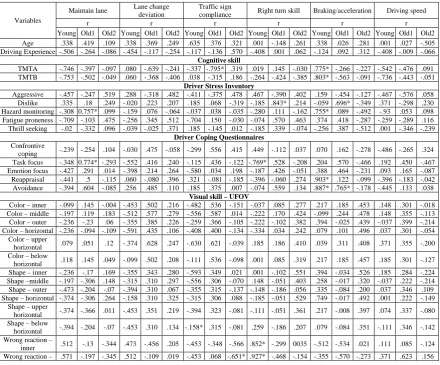
Table 2 : Correlation Amongst Risk Factors of Driver’s Performances in Young Drivers, Elderly Drivers on Group 1 (Old1) and Elderly Drivers Group 2 (Old2)
Variables
Maintain lane Lane change deviation
Traffic sign
compliance Right turn skill Braking/acceleration Driving speed
r r r r r r
Young Old1 Old2 Young Old1 Old2 Young Old1 Old2 Young Old1 Old2 Young Old1 Old2 Young Old1 Old2 Age .338 .419 .109 .338 .369 .249 .635 .376 .321 .001 -.148 .261 .338 .026 .281 .001 .027 -.505 Driving Experience -.506 -.264 -.086 -.454 -.117 -.254 -.117 -.136 .570 -.408 .001 .062 -.124 .092 .312 -.408 -.009 -.066
Cognitive skill
TMTA -.746 -.397 -.097 .080 -.639 -.241 -.337 -.795* .319 .019 .145 -.030 .775* -.266 -.227 -.542 -.476 .091 TMTB -.753 -.502 -.049 .060 -.368 -.406 .038 -.315 .186 -.264 -.424 -.385 .803* -.563 -.091 -.736 -.443 -.051
Driver Stress Inventory
Aggressive -.457 -.247 .519 .288 -.318 .482 -.411 -.375 .478 .467 -.390 .402 .159 -.454 -.127 -.467 -.576 .058 Dislike .335 .18 .249 -.020 .223 .207 .185 .068 -.319 -.185 .843* .214 -.059 .696* -.349 .371 -.298 .230 Hazard monitoring -.308 0.757* .099 -.159 .076 -.064 -.037 .038 -.035 -.280 .111 -.162 .755* .089 -.492 -.93 .053 .098 Fatigue proneness -.709 -.103 .475 -.256 .345 .512 -.704 .150 -.030 -.074 .570 .463 .374 .418 -.287 -.259 -.289 .116 Thrill seeking -.02 -.332 .096 -.039 -.025 .371 .185 -.145 .012 -.185 .339 -.074 -.256 .387 -.512 .001 -.346 -.239
Driver Coping Questionnaires Confrontive
coping -.239 -.254 .104 -.030 .475 -.058 -.299 .556 .415 .449 -.112 .037 .070 .162 -.278 -.486 -.265 .324 Task focus -.348 0.774* -.293 -.552 .416 .240 -.115 .436 -.122 -.769* .528 -.208 .204 .570 -.466 .192 .450 -.467 Emotion focus -.427 .291 .014 -.398 .214 .264 -.580 .034 .198 -.187 .426 -.051 .388 .464 -.231 .093 .165 -.087 Reappraisal -.441 .5 -.115 .060 -.080 .396 .321 -.081 -.185 -.396 -.060 .274 .903* .122 -.099 -.396 -.183 -.042 Avoidance -.394 .604 -.085 .256 .485 .110 .185 .375 .007 -.074 .559 .134 .887* .765* -.178 -.445 .133 .038
Visual skill – UFOV
Color – inner -.099 .145 -.004 -.453 .502 .216 -.482 .536 -.151 -.037 .085 .277 .217 .185 .453 .148 .301 -.018 Color – middle -.197 .119 .183 -.512 .577 .279 -.556 .587 .014 -.222 .170 .424 -.099 .244 .478 .148 .355 -.113 Color – outer -.236 -.23 .06 -.355 .385 .226 -.259 .366 -.105 -.222 -.102 .382 .394 -.025 .439 -.037 .399 -.214 Color – horizontal -.236 -.094 -.109 -.591 .435 .106 -.408 .400 -.134 -.334 .034 .242 .079 .101 .496 .037 .301 -.054
Color – upper
horizontal .079 .051 .12 -.374 .628 .247 -.630 .621 -.039 .185 .186 .410 .039 .311 .408 .371 .355 -.200 Color – below
horizontal .118 .145 .049 -.099 .502 .208 -.111 .536 -.098 .001 .085 .319 .217 .185 .457 .185 .301 -.127 Shape – inner -.236 -.17 .169 -.355 .343 .280 -.593 .349 .021 .001 -.102 .551 .394 -.034 .526 .185 .284 -.224 Shape –middle -.197 -.306 .148 -.315 .310 .297 -.556 .306 -.070 .148 -.051 .403 .258 -.017 .320 -.037 .222 -.214 Shape – outer -.473 -.204 -.07 -.394 .310 .067 -.355 .315 -.137 -.148 -.186 .056 .335 -.084 .200 .037 .346 .109 Shape – horizontal -.374 -.306 .264 -.158 .310 .325 -.315 .306 .088 -.185 -.051 .529 .749 -.017 .492 .001 .222 -.149
Shape – upper
horizontal -.374 -.366 .011 -.453 .351 .219 -.394 .323 -.081 -.111 -.051 .361 .217 -.008 .397 .074 .337 -.080 Shape – below
horizontal -.394 -.204 -.07 -.453 .310 .134 -.158* .315 -.081 .259 -.186 .207 .079 -.084 .351 -.111 .346 -.142 Wrong reaction –
91 middle
Wrong reaction –
outer .512 -.197 -.058 .571 -.277 .359 .473 -.350 -.651* .852* .392 .181 -.335 .013 -.178 .111 -.018 -.015 Wrong reaction –
horizontal .512 -.159 -.349 .473 -.481 .184 .512 -.339 -.642* .852* -.427 .026 -.512 -.682* -.019 .111 .040 -.153 Wrong reaction –
upper horizontal .374 .026 -.224 .611 -.008 .250 -.148 .102 -.546 .927* .001 .074 -.374 -.235 -.120 .001 .497 .016 Wrong reaction –
below horizontal .567 -.179 -.091 .577 -.293 .318 .037 -.136 -.531 .860* -.186 .123 -.288 -.403 -.232 .206 .408 .069 No reaction – inner .765* .494 .169 -.040 .085 .200 .093 .173 .421 .262 -.466 .149 -.875* -.239 .408 .542 .081 -.251
No reaction –
middle .646 .247 .127 -.080 .134 .184 .224 .170 .566 .056 -.475 -.039 -.875* -.227 .225 .430 .239 -.523 No reaction – outer .020 .202 .088 -.788* .300 -.074 -.408 .318 .629* -.482 -.402 -.172 -.571 -.025 -.056 .445 .098 .076
No reaction –
horizontal .772* .214 .298 -.060 .269 .154 .189 .265 .676* .170 -.400 .060 -.853* -.097 .234 .547 .178 -.368 No reaction – upper
horizontal -.079 .282 .13 -.788* .143 .081 -.408 .231 .612* -.482 -.477 -.238 -.670 -.105 -.165 .259 .080 -.211 No reaction –
below horizontal .225 .366 .169 -.409 .126 .191 -.462 .162 .650 .115 -.593 -.133 -.941 -.244 -.063 .308 .204 -.224 Wrong number –
inner .381 .137 .115 -.331 .046 .518 -.434 .158 .250 .340 -.630 .053 -.903* -.262 -.235 .340 .445 -.530 Wrong number –
middle .271 .103 .088 .451 .185 .474 -.396 .316 .357 .793* -.664 -.077 -.532 -.283 -.414 .132 .521 -.597 Wrong number –
outer .577 .218 -.011 .129 -.206 .543 -.112 -.124 .032 .654 -.698* -.065 -.666 -.338 -.375 .187 .040 -.626 Wrong number –
horizontal .709 .137 .051 -.079 -.055 .533 .222 .094 .116 .111 -.630 .007 -.867* -.224 -.257 .482 .205 -.591 Wrong number –
upper horizontal .611 .187 .301 .374 .117 .577* -.185 .238 .428 .852* -.627 .215 -.591 -.269 -.283 .296 .576 -.589 Wrong number –
below horizontal .609 .145 .093 -.268 -.029 .419 -.078 .098 .282 -.428 -.647 -.193 -.857 -.295 -.498 .602 .401 -.542 Physical skill
Tapping test .030 .107 .409 -.159 .336 -.599* .748 .363 .219 -.580 .289 .450 .258 .624 .109 -.206 .098 -.700* Wrong step -.737 .451 -.173 -.369 -.21 .116 -.370 -.069 .057 -.092 .615 -.035 .147 .445 .327 -.786* -.304 -.342 Out of circle -.169 -.63 .129 -.835* .154 -.057 .056 .130 .511 .673 -.147 .088 .388 -.232 .395 -.449 .448 .011
Note. *r (correlation) = p < .05
Likewise, when there were fewer errors in the physical skills, then the higher the improvement of young drivers’ ability to perform driving skill would be, if there was a lane change on the highway. The strength of correlation was high at 83.5%. An error in the tapping test, which was wrong step (p = 0.036; r = -0.786) also affected the ability of young drivers to maintain driving speed during driving. The correlation test showed that the fewer the tapping test errors were, the better the ability of the young drivers was in maintaining their driving speed to avoid overspeed. It was supported by the strength of the relationship between the variables that was 78.6%. The skills of young drivers in doing braking and acceleration affected the visual factors and cognitive skills. Visual skills that were correlated were UFOV errors, especially there was no reaction and the wrong number in the area of inner, middle, horizontal, and below the horizontal (see table 2). When braking or acceleration was performed, it would be better if the error of the field of view in the main area of the view and below horizontal was also minimized. Moreover, the cognitive skills that were correlated with these abilities were TMT A (p = 0.041; r = 0.775) and TMT B (p = 0.030; r = 0.803) in which the more quickly the ability of young drivers in processing the information in the highway, the better the drivers’ ability was to perform braking or acceleration. Additionally, this ability was also affected by the risk perception during driving, i.e. hazard monitoring (p = 0.049; r = 0.755), reappraisal (p = 0.005; r = 0.903), and avoidance (p = 0.012; r = 0.887). This meant that the better the young drivers carried out the hazard monitoring, avoidance, and reappraisal during the drive, then the better the drivers’ ability was in braking or acceleration.
92
0.010; r = -0.795). On the other words, the faster the completion time of TMT-A was preceded, the faster the information in the highway was processed. Thus, the higher the performance of the traffic sign was complied. This correlation test had a strength coefficient of almost 80%.
Maintaining the lane performance had a significant correlation with the drivers’ risk perception, especially in hazard monitoring (p = 0.018; r = 0.757) and task focus (p = 0.014; r = 0.774). This meant that the perception of the elderly drivers in the age group of 60-65 yrs would strengthen the hazard monitoring and the task focus. Hence, the ability to drive in the same lane would also be good. The strength of this correlation was quite high or greater than 75%.
Moreover, the braking/acceleration was influenced by the DRP, which were dislike driving (p = 0.004; r = 0.696) and avoidance (p = 0.016; r = 0.765). The more the dislike driving increased as well as the avoided things that had the risks of danger on the highway, the more frequent the braking/acceleration might occur. Dislike driving was also significantly correlated to the right turn skill (p = 0.004; r = 0.843). It was also affected by the errors in UFOV, which was the wrong number in the peripheral area of the field of view (p = 0.037; r = -0.698). This meant that the smaller the error occurred in viewing the stimulus in the area of peripheral view, the better the right turn skill was performed.
The results of the bivariate analysis for the elderly age group 2 (> 65 years) indicated that there was a correlation between the driving performance and the visual and physical skill motors. There were only 3 driving performances affected, namely the lane change, the traffic sign compliance, and the driving speed. Physical motor skill, which was tapping test, was known to have a correlation with the performance of the lane change skill (p = 0.039; r = -0.599) and the driving speed (p = 0.011; r = -0.700). This meant that the less time was required in the tapping test, the better the driving performances were, especially in anticipating the lane changes and the speed control in the road.
On the other hands, the performance of the traffic sign compliance had a correlation with the error on UFOV, especially the wrong reaction and no reaction in the peripheral area, as well as in the horizontal area that was the target view during driving. It was shown that the compliance on traffic light/sign in the elderly drivers over 65 years old would be better, if they could view all the traffic sign in all the fields of view better. The fewer mistakes in their visual skills occurred in case of better obedience to the traffic signs/lights.
DISCUSSION
From the bivariate analysis result on table 2, it could be identified that there was a correlation between the independent variables being measured with the drivers’ performance. The visual skill, particularly error of UFOV had some correlations with the drivers’ performances. In young drivers, the analysis of the visual skill revealed that an error in the distraction attention (no reaction) in the focus field of view (inner and horizontal area) affected their performance during the lane maintenance. This was also applied for errors in the peripheral field of view (outer and upper horizontal area). If the young drivers focused on the target attention of the inner and horizontal area, the attention would increase the performance to maintain the vehicle in the same lane. On the other hands, the young drivers’ attention on the peripheral view (outer and upper of horizontal area) affected on theirs driving performances if there was a lane change in the road.
The correlation between the error of UFOV and the drivers’ performance was also found among the drivers of group 2 (> 65 years). The result also showed error in the distraction attention (wrong and no reaction) in all the field of view (outer, middle, upper, and horizontal area), that affected their performance to obey the traffic signs/lights. The elderly drivers over 65 years old narrowed their field of view. This condition would disturb the elderly drivers when they are driving, especially when seeing the traffic signs/lights.
93
horizontal sight lines along with the position of the traffic signs and the incoming vehicle was important at T junctions and intersections [7].
Regarding the drivers’eyesight, an object located within the field of the sight and appearing under the horizontal sightline was more easily seen and focused upon than the above-line objects within the field. However, a driver’s eyesight must not only capture the below-line sight but also the above-line sight. Driving functions utilize below-line sight consisting of, amongst the other things, steering wheel control, manipulating other vehicle controls and monitoring dashboard indicators. In contrast, driving functions utilize the above-linesight including paying attention to traffic signs/signals, monitoring ground-level and over-passing roads, as well as surveying other vehicles.
Even though, the young drivers still had a comprehensive eye sight, errors in the distraction attention in the peripheral view affected their ability to drive in the same lane both on the straight road or when there was changing in the number of the highway lanes. Although, the young drivers’ performance is better than that of the elderly drivers, it should be considered that the young drivers were less careful in reacting to the objects in the peripheral view. In determining traffic-signs’ vertical distance, it was important to take into consideration that the results strongly suggested that signs were not posted far, but not much above the horizontal periphery of the field of view.
(B. Sekuler, 2000) found that the peripheral localization tasks would make significant main effects on the attention in the aged group [8]. The similar result was shown in the posthoc analysis of the peripheral difference scores, it was presented the deterioration in UFOV begins early in life (by 20 years or younger). In the central letter identification task, the error rate was stable until about 40 years and gradually increased thereafter. [9] studied the young, middle-aged, and older subjects, and also found the same result: the variable of the visual fields was the best measurement in the full logistic modeling, and the motion sensitivity was the best in the stepwise modeling. The visual motion sensitivity was previously shown to be the strongest visual predictor of the driving performance on a closed-road circuit and had the face validity in the driving context involving the contrast and movement, which were relevant cues for driving.
In the second elderly driver group, the errors in the peripheral attention (wrong reaction and no reaction) had a greater affect on their driving performance. This meant that the driving performance of the elderly drivers above 65 years would be disturbed if they wrongly judged the stimulus/traffic sign appearing in the peripheral view; the affected parameters would make it difficult to see the traffic signs/lights, then they would fail to comply the traffic signs/lights.
The elderly drivers >65 years old showed greatly increased rates of the error of UFOV for no response, especially at the upper view, and the outer distance. It was demonstrated that the risk of over-sighting a traffic sign would increase when the sign was located in the upper site of the peripheral distance. Because there was found a contribution to the driving performance, it was important to improve the information technology on the road and in the vehicle, thus giving reminders to drivers if there were stop signs or changes in the flow of the traffic in the near distance.
UFOV test works as an independent predictor of the driving mobility, similar to the visuospatial abilities and memory, considering age, vision, and physical performance [10]. This study supported the statement that when the elderly drivers were given longer reaction time and a poor adjustment to the divided attention, particularly in the case of targets/stimuli appearing at the peripheral view, their road performance would be influenced.
94
The faster the elderly drivers of group 1 completed the TMT A task, the higher their possibilities were to increase the ability to comply with the traffic signs/lights. Besides that, elderly drivers had prolonged their response times for TMT A when focusing on a peripheral view stimulus. This then led them take extra time to see the traffic signs/ lights in peripheral field of view, increasing the misjudgment in the horizontal view within and around the target view. Therefore, on a straight road, the position of the traffic signs would be better situated on a horizontal line, or below the horizontal line, of a driver’s eye view that would keep the driver’s attention. Additionally, it would be necessary to provide monitoring or alarm devices in the vehicles to increase the drivers’ attention to the road signs.
Many researchers have shown that the Trail Making Test was the best tool to predict crashes and driving exposure and avoidance. [2, 11] stated the trail making test, which focused more on the speed of the visual search, attention, mental flexibility, and motor function, has consistently emerged as a significant predictor of driving skill. TMT ability to measure the level of the cognitive function has been significantly associated with the crash risk even after controlling the effects of the drivers’ age, ethnicity, self reported annual mileage and driving frequency [12]. [13], for example, found the older drivers’ performances on trail making A to be significantly correlated to their performances on a traffic driving course, and [14] found both Trail making A and B to be significantly associated with the street driving performance.
[2] also found that the elderly drivers with the cognitive impairment and poor reaction time were at a greater risk for the unsafe driving. This finding resembled other results that reported strong associations between the reaction time, driving performance, and the error rate [15]. A range of the cognitive abilities declining with age was relevant to the safe driving, including the visual attention and processing speed [5], and executive function [16] and had been shown to predict the driving safety. Drivers who scored in the lowest 10% on the cognitive tests were approximately 1.5 times more likely to be in crashes than the drivers who scored in the highest 10% [12]. The results obtained in this study confirmed other researches that have shown an association between the trail making test or the cognitive skills and driving ability.
The last one was a physical factor of the motor skill. It was known that the error occurred during the tapping test was correlated with the ability to drive in the young drivers and elderly drivers on group 2 (> 65 years old). For a young driver, the less the error of tapping that was out of the circle, the higher the improvement of the driving ability of the young drivers in keeping the vehicle in the same lane, despite the changed lanes on the highway. On the contrary, the less the error such as wrong step occurred, the higher the ability of the young drivers was to maintain the driving speed. Regarding the physical factors of the motor skills like tapping test, it was found that the faster the tapping test was finished, the higher the ability to drive in the same lane was, and the ability to drive in the elderly of group 2 (> 65 years) was improved in order to avoid over speeding.
The time required for the tapping test was significantly longer for those over 60 as compared to the young ones. This performance was in line with the result of [17] who stated that the performance capabilities among the older adults (60 – 80 years) was worse than the young ones (20 – 30 years old) as well as their cognitive or motor tasks. However, the evaluated accuracy of the motor function gave the wrong step results showing no significant differences between the ages, but, in the case of “out of circle” responses, this parameter tended to be worse for the young subjects, reflecting a large variation. It was shown that young drivers could finish the tapping test faster but they were poorer in accuracy and carefulness, especially in the out-of-circle parameter.
CONCLUSION
target-95
attention (wrong number) in the peripheral field of view that simultaneously affected their performance of the right turn skill.
DRP and cognitive factors’ correlations were found only in the young and elderly drivers of group 1. TMT A and B as well as DRP, such as hazard monitoring, reappraisal, and avoidance influenced the young drivers to operate the brake or axle pedals for braking and acceleration while driving. TMT A could influence the elderly drivers (60 – 65 years old) to comply the traffic signs/lights. In contrast, the DRP, for instance hazard monitoring and task focus influenced maintaining the vehicle in the same lane of a straight line. Dislike risk of driving on the drivers of age 60-65 years would disturb their ability to turn right skills and braking/ acceleration. At the end, the drivers’ risk in avoiding the emergency situations on the highway could also affect their ability to perform braking and acceleration.
Regarding the physical motor skills’ factors, it was found that the errors occurred during tapping test were correlated with the ability to drive in the young drivers and elderly drivers of group 2 (> 65 years old). In young drivers, the error of tapping test affected their performance whenever there was a changing lane and avoiding over speed. In contrast, the ability to drive in the elderly group 2 (> 65 years) to keep no over speed was influenced by the speed of the tapping test.
CONFLICT OF INTEREST
There were no conflicts of interest reported by the authors.
ACKNOWLEDGEMENT
This research was supported in part by Directorate General of Higher Education, Ministry of National Education, Indonesia.
REFERENCES
1. WHO (World Health Organization), Core Health Indicators, Geneva, Switzerland, 2008.
2. Kantor, B., Mauger, L., Richardson, V. E., & Unroe, K. T., An analysis of an older driver evaluation program, Journal of the American Geriatrics Society, 2004, 52(8), 1326-1330.
3. Anstey, K. J., Wood, J., Lord, S., & Walker, J. G., Cognitive, sensory and physical factors enabling driving safety in older adults, Clinical psychology review, 2005, 25(1), 45-65.
4. Glendon, A., Dorn, L., Matthews, G., Gulian, E., Davies, D., & Debney, L., Reliability of the driving behaviour inventory, Ergonomics, 1993, 36(6), 719-726.
5. Owsley, C., Ball, K., McGwin Jr, G., Sloane, M. E., Roenker, D. L., White, M. F., & Overley, E. T., Visual processing impairment and risk of motor vehicle crash among older adults, Jama, 1998, 279(14), 1083-1088.
6. Matthews, G., Individual differences in driver stress and performance, Human Factor and Ergonomics Society Annual Meeting Proceeding, 1996, 5, 579 – 583.
7. Susilowati, I. H., & Yasukouchi, A., Cognitive characteristics of older Japanese drivers. Journal of physiological anthropology, 2012, 31(1),1-10.
8. B. Sekuler, P. J. B., Mortimer Mamelak, Allison, Effects of aging on the useful field of view, Experimental aging research, 2000, 26(2), 103-120.
9. Wood, J. M., & Mallon, K. Comparison of driving performance of young and old drivers (with and without visual impairment) measured during in-traffic conditions. Optometry & Vision Science, 2001,78(5), 343-349.
10. Edwards, J. D., Ross, L. A., Ackerman, M. L., Small, B. J., Ball, K. K., Bradley, S., & Dodson, J. E, Longitudinal predictors of driving cessation among older adults from the ACTIVE clinical trial, The Journals of Gerontology Series B: Psychological Sciences and Social Sciences, 2008, 63(1), 6-12. 11. De Raedt, R., & Ponjaert-Kristoffersen, I., Predicting at-fault car accidents of older drivers, Accident
96
12. Stutts, J. C., Stewart, J. R., & Martell, C., Cognitive test performance and crash risk in an older driver population, Accident Analysis & Prevention, 1998, 30(3), 337-346.
13. Odenheimer, G. L., Beaudet, M., Jette, A. M., Albert, M. S., Grande, L., & Minaker, K. L., Performance-based driving evaluation of the elderly driver: safety, reliability, and validity, Journal of Gerontology, 1994, 49(4), 153-159.
14. Tarawneh, M. S., McCoy, P. T., Bishu, R. R., & Ballard, J. L., Factors associated with driving performance of older drivers. Transportation Research Record, 1993, 1405, 64-71.
15. Stokx, L. C., & Gaillard, A. W., Task and driving performance of patients with a severe concussion of the brain, Journal of Clinical and Experimental Neuropsychology, 1986, 8(4), 421-436.
16. Daigneault, G., Joly, P., & Frigon, J.-Y., Executive functions in the evaluation of accident risk of older drivers, Journal of Clinical and Experimental Neuropsychology, 2002, 24(2), 221-238.