Research Article
CODEN: IJPNL6
ANALYTICAL METHOD DEVELOPMENT AND VALIDATION FOR
SIMULTANEOUS ESTIMATION OF NEBIVOLOL AND VALSARTAN IN
BULK AND PHARMACEUTICAL DOSAGE FORM BY RP-HPLC
METHOD
B. Siddartha
1*, I. Sudheer Babu
2, Ch. Ravichandra Gupta
3, C. Parthiban
11
Department of Pharmaceutical Analysis, Malla Reddy College of Pharmacy, Secunderabad,
India
2
Sir C.R.Reddy College of Pharmaceutical Sciences, Eluru, India
3
Suven Life Sciences Limited, Patancheru (Mandal), Medak (Dist), India
*Corresponding author e-mail: [email protected]
ABSTRACT
A simple, specific and accurate reverse phase high performance liquid chromatographic method was developed for the simultaneous determination nebivolol and valsartan in pharmaceutical dosage form. The using Altima C18 (4.6 x
150mm, 5µ) column in isocratic mode, with mobile phase containing phosphate buffer and acetonitrile (52:48 v/v) adjusted to pH 4.8 with dilute ortho phosphoric acid solution. The flow rate was 1.0 ml/ min and effluents were monitored at 282 nm. The retention times of nebivolol and valsartan were found to be 2.325 min and 5.172 min, respectively. The linearity for nebivolol and valsartan were in the range of 2.5-7.5μg/ml and 40-120μg/ml respectively. The recoveries of nebivolol and valsartan were found to be 100.04% to 101.36% and 99.86% to 101.62%, respectively. The proposed method was validated and successfully applied for the estimation of nebivolol and valsartan in combined tablet dosage forms.
Key words: Nebivolol, Valsartan, HPLC
INTRODUCTION
Nebivolol is chemically known as 1-(6-fluoro-3, 4- dihydro-2H-1-benzopyran-2-yl)-2-{[2-(6-fluoro-3,4-dihydro-2H-1-benzopyran-2-yl)-2-hydroxyethyl] amino}ethan-1-ol. It is a highly cardioselective vasodilatory beta1 receptor blocker used in treatment of hypertension. Nebivolol is a selective β1-receptor antagonist. Activation of β1-receptors by epinephrine increases the heart rate, blood pressure and the heart consumes more oxygen. Nebivolol blocks these receptors which reverses the effects of epinephrine, lowering the heart rate and blood pressure. In addition, beta blockers prevent the release of renin, which is a hormone produced by the kidneys which leads to constriction of blood vessels. At high enough
concentrations, this drug may also bind beta 2 receptors[1].
Valsartan is chemically known as (2S)-3-methyl-2-[N-({4-[2-(2H-1, 2, 3, 4-tetrazol-5-yl) phenyl] phenyl} methyl) pentanamido] butanoic acid. Valsartan is an ARB that selectively inhibits the binding of angiotensin II to AT1, which is found in many tissues such as vascular smooth muscle and the adrenal glands. This effectively inhibits the AT1-mediated vasoconstrictive and aldosterone-secreting effects of angiotensin II and results in a decrease in vascular resistance and blood pressure[2].
Different analytical methods have been reported in the literature for the assay of nebivolol in pharmaceuticals and include spectrophotometry, TLC, HPLC, HPTLC, LC-MS[3–19]. The present investigation reports a simple UV spectrophotometric
International Journal of Pharmacy
method for the analysis of nebivolol in bulk as well as in tablet dosage form. The developed method was validated as per ICH guidelines [20].
EXPERIMENTAL Reagents
Nebivolol and Valsartan were kindly supplied by Torrent Pharmaceutical Limited (Gujarat, India). Acetonitrile, water (HPLC grade, Merck) and all the other reagents of AR grade were purchased from M R Enterprisers. A capsule of NEBICARD-V(Torrent) containing 5mg of nebivolol and 80mg of valsartan. Instrumentation
The LC system consisted of a Waters model 515, PDA detector 2998 with 20 µL sample loop. The output signals were monitored and integrated using Empower 2 software.
Chromatographic conditions
The elution was isocratic with mobile phase consisting a mixture of buffer (accurately weighed and transferred 2.72gm of Potassium dihydrogen orthophosphate in a 1000ml of volumetric flask add about 900ml of milli-Q water added add 1ml of triethylamine and sonicate. finally make up the volume with water, then pH adjusted to 4.8 with dil. Ortho phosphoric acid solution) and acetonitrile (52 : 48 v/v). The mobile phase was filtered through a 0.45-µm (HVLP, Germany) membrane filter prior to use. An Altima C18 column (150 x 4.6mm x 5 µ) was
used for determination. The flow rate was 1.0 ml/min and the column was operated at ambient temperature (~25 oC). The volume of sample injected was 10 µL. Prior to injection of the solutions, column was equilibrated for at least 30min with mobile phase flowing through the system. The UV detector was set at wavelength of 282nm. A typical chromatogram of nebivolol and valsartan is shown in (Fig. 1).
Diluent: Methanol and Water (50:50) v/v
Standard Preparation
Accurately weighed and transferred 5mg of nebivolol and 80mg of valsartan working standards into a 100ml clean dry volumetric flask, add 70ml of diluents, sonicated for 30 minutes and make up to the final volume with diluents. From the above stock solution, 1ml was pipette out in a 10ml volumetric flask and then make up to the final volume with diluent to get concentration of 5μg/ml and 80μg/ml.
Sample Preparation
About20 tablets were taken and their average weight was calculated. The tablets were crushed to a fine
powder and drug equivalent to 5mg and 80mg were transferred to a 100 ml volumetric flask, dissolved in diluent. Transfer 1ml from the above solution into 10ml volumetric flask and filtered through 0.45μ membrane filter to get concentration of 5μg/ml and 80μg/ml.
METHOD VALIDATION
The developed method was validated as per ICH guidelines [13-14] for its accuracy, linearity, precision, specificity, robustness, ruggedness, limit of detection and limit of quantification by using the following procedures. The parameters are validated as shown in table 9.
System suitability
System suitability and chromatographic parameters w ere validated such as asymmetry factor, tailing factor and number of theoretical plates were calculated.
Linearity
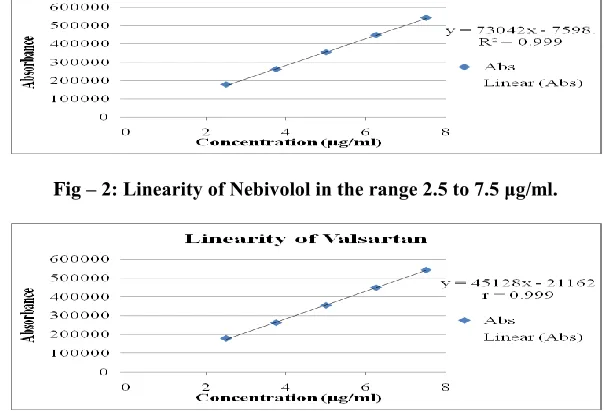
Linearity of this method was evaluated by linear regression analysis and calculated by least square method and studied by preparing standard solutions of tinidazole at different concentration levels. Absorbance of resulting solutions was measured and the calibration curve was plotted between absorbance vs concentration of the drug (Figure: 2 & 3). The responses were found to be linear in the range 2.5-7.5µg/ml and 40-120µg/ml for nebivolol and valsartan. The data was given in table 1.
Accuracy
Accuracy was performed in triplicate for various concentrations of tinidazole equivalent to 50%, 100% and 150% of the standard amount were injected into the HPLC system per the test procedure. The average % recovery was calculated. The data was given in table 2.
Precision
A) Method Repeatability
Six sample solutions of the same concentration (100%) were prepared and injected into the HPLC system as per test procedure. The results were given in table 3.
B) Intermediate Precision (Day to Day variability)
Limit of detection and Limit of Quantification
LOD and LOQ were calculated from the average slope and standard deviation from the calibration curve as per ICH guidelines. The LOD and LOQ of nebivolol were found to be 0.043µg/ml and 0.129µg/ml respectively. The LOD and LOQ of valsartan were found to be 1.534µg/ml and 4.648µg/ml.
Robustness and Ruggedness
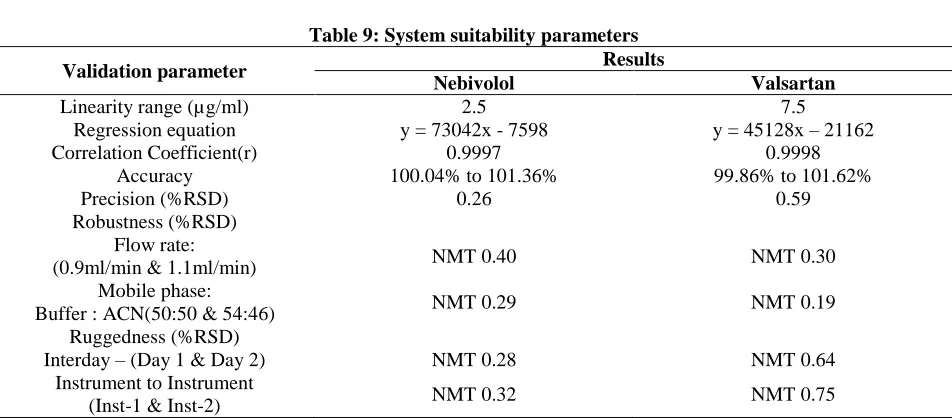
Robustness was done by small deliberate changes in the chromatographic conditions and retention time of tinidazole was noted. The factors selected were flow rate and variation in the mobile phase composition. The results remained unaffected by small variations in these parameters as shown in table 4 and 5. Ruggedness of the method was checked by using different days and instruments. The relative standard deviation of the results obtained from different days and instruments was <2.0%. The results were given in table 6 and 7.
Assay
The assay and percentage were calculated for NEBICARD-V with label claim 5mg and 80mg. The observed value was compared with that of standard value without interference from the excipients used in the tablet dosage form. The results were given in table 8.
RESULTS
A reverse-phase column procedure was proposed as a suitable method for the determination of nebivolol and valsartan dosage form. The chromatographic conditions were optimized by changing the mobile phase composition. Different ratios were experimented to optimize the mobile phase. Finally, buffer and acetonitrile in the ratio 52:48v/v was used as mobile phase, which showed good resolution of
nebivolol and valsartan peak. The wavelength of detection selected was 282nm, as the drug showed optimized absorbance at this wavelength. By our proposed method the retention time of nebivolol and valsartan were about 2.325mins and 5.172mins and none of the impurities were interfering in its assay.
DISCUSSIONS
The statistical analysis of data and the drug recovery data showed that the method was simple, rapid, economical, sensitive, precise and accurate. It can thereby easily adopt for routine quality control analysis. The results of this analysis confirmed that the proposed method was suitable for determination of drug in pharmaceutical formulation with virtually no interference of additives. Hence the proposed method can be successfully applied in estimation of nebivolol and valsartan in marketed formulation.
CONCLUSION
The proposed method is rapid, accurate and sensitive. It makes use of fewer amounts of solvents and change of set of conditions requires a short time. This method can be suitably analyzed for the routine analysis of nebivolol and valsartan in bulk and its tablet dosage forms. It does not suffer from any interference due to common excipients present in pharmaceutical preparation and can be conveniently adopted for quality control analysis.
ACKNOWLEDGEMENTS
The authors are thankful to Mallareddy College of pharmacy, Secunderabad for providing all facilities to complete the work and Torrent Pharmaceutical Limited for providing the nebivolol and valsartan as gift sample.
Fig – 2: Linearity of Nebivolol in the range 2.5 to 7.5 μg/ml.
Fig – 3: Linearity of Valsartan in the range 40 to 120 μg/ml. Table 1: Linearity data of Nebivolol and Valsartan
Nebivolol Valsartan
S.No Conc(μg/ml) Rt(mins) Area Conc(μg/ml) Rt(mins) Area
1 2.5 2.202 179382 40 4.702 1814217
2 3.75 2.247 262312 60 4.899 2665061
3 5.0 2.270 354840 80 5.015 3572162
4 6.25 2.281 448931 100 5.028 4468773
5 7.5 2.285 542582 120 5.050 5425156
r = 0.9997 y = 73042x - 7598
r = 0.9998 y = 45128x - 21162
Table 2: Accuracy data
Nebivolol Valsartan S.No Spiked
level
Amount added (µg/ml)
Amount present (µg/ml)
Average %Recovery*
Amount added (µg/ml)
Amount present (µg/ml)
Average %Recovery*
1(n=6) 50% 2.49 2.51 100.63 + 0.18 39.92 40.44 101.29 + 0.35
2(n=6) 100% 4.98 4.99 100.14 + 0.15 79.71 79.68 99.96 + 0.15
3(n=6) 150% 7.47 7.55 101.09 + 0.24 119.59 120.86 101.06 + 0.24
*n=3 (Average of 3 determinations)
Table 3: Precision data of Nebivolol and Valsartan
Nebivolol Valsartan
S.No Conc(μg/ml) Rt(mins) Area Conc(μg/ml) Rt(mins) Area
1 5 2.321 355342 80 5.15 3557561
2 5 2.325 357559 80 5.156 3528405
3 5 2.33 357025 80 5.17 3547014
4 5 2.33 355515 80 5.17 3557433
5 5 2.331 355906 80 5.172 3554056
6 5 2.337 357142 80 5.173 3505046
Mean 356415 3541586
Std.dev 941 20977
Table 4: Robustness data relating to change in flow rate (1.0ml/min)
Nebivolol Valsartan S.No Flow rate
(ml/min)
Average Peak Area*
Std.dev %RSD Average
Peak Area* Std.dev %RSD
1 0.9ml/min 353514 1427 0.40 3556637 10618 0.30
2 1.0ml/min 354283 925 0.26 3544909 6480 0.18
3 1.1ml/min 352768 1182 0.33 3557419 10154 0.29
*n=3 (Average of 3 determinations)
Table 5: Robustness data relating to change in mobile phase composition
Nebivolol Valsartan S.No Mobile phase variation
(%)
Average peak area*
Std.dev %RSD
Average peak area*
Std.dev %RSD
1 M.P-1
(Buffer:ACN:: 50:50) 353557 1001 0.28 3540204 6242 0.18
2 M.P-2
(Buffer:ACN:: 52:48) 354477 778 0.22 3545576 5919 0.17
3 M.P-3
(Buffer:ACN:: 54:46) 352589 1038 0.29 3554085 6820 0.19
*n=3 (Average of 3 determinations)
Table 6: Ruggedness data relating to change of day Inter-day precision
Day – 1 Day – 2 Peak area Peak area
S.No Conc (µg/ml) Nebivolol Valsartan Conc (µg/ml) Nebivolol Valsartan
1 5 355765 3559823 80 355366 3551209
2 5 357354 3568405 80 357432 3523405
3 5 357955 3541098 80 357025 3547632
4 5 355515 3557433 80 355642 3567918
5 5 355906 3554047 80 355906 3534056
6 5 357142 3505046 80 357238 3532018
Mean 356606 3547642 356435 3542706
SD 1005 22687 899 16086
%RSD 0.28 0.64 0.25 0.45
Table 7: Ruggedness data relating to change of instrument Instrument to Instrument
Inst – 1 Inst – 2 Peak area Peak area
S.No Conc (µg/ml) Nebivolol Valsartan Conc (µg/ml) Nebivolol Valsartan
1 5 355343 3562817 80 354787 3557843
2 5 357354 3587366 80 357432 3528753
3 5 357955 3572893 80 357025 3547632
4 5 355515 3557433 80 355323 3567918
5 5 355906 3554047 80 354906 3534056
6 5 357323 3508732 80 355135 3535612
Mean 356566 3557215 355768 3545302
Std.dev 1110 26634 1154 15287
Table-8: Results of analysis of laboratory samples (Assay)
Nebivolol Valsartan S.No Sample Label Amount
found %Purity + RSD*
Amount found
%Purity + RSD*
1 Brand-1
(NEBICARD-V ) 5mg/80mg 4.99 99.62 + 0.10 79.87 99.64 + 0.10
*n=3 (Average of 3 determinations) Table 9: System suitability parameters Validation parameter Results
Nebivolol Valsartan
Linearity range (µg/ml) 2.5 7.5
Regression equation y = 73042x - 7598 y = 45128x – 21162
Correlation Coefficient(r) 0.9997 0.9998
Accuracy 100.04% to 101.36% 99.86% to 101.62%
Precision (%RSD) 0.26 0.59
Robustness (%RSD) Flow rate:
(0.9ml/min & 1.1ml/min) NMT 0.40 NMT 0.30
Mobile phase:
Buffer : ACN(50:50 & 54:46) NMT 0.29 NMT 0.19
Ruggedness (%RSD)
Interday – (Day 1 & Day 2) NMT 0.28 NMT 0.64
Instrument to Instrument
(Inst-1 & Inst-2) NMT 0.32 NMT 0.75
REFERENCES
1. http://www.drugbank.ca/drugs/DB04861 2. http://www.drugbank.ca/drugs/DB00177
3. Shah DA, Bhatt KK, Mehta RS, Baldania SL Determination of Nebivolol Hydrochloride and Hydrochlorothiazide in Tablets by First-Order Derivative Spectrophotometry and Liquid Chromatography. J AOAC 2008; Int 5(91):1075–1082.
4. Kachhadia PK, Doshi AS, Joshi HS Development and validation of a stability-indicating column high-performance liquid chromatographic assay method for determination of nebivolol in tablet formulation. J AOAC 2008; Int 91(3):557–561.
5. Kamila MM, Mondal N, Ghosh LK, Gupta BK A validated UV spectrophotometric method for estimation of nebivolol hydrochloride in bulk and pharmaceutical formulation. Pharmazie 2007; 62 (7): 486-487.
6. Rajeswari KR, Sankar GG, Rao AL, Raju DB, Seshagiri Rao JVLN RP-HPLC Method for the Estimation of Nebivolol in Bulk and Pharmaceutical Dosage Form Asian. J. Chem 2005; 17(2): 1259-1263.
7. Sahoo M K, Giri RK, Barik CS, Kanungo SK, Ravi Kumar BVV RP-HPLC Method for the Estimation of Nebivolol in Tablet Dosage Form. E-Journal of Chem. 2009; 6: 915-919.
8. Reddy TS, Devi PS Validation of a high-performance thin-layer chromatographic method, with densitometric detection, for quantitative analysis of Nebivolol hydrochloride in tablet formulations. J of Planar Chrom 2007; 20:149-152.
9. Ramakrishna NV, Vishwottam KN, Koteshwara M, Manoj S,Santosh M, Varma DP Rapid quantification of nebivolol in human plasma by liquid chromatography coupled with electrospray ionization tandem mass spectrometry. J Pharm. Biomed. Anal 2005; 39:1006-1013.
10. Kokil SU, Bhatia MS, Simultaneous Estimation of Nebivolol Hydrochloride and Valsartan Using RP-HPLC. Indian Journal of Pharmaceutical Sciences 2009, 71(2), 111-114.
12. Shinde Sachin R, Bhoir Suvarna I, Pawar Namdev S, Yadav Suman B, Ghumatkar Ajay S, Bhagwat Ashok M, Simultaneous Determination of Valsartan and Nebivolol Hcl in Tablet Dosage Form by RP-HPLC. Asian Journal of Research in Chemistry 2009, 2(4), 519-522.
13. Jagadish S.Modiya, Chirag B.Pandya, K.P. Channabasavaraj, Simultaneous Estimation of Nebivolol Hydrochloride and Valsartan in Bulk and Capsule Dosage Form by Simultaneous Equation Method. International Journal of Chem Tech Research 2010, 2(3), 1387-1390.
14. Meyyanathan S.N, Arunadevi S. Birajdar, Bhojraj Suresh, Simultaneous Estimation of Nebivolol Hydrochloride and Valsartan and Nebivolol Hydrochloride and Hydrochlorothiazide in Pharmaceutical Formulation by UV Spectrophotometric Methods. Indian Journal of Pharmaceutical Education and Research 2010, 44(2), 156-159.
15. Ediga Sasi Kiran Goud, V.Krishna Reddy, RP-HPLC Validation of Related Substances of Nebivolol in bulk and 2.5/5/10/20mg Tablets. International Journal of Pharmaceutical Biological and Chemical sciences 2012, 1(2), 11-21.
16. Koseki N, Kawashita H, Hara H, Niina M, Tanaka M, Kawai R, Nage Y and Mauda N, Development and Validation of a Method for Quantitative Determination of Valsartan in Human Plasma by Liquid Chromatography-Tandem mass spectrometry. Journal of Pharmaceutical and Biomedical Analysis 2007, 43(5), 1769-1774.
17. Patel Satish Ambalal, Patel Hemant M, Development and Validation of HPTLC Method for Simultaneous Estimation of Nebivolol and Hydrochlorthiazide in Tablet. International Journal of Pharmaceutical Frontier Research 2012, 2(1), 28-38.
18. Sridevi Ramachandran, Badal Kumar Mandal, Sameer, Simultaneous Spectrophotometric Determination of Valsartan and Ezetimibe in Pharmaceuticals. Tropical Journal of Pharmaceutical Research 2011, 10(6), 809-815.
19. Macek J, Klima J and Ptacek P, Rapid Determination of Valsartan in human plasma by protein precipitation and HPLC. Journal of Chromatography B. Analytical Technologies in the Biomedical and Life Sciences 2006, 832(1), 169-172.