A Microblock Density-Based Similarity Measure for Graph
Clustering
Enli Zhang
*, Lin Gao
School of Computer Science and Technology, Xidian University, Xi’an, China.
* Corresponding author. Tel.:+08615887190810; email: [email protected] Manuscript submitted August 29, 2014; accepted February 8, 2015. doi: 10.17706/jcp.10.2.90-100
Abstract: Graph clustering is an important technique in data mining and network analysis, and it is widely used in chemistry, physics, biology, communication, and computer science. Similarities between vertices of a graph are the fundamental conditions for many hierarchical clustering algorithms. In the paper, we propose a new similarity measure based on microblock density, which computes the similarity between a pair of vertices by calculating the densities of their common adjacent microblock. This measure extends the scope and improves the discrimination of traditional measure, thus significantly improving the performance and stability of the similarity-based clustering algorithms. Experiments on synthetic data and real networks show that the density-based similarity approach accurately reflects the local structure of the graph and provides higher accuracy similarities for clustering and community structural detection algorithms than other state-of-the-art methods.
Key words: Microblock density, similarity measure, graph clustering.
1.
Introduction
In an information age, clustering analysis is becoming an ever more important daily tool for us to utilize useful information, and it attracts attentions from researchers and experts in such disciplines as mathematics, physics, sociology, biology, communications, and computer science. It is used to explore the underlying relationships among a collection of data by organizing them into homogeneous clusters. However, clustering analysis is an intractable subject because it is hard to reach consensuses on the definition of cluster itself and many problems remain to be solved, with some problems even proving to be NP-hard [1], [2]. Therefore, many heuristic clustering algorithms based on various techniques are developed, such as the hierarchical methods, partitioning methods, density-based methods, grid-based methods and other fitness optimizing methods. The surveys of clustering techniques are now available in literature [3]-[7].
There are many traditional clustering algorithms based on vertex similarity, and it is natural to assume that the vertices with high similarity should be grouped in the same cluster. Although there is no universal definition up-to-now, vertex similarity is an essential factor in the description of a cluster by most clustering algorithms. For a metric measure, the similarity function should typically satisfy the conditions of symmetry, positivity and triangle inequality:
1) The similarity of each pair vertices should be symmetrical with S v v( ,i j)S v v( , )j i ,
2) All the similarity should be positive with 0S v v( ,i j) 1 , and
( ,i j) ( ,i k) ( ,k j), ( ,i j) 1/ ( ,i j)
D v v D v v D v v D v v S v v .
Furthermore, the similarity between two vertices with identical neighborhoods should be equal to 1. All these conditions make the computation of such a similarity complicated, and in some cases it is more complex than the clustering. For data represented as a graph, there is no additional feature to measure other than the structural property of a graph, which makes the task very difficult.
In the paper, we discuss existing vertex similarity measures for graph clustering and propose a novel one which assesses the similarity between two vertices by fractioning their neighborhoods vertices into different densely connected blocks and measuring their connection strength to the common blocks, including the scale and density of the bocks. The new measure puts particular emphasis on the density of two vertices’ common adjacent block, which catches the nature of a cluster that is a densely connected vertex subset. It overcomes the low discrimination of local structure based measures and the high time complexity of global connectivity based measures. Experiments on real networks show that the density-based measure can reflect more accurately the local structure and provide higher accuracy similarities for graph clustering and community structural detection algorithms than other state-of-the-art methods.
The rest of this paper is organized as follows. Section 2 gives a brief overview of related similarity measures, with the necessary background given. Section 3 describes the proposed similarity measure in detail. In Section 4, a comparative analysis of the experimental results is made. Finally, Section 5 provides some concluding remarks and further research suggestions.
2.
Related Work
During the past decades, many vertex similarity measures based on various techniques have been developed, including spacial, structural, connective, physical and probabilistic measures [8-30]. Since no other features can be used to measure vertex similarity in the setting of graphs, all methods try to extract useful information from graph topology structure that underlies the vertex adjacency relationships. In this subsection, several most popular measures in graph clustering are introduced. More information about similarity techniques may be found in [6], [7].
2.1.
Euclidean Distance
For a graph, the most straightforward manner of measuring the similarity between two vertices is to treat vertices as points embedded in an n-dimensional space and compute the Euclidean distance as the dissimilarity, which is the L2-norm:
2 1
( , ) ( )
n
i j ik jk
k
D v v d d
. (1)Another popular distance is the Manhatan distance (L1-norm):
1
( , ) | |
n
i j ik jk
k
D v v d d
. (2)Commonly, the cosine similarity is used to convert the distance into angle in the spatial measure:
1
2 2
1 1
arccos
n ik jk k
ij n n
ik jk
k k
d d
d d
(3)
spectral clustering is widely used to project the data into low dimensional spectral space, which greatly reduces the dimension and improves the discrimination.
2.2.
Structural Measure
In some algorithms, the similarities between vertices are computed directly according to the local structure. Hennig and Hausdorf [9] suggest measuring only the intersection of their neighborhoods, which is based on the jaccard index [8]. It takes value from zero to one. The measure takes only their occurrence into consideration and overlooks their absence:
| ( ) ( ) | ( , )
| ( ) ( ) |
i j
i j
i j
N v N v
S v v
N v N v
(4)
Pearson correlation coefficient [10] is another commonly used structural measure, which measures the similarity by computing the Pearson correlation between the vectors of the adjacency matrix (L=I+A):
, , 1
( ) deg( ) deg( )
deg( ) deg( )( deg( ))( deg( ))
n
i k j k i j
k ij
i j i j
n l l v v
C
v v n v n v
(5)
These measures have a low discrimination because only similarities between neighborhoods are calculated with others being zero. Furthermore, the fundament properties of local structure, such as connectivity and density, are not taken into account.
2.3.
Connectivity Measure
The length of the shortest paths between a pair of vertices is a natural dissimilarity measure, but low discrimination restricts its application in practice, because all the neighbors have short distance without distinguishing inter or extra ones. Based on the Flow-theory, Hartuv and Shamir [12] propose a measure of vertex similarity by calculating the number of distinct paths between two vertices, based on the facts that all vertices of the same cluster are highly connected. This method is very successful when the cluster structure is neat with few inter-links. With increasing edges of inter-clusters, the similarity becomes degree dependent because each pair of vertices can get at least the distinct paths that equal their smaller degree.
2.4.
Resistance Measure
Suppose each edge of a graph carries a unit resistor, and then the graph becomes a simple resistance network, as shown in Fig. 1. Many clustering algorithms [13], [23] are based on the potential differences of the vertices by placing a battery between a source vertex and a sink vertex. However the selection of the source and sink vertices may greatly influence the clustering results. Once the source and sink vertices are selected, the potential differences can be easily analyzed by solving Kirchoff’s equations.
Fig. 1. Graph and Circuit: A sample graph becomes an electric circuit by adding a unit resistor to each edge and a battery to the net.
2.5.
Random Walk Measure
Laurie Snell [14] show that its properties are closely related to the resistance network. Based on some properties of random walks on graph, several important vertex similarities have been developed. Saerens and Coworkers [15] study and use the commute-time between a pair of vertices as the dissimilar measure, which is the average time for a random walker to run a reiteration trip between two vertices. White and Smyth[16] use the average steps for a walker to get a single trip from the source to the target. Palmer and Faloutsos [17] define a similarity measure based on the escape probability, which means the probability of the walker’s failure to come back after having reached the target vertex.
3.
Proposed Similarity Measure
Although graph clustering has a long history, there is no universal definition. In graph representation, the definition of a cluster should have the following factors:
1) It is a connected component;
2) The internal density is notably higher than that of the external clusters;
3) The similarity between each pair of vertices is “surprisingly” higher than that to external vertices, whether they are adjacent or not; and
4) All the vertices lie in a “local” area, where the shortest distance between any pair of vertices is very small. Generally speaking, a feasible similarity measure for graph cluster should catch these properties of a cluster. Unfortunately, no measures available meet all the requirements. Furthermore, density is also a critical factor for an applicable measure, which is the motivation behind our measure.
3.1.
Theory
As mentioned above, the similarity measure based on the neighborhoods of two vertices usually calculates only the number of common vertices and union size, and ignores the connectivity of the common vertices, as the left diagram in Fig. 2(A) shows. However, the two vertices are not necessarily directly connected in most situations, and such neglect might lead to similarity distortion and miss of the true cluster structure because there are no common vertices that can be counted at all. For a pair of vertices in a cluster, since they are in a local dense area, dense common blocks must exist in their direct or indirect neighborhoods, as the right diagram in Fig. 2(A) shows. When the two vertices are tightly connected to the same densely connected block, they are apt to turn up in the same cluster that the block belongs to, so they should have a higher similarity. It is the underlying principle of our similarity measure.
For each pair of vertices, there are three situations about their direct and indirect neighborhoods, as Fig. 2(B) illustrates. Firstly, two vertices belong to the same cluster with common adjacent vertices in their neighborhoods regardless of being directly connected or not. This situation is somewhat similar to that of the traditional structural measure and the similarity depends mainly on the joint vertices ratio. But we adopt the similarity function by taking the density of their common blocks into account. Furthermore, since two vertices lie near, there are many overlapping vertices in their l-neighborhoods, which may improve the similarity. For convenience, we refer to the neighborhoods of a vertex vi according to the length of the
shortest path between vertices and vi as direct, second, third and so on, Abbr. as l-neighborhoods.
Secondly, two vertices lie far apart without common direct adjacent vertices but with common blocks in their l-neighborhoods. It is the most important and common situation in calculating the similarity, which is the main extension to the traditional adjacent vertices based measure. It aims to find the densely connected common blocks nearby that are the potential cores of clusters. Although they are not directly connected, the similarity between them would be high if they are all tightly connected to the same dense common block. The higher the similarity is, the more eager they are to join the same cluster.
When l takes a large value, the distance between two vertices are so great that they often lie in different clusters, even all vertices of the graph are included in their l-neighborhoods. In practice, a large l value does no good but increasing computational complexity.
Fig. 2. Vertex neighborhoods and Clusters: (A). Direct and indirect neighborhoods of a pair of vertices and their common vertices and blocks (green dots). (B). Three situations about two vertices in the clusters and
their relationship to the common blocks (red rectangles).
3.2.
Definition
Based on the above concept, we define first a density coefficient of degree and recalculate the strength between a vertex and its blocked-neighborhoods, which is proportional to the links and the density of blocks,
Abbr. as c-Degree and written as:
2
2 1
l l m
i i i
k d c
k d
, (6)where ki is the number of links between the vertex and the i-th block, and di is the density of the i-th block. A
sample of the c-Degree computation is given in Fig. 3. As the block of a 3 vertices clique decomposes, the c-Degree of green vertex increases sharply, a proof that it is density dependant.
Fig. 3. Variation of c-Degree while the block with 3 vertices decomposing.
Suppose vertices vi and vj have m common blocks in their l-neighborhoods, and then the new similarity
function can be defined as:
, , 1
( , )
m i j i l j l
l
S v v c c
The density-based measure extends the traditional adjacent vertices based method by enlarging the scale of neighborhoods to l-step and introducing the density factor of common blocks, which may catch more properties of cluster. It takes values from zero to 1. Only when two vertices are connected to the same clique does the similarity between them get the maximum value 1. Since the cluster usually is a local component of a graph, a global similarity matrix is unnecessary and a local similarity matrix suffices for graph clustering. Therefore, the max depth of l-neighborhoods is no more than 5, typically being 2 or 3.
3.3.
Algorithm
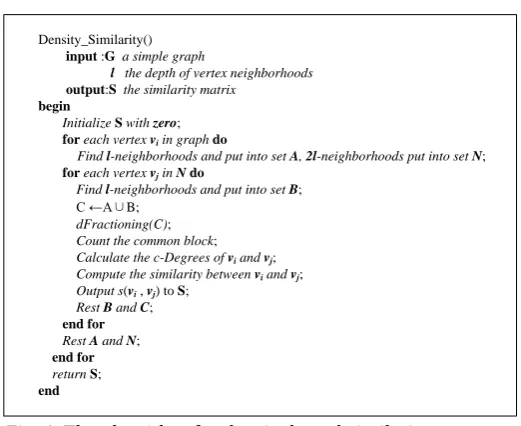
The main procedure of the density based similarity measure is described in Fig. 4. For each pair of vertices of a graph, it finds their l-neighborhoods, and then discomposes them into densely connected blocks and marks their common blocks. Once the blocks are marked, it is easy to recalculate their c-Degree
respectively. Naturally, the similarity is computed according to the c-Degrees between the two vertices and the common blocks. Finally, the program outputs the similarity matrix S.
Density_Similarity()
input :G a simple graph
l the depth of vertex neighborhoods
output:S the similarity matrix
begin
InitializeSwith zero;
foreach vertex vi in graph do
Find l-neighborhoods and put into set A, 2l-neighborhoods put into set N; foreach vertex vj inN do
Find l-neighborhoods and put into set B; C ←A∪B;
dFractioning(C);
Count the common block;
Calculate the c-Degrees of vi and vj;
Compute the similarity betweenvi and vj;
Outputs(vi,vj) to S;
Rest B and C; end for Rest A and N;
end for
return S;
end
Fig. 4. The algorithm for density based similarity measure.
In the algorithm, the function dFractioning() is a key step, which implements the decomposition of the
l-neighborhoods for each pair vertices. Although the size of the connected subset is generally very small, to partition the subgraph based on density is a hard task because both the problems of partitioning and density optimizing in a graph are NP-hard. Hence, the heuristic partition algorithm FM [18] is used to repeatedly partition the subgraph into dense blocks until the average density of the blocks does not increase further.
4.
Experimental Results
The proposed similarity measure is tested on the computer synthetic graphs and real complex networks, including the GN benchmark [19], Zachary’s network [20] and the PPI network of yeast [21]. A comparison of the similarity and clustering results by affinity propagation algorithm (AP) [22] is made with results given.
4.1.
Similarity Comparison
in Fig. 5. From the comparison follows an intuitional conclusion that the differences of vertex similarities between inter-cluster and intra-cluster are enlarged and the discrimination of the similarity measure is improved. For example, the green dotted vertices have a common similarity in Jaccard measure, while they are classified by cluster ownership in density measure.
1 2
1 1
1
2
2 2
3
3
3 3 3
3 3
3
3 3 3
3
Fig. 5. Comparison of the similarities of a simple graph between the density based measure and the Jaccard index measure.
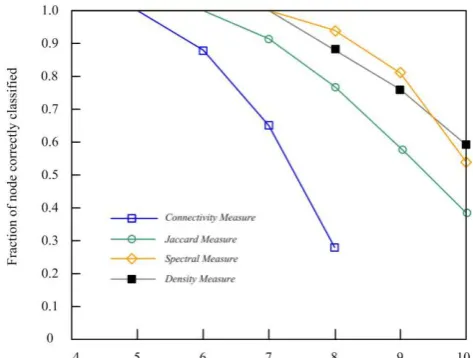
Fig. 6. Comparison of clustering results with AP algorithm based on different similarity measures.
4.2.
Clustering Comparison
For further test on the performance for graph clustering, the affinity propagation algorithm (AP), a classic similarity based clustering algorithm, is employed to cluster the vertices. Furthermore, a comparison between several similarity measures on the GN graphs is performed.
4.2.1.
GN benchmark
Girvan and Newman [19], [28] specially consider a group of known clusters (partitions) data in testing the performance of community detection algorithms, referred to as the GN benchmarks. In the standard GN benchmarks, each graph has 128 vertices formed in four groups (each group with 32 vertices) and each vertex has a fixed degree of 16. However, the probabilities of vertices linking to each other in a same cluster
pin and to vertices in different clusters pout can be adjusted according to test requirements. Here, the average
degree linked to external vertices for each vertex kout varies greatly from 4 to 12 and each group has 100
samples. The similarities of vertices for each graph are calculated based on betweenness, Jaccard, spectral and
density measures respectively.
As Fig. 6 shows, when kout takes a small value all measures can correctly classify the vertices. As kout
increases, the structures of clusters become unclear, and almost all measures begin to fail when kout
no measures can work properly because there maybe no cluster at all.
4.2.2.
Zachary’s network
The Zachary’s network is the members’ relationships of a karate club in the United States, which is a well-known test benchmark in community detection. As Fig. 7(a) shows, the club consists of 34 vertices, each vertex representing one member and each edge representing the interaction between two members in life. Because the club president (vertex of 34) has a conflict in fees with the instructor (vertex of 1), the club is separated into two natural groups in the end, one around president (circle points) and the other around instructor(square points). To detect the right positions of the two groups is the most interesting thing. Based on the density measure, the AP algorithm accurately classifies all the vertices into two groups. When the number of clusters reaches 4, two small subgroups of vertices appear as shown in Fig. 7(b), which satisfies the best composition in terms of the modularity Q [23].
Fig. 7. Clustering results of the Zachary’s karate club.
O cc up an cy ra io o f f un ct io na l p ro te in s
cl01 clo2 clo3 clo4 clo5 clo6 clo7 clo8 clo9 cl10 cl11 cl12 cl13 cl14 cl15
0.7 0.8 0.9 1.0 0.1 0.2 0.3 0.4 0.5 0.6 O cc up an cy ra io o f f un ct io na l p ro te in s
cl16 cl17 cl18 cl19 cl20 cl21 cl22 cl23 cl24 cl25 cl26 cl27 cl28 cl29 cl30
0.7 0.8 0.9 1.0 0.1 0.2 0.3 0.4 0.5 0.6
Fig. 8. Functional annotation of clusters: Each column represents a special functional category and its value equals the consistency ratio of a specific function in a cluster. A group of columns forms an ensemble of
functional categories in a cluster, which indicates multifunction of that module.
4.2.3.
PPI network
connected component of the PPI network of Sacchromyces cerevisiae is selected, which contains 1298 proteins and 3588 interactions. The modularity Q is employed to evaluate the qualities of the clusters in order to get a better clustering solution. The occupancy ratios of functional proteins in clusters are computed by comparing with the known modules and complexes in the MIPS database [24], which is a functional annotation scheme for systematic classification of proteins from whole genomes.
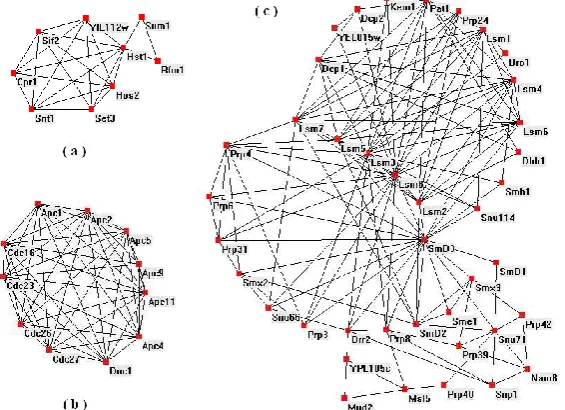
When the modularity Q reaches the value of 0.67, the algorithm finds 72 clusters. The consistency ratios of all functional categories over 50% in the top 30 clusters are shown in Fig. 8. It is difficult to directly compare the performance with other similarity measures because of the complexity of functional modules in PPI network. However, it is shown that many clusters are functional modules whose proteins have high consistency ratios of functional categories, and that many clusters have multiple functional categories, which is highly consistent with the facts. The structure of the three clusters is also illustrated in Fig. 9(a) and (b) being two smaller cliques with the sizes of 9 and 11 respectively, and (c) being a large cluster with 40 vertices. The annotation results show that each cluster is a meaningful functional module and its proteins are involved in the same functional process.
Fig. 9. Three examples of functional modules in clusters:(a) is a DNA chromatin module with 9 proteins; (b) is a proteins functional clique consisting of 11 proteins and all members have the same biological functions: mitotic cell cycle control, protein modification and ATP binding; and (c) is a large gene transcription module with 40 proteins, whose consistency ratio of functional category (11.04.03.01) reaches 83%.
5.
Conclusions
We present a similarity measure based on microblock density, which extends the traditional local structural based similarity measure by enlarging the scope and introducing local blocks’ density. It improves the discrimination of the local measures and decreases the time complexity of the global measures. The experimental results show that the density measure performs better than other traditional local connectivity based measures, and improves the quality of clustering result and the stability of algorithm. Application in community structural detection proves that the similarity based clustering algorithm can work well in network analysis, which further expands the researching domain of traditional clustering techniques. Therefore, it is promising to bridge the gap in performance between clustering analysis and network analysis by combining the advantages of the two.
Acknowledgements
presentation of this paper. The acknowledgement also gives to our colleagues at our research labs for useful comments and assistance.
References
[1] Macmillan Higher Education. (1979). Computers and Intractability: A Guide to the Theory of NP-Completeness (1st ed.). San Francisco, CA: M. R. Garey and D. S. Johnson.
[2] Jiri, S., & Satu, E. S. (Jun. 2005). On the NP-Completeness of some graph cluster measures.
arXiv:cs/0506100 [cs.CC].
[3] Sandro, V.-P., & José, R.-S. (2011). A survey of clustering ensemble algorithms. International Journal of Pattern Recognition and Artificial Intelligence, 25(3), 337-372.
[4] Pavel, B. (2006). A survey of clustering data mining techniques. Grouping Multidimensional Data: Recent Advances in Clustering, 25-71.
[5] Satu, E. S. (2007). Survey: Graph clustering. Computer Science Review, 1(1), 27-64.
[6] Rui, X. (2005). Survey of clustering algorithms. IEEE Transactions on Neural Networks, 16(3), 645-678. [7] Santo, F. (2010). Community detection in graphs. Physics Reports, 486, 75-174.
[8] Jaccard, P. (1901). Distribution de la flore alpine dans le bassin des Dranses et dans quelques regions voisines. Bulletin del la Société Vaudoisedes Sciences Naturelles, 37, 241–272.
[9] Hennig, C., & Hausdorf, B. (2006). Design of dissimilarity measures: A new dissimilarity measure between species distribution ranges. Data Science and Classification, Studies in Classification, Data Analysis, and Knowledge Organization, Germany, 29–38.
[10]Eisen, M., Spellman, P., Brown, P., & Botstein, D. (1999). Cluster analysis and display of genome-wide expression patterns. Proceedings of the National Academy of Sciences, 96, 10943.
[11]Capoccia, A., Servedioa, V., Caldarellia, G., & Colaiorib, F. (2005). Detecting communities in large networks.
Physica A: Statistical Mechanics and its Applications, 352(2–4), 669–676.
[12]Hartuv, E., & Shamir, R. (2000). A clustering algorithm based on graph connectivity. Information Processing Letters, 76(4–6), 175–181.
[13]Klein, D., & Randic, M. (1993). Resistance distance. Journal of Mathematical Chemistry, 12, 81-95.
[14]The Mathematical Association of America. (1984). Random Walks and Electric Networks. Washington, D.C.
[15]Fouss, F., Pirotte, A., Renders, J. M., et al. (2007). Random-walk computation of similarities between nodes of a graph, with application to collaborative recommendation. IEEE Transactions on Knowledge and Data Engineering, 19(3), 355-369.
[16]Princeton University Press. (2003). Small Worlds: The Dynamics of Net works between Order and Randomness (1st ed.). Princeton, USA.
[17]Palmer, C. R., & Faloutso, C. (2003). Electricity based external similarity of categorical attributes.
Proceedings of PAKDD: Vol. 2637 (pp. 486-500).
[18]Fiduccia, C. M., & Mattheyses, R. M. (1982). A linear-time heuristic for improving network partitions.
Proceedings of the 19th Conference on Design Automation (pp. 175-181).
[19]Girvan, M., & Newman, M. E. J. (2002). Community structure in social and biological networks.
Proceedings of the National Academy of Sciences, 99(12), 7821-7826.
[20]Zachary, W. W. (1977). An information flow model for conflict and fission in small groups. Journal of Anthropological Research, 33, 452-473.
[21]Spirin, V., & Mirny, L. A. (2003). Protein complexes and functional modules in molecular networks.
Proceedings of the National Academy of Sciences, 100(21), 12123-12126.
972-976.
[23]Newman, M. E. J. (2004). Finding and evaluating community structure in networks. Physical Review E, 69(2), 026113.
[24]Ruepp, A., Zollner, A., et al. (2004). The funcat, a functional annotation scheme for systematic classification of proteins from whole genomes. Nucleic Acids Res, 32, 5539–5545.
[25]Springer-Verlag GmbH. (1999). Graph clustering using distance-k cliques. Proceedings of the Seventh International Symposium on Graph Drawing.
[26]Pujol, J. M., béjar, J., & Delgado., J. (2006). Clustering algorithm for determining community structure in large networks. Physical Review E, 74, 016107.
[27]Cambridge University Press. (1994). Social Network Analysis: Methods and Applications, Cambridge. [28]Newman, M. E. J. (2003). The structure and function of complex networks. SIAM Review, 45, 167-256. [29]Chen, J.-C., & Yuan, B, (2006). Detecting functional modules in the yeast protein–protein interaction
network. Bioinformatics, 22(18), 2283-2290.
[30]Andrea, L., & Santo, F. (2012). Consensus clustering in complex networks. Scientific Reports, 2.
Enli Zhang received the B.S. degree in computer application in the Computer Science and Technology Department from Xi’an Technology Institute in 2001. He is currently working toward the Ph.D. degree in computer science at Xidian University.
His research interests include partitioning and clustering in VLSI circuit design, and the structure of complex network.
Lin Gao received the B.Sc. and M.Sc. degrees in computational mathematics from Xi’an Jiaotong University and Northwest University in 1987 and 1990, respectively, and the Ph.D. degree in circuit and system from the School of Electronic Engineering, Xidian University in 2003.