ISSN (e): 2250-3021, ISSN (p): 2278-8719
Vol. 08, Issue 11 (November. 2018), ||V (I) || PP 32-41
Behavior Analysis of a Medium High-Rise Building, Using
ETABS
Oliver C. Waka
1, Jian-Fei Lu
2, Shoaib Ahmed
31
Department of Civil Engineering, Jiangsu University, China
2Department of Civil Engineering, Jiangsu University, China 3Department of Civil Engineering, Jiangsu University, China
Corresponding Author: Oliver C. Waka
Abstract:
Construction of tall buildings for residential and commercial purposes has increased rapidly with the progress of construction technology. The structural design for these tall buildings entails the design for strength to ensure the safety of the structure and to satisfy the limit requirements of lateral displacement and storey drifts of the building. Hence, due to the heavy loadings, the analysis and design for stiffness requires the use of effective design methods. Thus, this paper uses the structural analysis software ETABS to analyze the effect of gravity and lateral loads on a medium high rise building. The vertical and lateral loads are applied to the structure. The building is then analyzed and designed for the applied loadings. Results of the analysis for different parameters including lateral displacement, storey drift, shear and bending moments are presented. The results of dynamic analysis (based on the Indian code of 1893) indicate that lateral displacement is within allowable limit; the building is effective in resisting the lateral forces induced by wind and earthquake. Thus, the significance of the study is easy to notice. The maximum lateral displacement obtained can be used as future data for assessing the safety and serviceability of the building.Keywords:
Analysis, ETABS, High rise, Lateral displacement, Storey drift--- --- Date of Submission: 11-11-2018 Date of acceptance: 22-11-2018 --- ---
I.
INTRODUCTION
The construction industry has made a significant progress in the residential development of city with limited land space. A large number of multi-storey reinforced concrete buildings with various functional uses have been constructed globally to maximize the use of limited available land space in populated regions. Most of the tall buildings in excess of 150 m in height are found in the Middle East. For example, the Burj Khalifa, which is 828 m in height, is considered the world’s tallest building and is located in Dubai(Poulos, 2016).
Meanwhile, the design and construction of these tall buildings present structural engineers with the challenges of new design methods, especially for the structural and geo-technical designs. Most of the traditional design methods require prior professional experience and manual calculations, thus can be inefficient and ineffective. Due to this, structural and geotechnical designers have to resort to more sophisticated analyses and design methodologies to overcome the complicacies involved in the traditional methods. Accordingly, structural engineers now use the structural analysis software ETABS to perform the analysis and design of various high rise buildings, while geo-technical engineers employ the CSI SAFE software to carry out the analysis and design of foundations for tall buildings.
seismic zone 4 with base isolation, where comparison of the analysis results including the forces, displacements, drifts, accelerations and shear at various levels of the building was carried out and presented.
Despite the large number of studies conducted using a variety of methods to analyze and design structures, published papers with the consideration of both the superstructure’s properties and the layered soil characters in the analysis and design of reinforced concrete structures under the action of axial and lateral loads can be seldom found in the literature. In this paper, the structural analysis software ETABS is used to analyze and design a G + 5 reinforced concrete residential building for vertical loads due to dead and live loads and horizontal loads due to earthquake and wind load. The response spectrum method is used for dynamic analysis. The foundation design software program CSI SAFE 2016 is utilized to carry out the analysis and design of the foundation for the building. Some design features of the building are described. Then, the model design and analysis procedure is explained. Finally, the model is analyzed and designed; the results of different parameters are presented.
II.
BUILDING DESCRIPTION
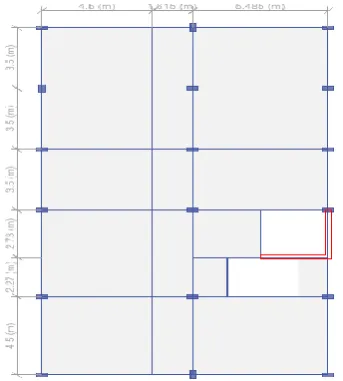
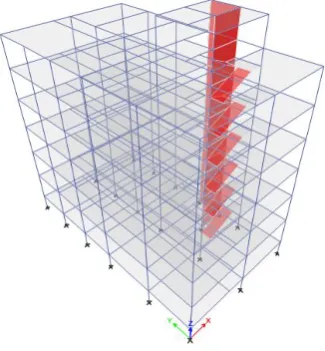
A G + 5 storey reinforced concrete structure is studied. The structure is a residential building that has an overall height of 22 m. Each of its storey has a height of 3 m. The building has a rectangular shape with an area of 239.3209 sq.-m. It is 20.23 m long by 11.8 m wide. The building taken under study is located in Monrovia, Liberia. The structural analysis software ETABS (2013) is used to design the building. ETABS is an acronym that stands for ―Extended three dimensional analysis of building system’’(Hussain et al., 2016b). It is especially more efficient for building design and offers sophisticated analysis and design for steel and concrete masonry structures such as school buildings, hospitals, and hotels as well as shopping malls. Its analysis is based on direct stiffness formulation and finite element methods. Typical Architectural plan of the model used in this study is depicted in Fig.1 and the 3-D View of the model is shown in Fig. 2
Figure 2:3-D View of the model 2.1 Definition of Parameters of Analyses
The Indian Standard building design code of practice, IS 456:2000, ―Building Code Requirements for Design and Construction of Plain and Reinforced Concrete Structures‖ is used for the design of the building’s gravity loads. The Gravity loads used in the model include the dead load of 3.0 (KN/m2) and the live loads of 1.5 (KN/m2), 2.0 (KN/m2), 2.5 (KN/m2), and 3.0 (KN/m2). The compressive strength of the concrete used is M30. The characteristic strengths of the Steel employed in the model are Fe 415 and Fe 500.
The building is designed for seismic. Seismic design of buildings is performed to increase the resistance capacity of the buildings against earthquake by using shear walls and moment resisting frames. The shear walls are made rigid by providing adequate damping to resist the amplitude of the motion produced by the earthquake. Shear walls have the advantage of reducing seismic force thereby enhancing the safety of the structure form. The Lateral design of the building was performed in accordance with the requirements of the IS code of 1893. The response spectra dynamic analysis method is used for Seismic analysis. The dynamic base shear is compared with the static base shear. Then, the dynamic base shear is upgraded by scaling it to the base shear forces obtained from static analysis. The basic wind speed is 33 m/s; the windward coefficient, Cp and the leeward coefficient, Cp are 0.8 and 0.5, respectively.
2.2 Loading
Loads that act on the building are classified into three categories as dead loads, live loads, and environmental loads. The dead loads are the self-weight of the structure (Hussain et al., 2016a). Dead loads are fixed in position and remained an integral part of the structure throughout the lifespan of the structure. The superimposed dead loads of the building are classified as the plastered ceilings, finished floors, conduits, electrical fixtures, and partitions. The live loads are the occupancy loads of a building. Unlike dead loads, live loads are not constant in position, and they are usually specified in building design codes. The loads are transferred to the building through a special medium. First, the loads are transmitted from the slabs to the beams then onto the supporting columns and to the footings before being transferred to the soil. The soil then distributes the loads uniformly to its surface.
In this section, the self-weight of the structure is considered as 3.75 KN/m2. The weight of the wall loading is 12 KN/m. The finished floor weight of loading is 1.5 KN/m2.
2.3 Design Requirements
Appropriate load combination is provided to account for long-term deflection and serviceability or cracking of concrete in reinforced concrete slabs. Punching shear reinforcement are checked for. The lateral storey displacement is limited to H/500, in which H is the height of each storey. The lateral storey displacement is calculated in compliance with the IS code of 1893 (Part I) 2002
2.4 Load Combinations Combo 1
1.5 DL
1.5 DL + 1.5 LL
1.2 DL + 1.2 LL + 1.2 WLy 1.2 DL + 1.2 LL - 1.2 WLy 1.5 DL + 1.5 WLx
1.5 DL - 1.5 WLx 1.5 DL + 1.5 WLy 1.5 DL - 1.5 WLy 0.9 DL + 1.5 WLx 0.9 DL - 1.5 WLx 0.9 DL + 1.5 WLy 0.9 DL - 1.5 WLy
1.2 DL + 1.2 LL + 1.2 EQx 1.2 DL + 1.2 LL - 1.2 EQx 1.2 DL + 1.2 LL + 1.2 EQy 1.2 DL + 1.2 LL - 1.2 EQy 1.5 DL + 1.5 EQx
1.5 DL - 1.5 EQx 1.5 DL + 1.5 EQy 1.5 DL - 1.5 EQy 0.9 DL + 1.5 EQx 0.9 DL - 1.5 EQx 0.9 DL + 1.5 EQy 0.9 DL - 1.5 EQy
Combo 2
1 DL 1 DL + 1 LL
1 DL + 0.8 LL + 0.8 WLx 1 DL + 0.8 LL – 0.8 WLx 1 DL + 0.8 LL + 0.8 WLy 1 DL + 0.8 LL – 0.8 WLy 1 DL + 1 WLx
1 DL - 1 WLx 1 DL + 1 WLy 1 DL - 1 WLy
1 DL + 0.8 LL + 0.8 EQx 1 DL + 0.8 LL – 0.8 EQx 1 DL + 0.8 LL + 0.8 EQy 1 DL + 0.8 LL – 0.8 EQy 1 DL + 1 EQx
1 DL - 1 EQx 1 DL + 1 EQy 1 DL - 1 EQy
Combo 1 is the factored load combination used for the design, and Combo 2 is the un-factored load combination used for foundation sizing and serviceability of the structure.
After running the analysis, ETABS indicates red on any column or beam that suffers structural deficiency. The red shows that such column or beam is overstressed. The overstressed problem can be resolved by redesigning the column or beam to a much greater size or by simply orientating such column or beam. After redesigning the column or beam, the overstressed problem disappeared. When the overstressed problem is removed, the column or beam is now considered structurally safe for use. Typical Column and Beam sizes are shown in Table1.
Table 1: Dimensions and reinforcement of structure elements Structural element Dimension (mm) Reinforcement
Beams 300 x 400
20
Columns 300 x 400
20
In this section, the building is analyzed and designed by using the ETABS program. As mentioned earlier, the software is an advanced package used for structural analysis and design of concrete structures including commercial buildings as well as residential buildings. Among the available design software, this program has the advantage of being efficient and effective for the analysis and design of buildings.
In preparation for the analysis process of the building, the ETABS model is lunched to receive inputted data. Then, the grid system, numbers of storeys, and typical storey height as well as modelling materials are defined, respectively. Next, Slab thickness, beam and column sizes are defined. Dead load, live load, superimposed dead load as well as wind load and earthquake load are defined and assigned. Load cases and load combination are defined. Finally, the building is analyzed for wind and seismic analyses and then designed accordingly.
IV.
FOUNDATION DESIGN
The selection of the type of foundation to support a tall building involves the consideration of some factors that may influence the foundation type. Some of the factors considered in the selection process include the bearing capacity of soils, type of structure, distribution of loadings, durability requirements and construction costs. In civil engineering, when the bearing capacity of the soil is weak and not suitable for a shallow raft/mat foundation system, the building is supported on pile foundation, either single piles or pile groups, usually placed beneath columns and load bearing members. Many tall buildings supported on pile foundation are constructed with thick basement slabs, and it is assumed that in such case the basement slab does not carry any of the foundation loads. Therefore, a piled raft foundation can be used to satisfy the bearing capacity and settlement criteria. A piled raft foundation is defined as a system in which both the piles and the raft share the applied structural loadings(Poulos, 2016).
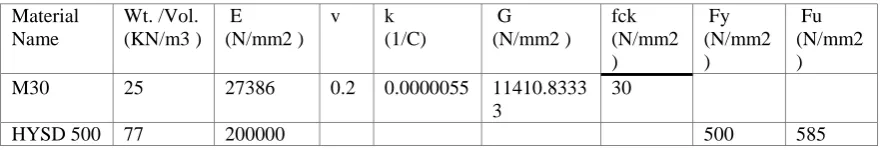
However, a medium high-rise building can be supported on a raft (mat) foundation. A raft (mat) foundation can develop adequate resistance to horizontal and moment loadings and can thus be suitable for buildings with moderate height. Hence, in this paper, the foundation is designed as a raft (mat) foundation. The foundation design software program SAFE 2016 (CSI 2016) is used for the analysis and design of the foundation system. The footing thickness is determined based on the long-term deflection criterion and punching shear strength requirements as given in the Indian standard design code, IS 2000. Based on SAFE 2016 analyses, the typical RC design requires a footing thickness of 900 mm to satisfy design criteria. The concrete and steel parameters used for the analysis and design of the footings are presented in Table 2; where E, v, k and G represent the Young’s modulus, Poisson’s ratio, Coefficient of thermal expansion and shear modulus, respectively. Also, fck, fy and fu denote the concrete cube compressive strength, Minimum yield and tensile stresses of steel accordingly.
Table 2: Design Parameters
Material Name Wt. /Vol. (KN/m3 ) E (N/mm2 )
v k
(1/C) G (N/mm2 ) fck (N/mm2 ) Fy (N/mm2 ) Fu (N/mm2 )
M30 25 27386 0.2 0.0000055 11410.8333
3
30
HYSD 500 77 200000 500 585
4.1 Soil equations
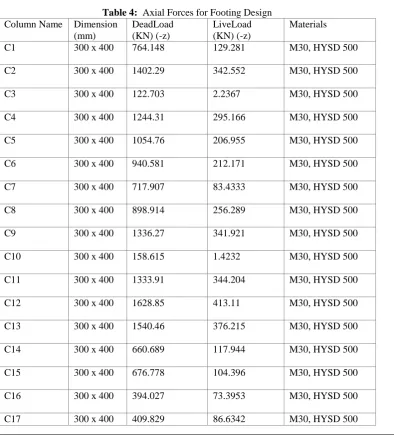
Calculations of the subgrade modulus of the soil and the strip width of the column are performed in equations 1 and 2 respectively; values of the soil parameters are presented in Table 3. Then, the design axial forces generated by the ETABS software and used in conjunction with the soil parameters to determine the footing thickness in safe 2016 analysis, are shown in Table 4. Fig.3 shows the simple foundation plan considered in the analysis.
The Subgrade Modulus equation which relates the bearing capacity of the soil and the settlement at a point in the soil with the superstructure–soil interface tractions is given by:
1
300
0.01
Subgrade Modulus
3
( )
30000
/
Subgrade Modulus E
KN m
( )
SBC
Subgrade Modulus E
ASm
Where, SBC is the soil bearing capacity, and ASm is the allowable settlement.
Calculation of Column Strip Width:
Column Strip width = 0.25L1 or L2, whichever is less 2
Column Strip width = 0.25L1
Column Strip width = 0.25(11.6)
Column Strip width = 3 m
Where, L1 and L2 are the width and length of the building, respectively. L1 is 11.6 m and L2 is 20 m.
Table 3: Soil Parameters SBC
(KN/m2 ) E (KN/m3 )
ASm (m)
CSw (m)
300 30000 0.01 3
Table 4: Axial Forces for Footing Design Column Name Dimension
(mm)
DeadLoad (KN) (-z)
LiveLoad (KN) (-z)
Materials
C1 300 x 400 764.148 129.281 M30, HYSD 500
C2 300 x 400 1402.29 342.552 M30, HYSD 500
C3 300 x 400 122.703 2.2367 M30, HYSD 500
C4 300 x 400 1244.31 295.166 M30, HYSD 500
C5 300 x 400 1054.76 206.955 M30, HYSD 500
C6 300 x 400 940.581 212.171 M30, HYSD 500
C7 300 x 400 717.907 83.4333 M30, HYSD 500
C8 300 x 400 898.914 256.289 M30, HYSD 500
C9 300 x 400 1336.27 341.921 M30, HYSD 500
C10 300 x 400 158.615 1.4232 M30, HYSD 500
C11 300 x 400 1333.91 344.204 M30, HYSD 500
C12 300 x 400 1628.85 413.11 M30, HYSD 500
C13 300 x 400 1540.46 376.215 M30, HYSD 500
C14 300 x 400 660.689 117.944 M30, HYSD 500
C15 300 x 400 676.778 104.396 M30, HYSD 500
C16 300 x 400 394.027 73.3953 M30, HYSD 500
C18 300 x 400 781.993 167.889 M30, HYSD 500
Figure 3: Foundation Plan
V.
RESULTS AND DISCUSSIONS
5.1 Lateral Displacement
Fig. 4 depicts the graphical representation of lateral displacement due to wind loads in X and Y direction. As shown in fig.4, the higher lateral displacement occurs at upper level above 4th floor in X direction and above 6th floor in Y direction. Furthermore, the lateral displacement and storey drift as shown respectively, in Figs. 4 and 5 are obtained in compliance with the allowable story drift limit of IS 1893 (Part I) 2002.
Figure 4: lateral displacement in X and Y direction (wind loads)
Fig. 5 shows the graphical representation of storey drift in X and Y direction due to seismic action. From the storey drift in X and Y direction, it is clearly seen that the higher storey drift appears at upper level above 4th floor in X direction and above the same 4th floor in Y direction.
Figure 5: Story drift in X and Y direction (Seismic)
From the graphical depiction thereof as presented in Figs. 4 and 5, it is easy to notice that the lateral storey displacement is in the allowable limit of H/500 as per IS 1893 code, and the building is safe for use.
5.3 Shear and Bending Moment Diagrams
Figs. 6(a) and 6(b) show diagrams of the shear and bending moment developed in the structure. The diagrams and forces are automatically generated by the analysis and design software, ETABS. The automatic generation of these forces, rebar and their sizes makes ETABS the most preferable design software among other design software. By using the generated shear, moment diagrams and bar sizes, structural engineers become extremely efficient in the execution of structural projects. Thus, the use of this software to perform analysis and design of tall buildings demonstrates effective results and significant reductions in processing times when compared with the use of traditional analysis and design methods. It gives structural engineers the advantage to deliver projects more efficiently and effectively compared to the traditional method which is time consuming.
Figure 6(a):SFD in Beam Figure 6(b):BMD in Beam
The punching shear strength of the footing is designed in accordance with the long-term deflection criterion requirements of the Indian standard design code, IS 2000. The shear, bending moment and punching shear diagrams are shown in figs. 7a, 7b, and 7c respectively. In addition, the slab reinforcement plan and slab crack width as well as the slab details and by the foundation design software Safe 2016, are presented in Figs. 8a, 8b and 8c, respectively.
Figure 7(a):SFD in slabFigure 7(b):BMD in SlabFigure 7(c):Punching shearin slab
Figure 8(a): SlabReinforcement Figure 8(a):Crack width of slab Figure 8(a):Slab detail plan
VI. CONCLUSION
In the present study, a G + 5 reinforced concrete residential building is analyzed and designed for the effect of vertical and horizontal forces acting on the building. The design software ETABS 2013 is used for the analysis. The results of dynamic analysis (based on the Indian code of 1893) show that the structure is safe to resist lateral forces. The advantage of the analysis technique used in the study is that it is efficient and effective for building analysis and design. Structural analysis results for gravity and lateral forces can be obtained more quickly with accuracy as well as the design for the forces. This method of analysis saves time and produces accurate analysis results better than the traditional method of analysis, which is time consuming and ineffective. Thus, it is clearly seen that in this modern era, where construction and design have become so much competitive and tall structures have continued to climb higher heights facing heavy loading effects due to vertical and lateral loads, the use of the traditional system of analysis for the design of tall buildings is no longer sufficient. ETABS is the way forward.
REFERENCES
[1]. HUSSAIN, R. R., WASIM, M. & HASAN, S. 2016a. Introduction to ETABS ETABS. Computer Aided Seismic and Fire Retrofitting Analysis of Existing High Rise Reinforced Concrete Buildings. Springer. [2]. HUSSAIN, R. R., WASIM, M. & HASAN, S. 2016b. Structural Evaluation for Gravity Loads. Computer
Aided Seismic and Fire Retrofitting Analysis of Existing High Rise Reinforced Concrete Buildings. Springer.
[4]. SÜLEYMANOĞLU, H., UZEL, A. & ARSLAN, G. 2018. Use of post-tensioned concrete slabs for sustainable design of buildings. High Tech Concrete: Where Technology and Engineering Meet. Springer.
[5]. SUTHAR, D. B., CHORE, H. & DODE, P. 2015. Comparative Analysis of High Rise Building Subjected to Lateral Loads and Its Behavior. Advances in Structural Engineering. Springer.
[6]. TUN, M. A., TIN, T. W. & NYAN, M. K. 2008. Analysis and Design of Reinforced Concrete Structures with Spring Base Isolation.