R E S E A R C H
Open Access
Stochastic block models with multiple
continuous attributes
Natalie Stanley
1,2*, Thomas Bonacci
3, Roland Kwitt
4, Marc Niethammer
5and Peter J. Mucha
6*Correspondence: [email protected]
1Curriculum in Bioinformatics and Computational Biology, University of North Carolina at Chapel Hill, Chapel hill, USA
2Present address: Stanford University, Stanford, USA Full list of author information is available at the end of the article
Abstract
The stochastic block model (SBM) is a probabilistic model for community structure in networks. Typically, only the adjacency matrix is used to perform SBM parameter inference. In this paper, we consider circumstances in which nodes have an associated vector of continuous attributes that are also used to learn the node-to-community assignments and corresponding SBM parameters. Our model assumes that the attributes associated with the nodes in a network’s community can be described by a common multivariate Gaussian model. In this augmented, attributed SBM, the objective is to simultaneously learn the SBM connectivity probabilities with the multivariate Gaussian parameters describing each community. While there are recent examples in the literature that combine connectivity and attribute information to inform community detection, our model is the first augmented stochastic block model to handle multiple continuous attributes. This provides the flexibility in biological data to, for example, augment connectivity information with continuous measurements from multiple experimental modalities. Because the lack of labeled network data often makes community detection results difficult to validate, we highlight the usefulness of our model for two network prediction tasks: link prediction and collaborative filtering. As a result of fitting this attributed stochastic block model, one can predict the attribute vector or connectivity patterns for a new node in the event of the
complementary source of information (connectivity or attributes, respectively). We also highlight two biological examples where the attributed stochastic block model provides satisfactory performance in the link prediction and collaborative filtering tasks.
Keywords: Stochastic block model, Networks, Community detection, Attributes
Introduction
Uncovering patterns in network data is a common pursuit across a range of fields, such as in biology (Larremore et al.2013), medicine (Aghaeepour et al.2017; Guinney et al.2015) and computational social science (Greene and Cunningham 2013). Community detec-tion is a powerful algorithmic way to understand the large-scale structural organizadetec-tion of a network (Porter et al. 2009; Leskovec et al.2010; Shai et al. 2017; Fortunato2010; Fortunato and Hric2016). In this pursuit, the objective is to identify cohesive groups of nodes with relatively high density of within-group connections and fewer between-group connections. Numerous approaches exist to accomplish this task, but typically only the adjacency matrix encoding connectivity patterns is taken into account. In various appli-cations, each node in a network is equipped with additional information (or particular
attributes) that was not implicitly taken into account in the construction of the net-work. For example, in a protein interaction network, each protein could contain multiple experimental measurements or classifications.
Significant attention has been given to the interplay between connectivity-based (or structural) community organization of the network and the attribute information of nodes within communities (Bothorel et al.2015). Importantly, it is often unclear whether it is valid to assume that a structural community should necessarily correlate with an attribute-basedfunctional community (Hric et al. 2016; Peel et al. 2017; Yang and Leskovec 2015). While such studies suggest that extreme caution should be taken in assuming a correlation between structural and functional communities, we limit our focus in the present work to the assumption that a node’s connectivity and attribute pat-terns can be jointly modeled based on its community assignment. In other words, we seek to develop an approach to assign nodes to communities based jointly on both sources of information, such that a community is defined as a group of nodes with similar connec-tivity and attribute patterns. In doing so, our objectives are three-fold: first, we develop a probabilistic approach to jointly model connectivity and attributes; second, we wish to ensure that our model can handle multiple, continuous attributes; third, we demonstrate the utility of the fitted model for link prediction and collaborative filtering applications.
The rest of this paper is organized as follows. This section includes subsections on related work in attributed networks and stochastic block models, as background. We then describe our model and associated inference procedure in “Model” section. In “Synthetic data results” section, we demonstrate the behavior of the model fitting syn-thetic data. We then apply the model for the tasks of link prediction and collaborative filtering in “Using the fitted attributed SBM for link prediction and collaborative filtering” section, followed by applications in biological networks examples in “Applications in biological networks” section.
Related work in attributed networks
connectivity and attributes allows for a partition of nodes to communities that aligns better with ground truth than that obtained using connectivity or attributes in isolation.
Alternatively, there are a variety of probabilistic approaches for handling attributed net-work data (Newman and Clauset2016; Hric et al.2016; Peel et al.2017; Yang et al.2013). Similar to our work in the sense that community membership is related to node attributes is CESNA (Yang et al.2013). The objective in this approach is to learn a set of propen-sities or affiliations for each node across all possible communities, such that two nodes with similar propensities towards communities should have more in common in terms of connectivity and attributes. In this model, each node has a vector with multiple binary attributes. The affiliation model is useful and flexible because it does not enforce a hard partitioning of nodes into communities, which is useful in social network applications. In this inference problem, the connectivity and attribute information are used to infer a node’s affiliations to communities and then models the probability of an edge between two nodes as a function of the similarity in their community affiliation propensities.
In contrast to the affiliation model, the stochastic block model (Snijders and Nowicki 1997) (at least the more standard variants of it), seeks to determine a hard partition of nodes across communities and models edges between a pair of nodes according to their community assignments. The partition of nodes to communities through a stochastic block model framework is accomplished through maximum likelihood optimization. A variant of the stochastic block model explored by Newman and Clauset (Newman and Clauset2016) adapts the classic stochastic block model to handle a single (possibly con-tinuous) attribute with the assumption that attributes (referred to as ‘metadata’) and communities are correlated. Importantly, the Newman and Clauset approach does not assume any particular form for the corresponding mixture model, expressing the model as a series expansion in Bernstein polynomials whose coefficients are inferred as part of the algorithm. In contrast, in order to most simply simultaneously include multiple con-tinuous attributes in our model, we make particular assumptions about the underlying mixture model, demonstrating the utility of our approach by way of the applications con-sidered below. As the geometry of attribute data in high dimensions can be highly variable across datasets, having more than one attributed stochastic block model is advantageous. For example, in a dataset with multiple attributes one could apply principal component analysis (PCA) to the data to determine how many principal components are needed to capture a suitable amount of variance in the data. If only a single component is needed, then the Newman and Clauset approach is a very suitable choice. If more principal com-ponents are needed to capture sufficient variation in the data, our approach can be very useful. Further work is needed to define how to best use the geometry of the attribute space to apply the most appropriate version of the attributed SBM, but this is beyond the scope of this paper.
the attributes are used to build a prior for node-to-community assignments (Newman and Clauset2016), the SBM adaptation by Peel et al. learns whether a node’s community assignment should be chosen through inference or should be fixed as its metadata label.
The model that we seek to develop in this work is distinguished by its ability to fit a stochastic block model to undirected networks where each node has multiple continu-ous attributes. We assume that attributes are some complementary source of information from the data used to specify connectivity between nodes. This model is most appro-priate for situations where a node’s community membership determines its connectivity (e.g. traditional SBM) and attribute information. While the model proposed by New-man et al. can accommodate continuous attributes (NewNew-man and Clauset2016), we view our contribution as a method to consider multiple continuous attributes simultaneously and to learn a generative model that describe the multidimensional attribute vectors across communities. We model the multidimensional attribute vectors for each non-overlapping community by a particular multivariate Gaussian model, which allows us to sample attributes from the model (in the case of missing attributes) or to understand the consensus mean and covariance for members of a community. We highlight two applica-tions of our attributed SBM in “Applicaapplica-tions in biological networks” section, to a protein interaction network and a microbiome subject similarity network. Before discussing these examples, we first define our attributed SBM and an inference technique for fitting the model. We test this approach on a synthetic example. Since community detection meth-ods are often difficult to validate due to the lack of ground truth information on the nodes, we describe the tasks of link prediction and collaborative filtering to quantify how well the attributed SBM represents the data. We then consider these tasks on two biological network examples.
Stochastic block models
Because our model is an extension to the widely-used stochastic block model (Snijders and Nowicki1997), we provide a brief introduction here. This model assumes that edges within a community are connected within and between communities in a characteris-tic or probabilischaracteris-tic way. To fit this model to network data, the objective is to partition the nodes into communities such that these assignments maximize the likelihood of the model according to the observed edges. In this inference problem for a network with
N nodes and K communities, one learns aK ×K probability matrix,θ, describes the probability of connections within and between communities, and anN-length vector of node-to-community assignments,z. For a network withNnodes,Kcommunities, adja-cency matrix,A= {aij}and a learned vectorzof node-to-community assignments, the SBM without degree correction (degree-corrected versions also exist Karrer and Newman (2011)) models an edge between nodesiandjwith
aij∼Bernoulli(θzizj) (1)
Model Objective
We seek to incorporate both connectivity(A)and attribute information(X)to infer node-to-community assignments,Z. Note that for a network withNnodes,Kcommunities and
pmeasured attributes,A= {aij},X= {xip}, andZ= {Zik}have dimensionsN×N,N×p andN×K, respectively. In particular, we distinguishZto be a binary indicator matrix, where entryZicis 1 if and only if nodeibelongs to communityc, whereas we also definez to be the equivalentN-dimensional array labeling node-to-community assignments. We assume connectivity and attributes are conditionally independent, given the community membership label. The graphical model for the relationship between node-to-community labels, connectivity and attribute information is shown in Fig.1.
To infer theZthat best explains the data, we adopt a likelihood maximization approach. That is, we seek to find the partition of nodes to communities that best describes the observed connectivity and attribute information. Given the conditional independence assumption ofXandA, we can express the log likelihood of the data,Las the sum of connectivity and attribute log likelihoods,LAandLX, respectively, as
L=LA+LX . (2)
This likelihood reflects the joint distribution of the adjacency matrix,A, the attribute matrix,X, and the matrix of node-to-community indicators,Z; formally, we have
L=p(A,X,Z) . (3)
Given thatZis a latent variable that we are trying to infer, we can approach the prob-lem using the expectation maximization (EM) algorithm (Dempster et al.1977). By doing this, we will alternate between estimating the posterior probability that a node i has community labelc, or
p(Zic=1|X,A) (4)
and estimates for θ,, which specify the adjacency matrix and attribute matrices, respectively.
Attribute likelihood
For a network with K communities, we assume that each particular community i
has an associated p-dimensional mean μi and p × p covariance matrix, i. Note
that these parameters uniquely identify a p-dimensional multivariate Gaussian distri-bution. To specify this model for all K communities, we define the parameter = {μ1,μ2,. . .μk,1,2,. . .K}.
The log likelihood for the mixture of Gaussians on the attributes is written as,
log(p(X|))=
N
i=1 log
K
c=1
πcN(xi|μc,c)
(5)
Here,N(xi | μc,c)is the probability density function for the multivariate Gaussian andπcis the probability that a node is assigned to communityc.
Adjacency matrix likelihood
For the adjacency matrix,Aand theK×Kmatrix of stochastic block model parameters, θ, Daudin et al. showed (Daudin et al.2008) that the complete data log likelihood can be expressed as
log(P(A|Z))= 1
2
i=j
k,l
ZikZjl[aijlog(θkl)
+(1−aij)log(1−θkl)] .
(6)
Inference
To use EM (Dempster et al.1977) to maximize the likelihood of the data, we break the process into the E-step and M-Step, and perform this step sequence iteratively until the estimates converge.
E-Step.During the E-step, we use the current value of learned model parameters,θ andto compute the posterior given in Eq. (4) at each step. The posterior at each step, γ (Zic), of nodeibelonging to communityc, is given by
γ (Zic)=p(Zic=1|xi,ai)
= p(xi|Zic=1)p(ai|Zic=1)πc
K
k=1p(xi|Zik =1)p(ai|Zik =1)πk
. (7)
Here,xi andaidenote the attribute and connectivity patterns for nodei, respectively. In particular,aiis theith row of the adjacency matrix,A. Therefore, thejth entry ofaiis 1 if nodesiandjare connected and 0 otherwise.
M-Step.In the M-step, we can compute updates forθandusing this expectation. Since the attributes follow a Gaussian mixture model, the update for the mean vector describing communityc,μc, can be computed using the EM algorithm (Dempster et al. 1977) as
μc= N
i=1γ (Zic)xi
N i=1γ (Zic)
. (8)
Similarly, the update for the covariance matrix describing a community,c, is computed as
c=
N
i=1γ (Zic)(xi−μc)(xi−μc)T
N
i=1γ (Zic)
To update the parameters ofθ, we follow the method in Daudin et al. (2008) and update the probability of an edge existing between communityqandl, given byθqlas,
θql=
i=jγ (Ziq)γ (Zjl)aij
i=jγ (Ziq)γ (Zjl)
(10)
The updates shown in Eqs. (8) and (9) and standard mixture of Gaussians updates (Bilmes and et al1998). The update in Eq. (10) was shown by Daudin et al. (2008).
We continue the process of iterating between the E-step and M-step until the change in the data log-likelihood,L, is below a predefined tolerance threshold. Once the log-likelihood has converged, the value for eachZic can be interpreted as follows. TheZic corresponding to nodeiis 1 ifcis the community corresponding to the largest posterior probability (γ (zic)across allc. MoreoverZic=0 for all communitiesc, such thatcdid not correspond to the highest posterior probability. Similarly,cZic=1.
Initialization
Likelihood optimization approaches are often sensitive to initialization because it is easy to get stuck in a local optimum. As an initialization strategy for the nodes, we simply cluster the nodes in the network using the Louvain algorithm (Blondel et al.2008).
Synthetic data results
We first test the performance of our model and inference procedure on a synthetic exam-ple. We generated networks with a stochastic block model withN=200 nodes andK=4 communities, parameterized as follows:
Aij∼
⎧ ⎨ ⎩
Bernoulli(.10), ifzi=zj
Bernoulli(.25), ifzi=zj
(11)
Note that z is a 200-dimensional vector, where zi identifies the community label for nodei.
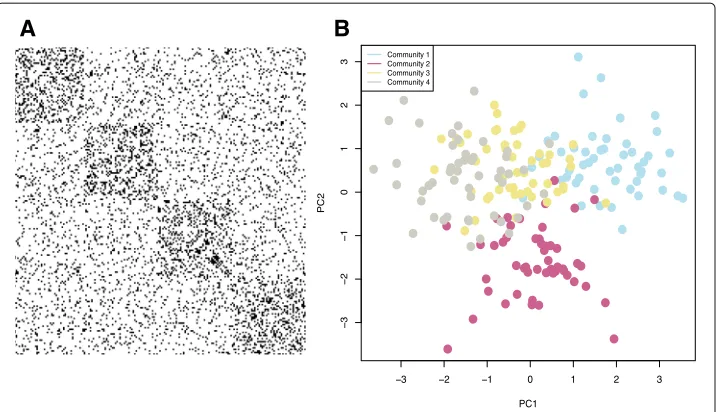
Figure2a shows the adjacency matrix for an example network generated according to this parametrization. The black marks in the image indicate edges. While this network has assortative structure with members of a community having more edges on average with each other than with other communities, there are still many noisy edges going between communities, making the correct community structure more difficult to discern.
To model attributes, for a communityc, we randomly generated an 8-dimensional vec-tor,μc, where each entry is from a Gaussian with 0-mean and unit variance. Associated with eachc∈ {1, 2, 3, 4}is an 8×8 diagonal covariance,c=diag(1.25). Moreover, using theμcandc, a sample attribute vector can be generated. That is, the attribute vectorxi for nodeiis generated as
xi∼N(μzi,zi) (12) whereN(·,·)denotes a multivariate Gaussian.
A
B
Fig. 2Synthetic Example. We generated a synthetic network withN=200 nodes,K=4 communities and an 8-dimensional multivariate Gaussian for each community.a. A visualization of the adjacency matrix for this network where a black dot indicates an edge. We observe that there is an assortative block structure (blocks on the diagonal), but there are also many edges between communities making the true community structure using only connectivity harder to detect.b. We performed PCA on theN×pattribute array and plotted each of theNnodes in two dimensions. Points are colored by their true community assignments,z. Clustering the nodes according to only connectivity, only attributes, and with the attributed SBM, we quantified the partition accuracy with normalized mutual information, yielding
NMI(z,{zconnectivity,zattributes,zattribute sbm})= {0.65, 0.68, 0.83}
from other communities in the projected attribute space but members of communities three and four are especially hard to discern here.
To assess how well the attribute SBM approach performed in successfully assigning nodes to communities, we compared the results obtained from our model to clustering results obtained clustering based only on connectivity and to clustering based only on the attribute information. We quantify the correctness of the obtained partitions with normalized mutual information (NMI) (Danon et al. 2005). Letting zdenote the true node-to-community assignments, thenzconnectivity,zattributes, andzattribute sbm denote the partition of the nodes according to the network connectivity only, attributes only, and with the attributed SBM. To cluster the network only according to connectivity, we fit a stochastic block model with four blocks. To cluster nodes with only attributes, we per-formedk-means clustering on only the attributes. Computing the NMI betweenzand each of these three cases, we obtain 0.65, 0.68, and 0.83, respectively. These results show that by combining both sources of information, there is an improvement in the ability to correctly identify communities. To further probe this idea, we sought to empirically look closer at the so-called ’detectability limit’. Generally, detectability refers to the difficulty of correctly identifying clusters in data; in particular, sharp phase transitions are observed in fitting stochastic block models, with accurate capture of the correct communities only if the within-community probability,pin, is sufficiently larger than the between-community probability,pout(Decelle et al.2011; Taylor et al.2016).
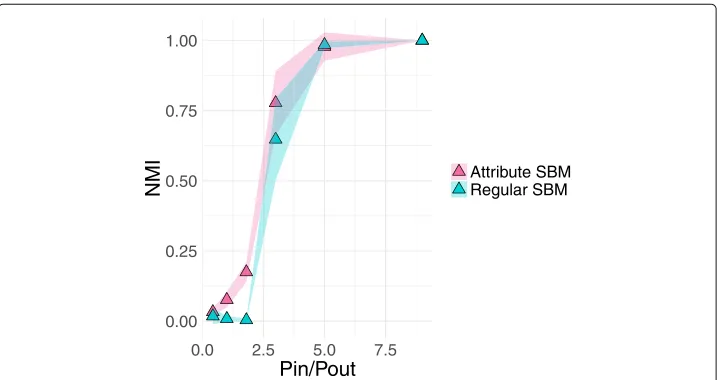
hypothesized that augmenting the network connectivity with attributes may move this detectability limit. In Fig.3, we explored how generating networks from a stochastic block model with varying ratios between pin andpout combined with the attributes used in Fig.2would affect the accuracy of the node-to-community partition. To do this, we con-sidered values ofpinbetween 0.05 and 0.3 in increments of 0.05. For each of thesepin values, we found the corresponding value ofpoutsuch that the mean degree was 20. Fixing the mean degree allows for direct comparison of how the within-to-between community probabilities influence the detection of correct communities. For each of thesepin and
pout combinations, we generated 10 different networks using a stochastic block model. In Fig.3we plot the NMI between the true partition,zand the partitions using only the connectivity with the regular SBMzconnectivityand the attributed SBMzattribute sbm. These results are plotted in blue and pink, respectively. The shaded region around the points indicates standard deviation.
We see that while both inference approaches undergo a strong increase in accuracy at a similar ratio of pin/pout = 3, we notice that the curve for the attribute SBM results are slightly shifted to the left due to the use of the extra attribute informa-tion positively impacting the ability to correctly identify communities. Moreover, we note that the attribute SBM results appear to smooth out the sharp phase transition that is visible in the results from the SBM without attributes. Future work could focus on better understanding the impact on such detectability questions in terms of the parameters for the underlying multivariate Gaussian distributions parametrizing each community.
0.00 0.25 0.50 0.75 1.00
0.0 2.5 5.0 7.5
Pin/Pout
NMI
Attribute SBM Regular SBM
Using the fitted attributed SBM for link prediction and collaborative filtering One of the benefits of a generative network model is that it can be applied to pre-diction tasks. Most notably, in the absence of one source of information about a node (connectivity or attributes), the model can be used to predict the complementary informa-tion source (attributes or connectivity, respectively). We demonstrate here that fitting an attributed SBM may provide a means to successfully perform two fundamental network prediction tasks: link prediction and collaborative filtering.
In the link prediction problem, when given two node stubs, the objective is to determine whether a link exists between them. Since we are modeling connectivity with a stochastic block model, we can predict links using the learned parameters. In particular, we highlight how this task can be performed using just the attribute information of the node stubs of interest. In the experiments to follow, we compare to 3 commonly-used link prediction methods. In all of these methods, a score is computed for all edge-candidate dyads and ultimately the topxset of prospective edges with highest weights are kept (wherexis some user-defined parameter). Letiandjbe a pair of nodes and(i)denote the set of neighbors for a nodei. Then, under the following 3 common link prediction methods (Wang et al.2014), we can calculate the score of the potential link asScore(i,j).
Jaccard:Score(i,j)= ((ii))∩∪((jj))
Adamic Adar:Score(i,j)=c∈(i)∩(j)log|1(c)|
Preferential Attachment:Score(i,j)= |(i)| × |(j)|
Stochastic Block Model: We also compare to the plain stochastic block model (SBM) by using a standard stochastic block model to predict edge probabilities according to the learned parameters according to connectivity only. To predict the probability that an edge exists between nodesiandj, we fit a plain SBM based only on connectivity. This results in a matrix of between-community probability parameters,θ and a vector of node-to-community assignmentsz. Then we specify the probability that an edge exists between nodesiandjasθzi,zj.
Conversely, the collaborative filtering problem seeks to predict a node’s attributes based on its similarity to its neighbors. For some node of interest, we can use our fitted attributed SBM model to predict a node’s attributes, given only the information about its connectivity. Formally, for nodei, we seek to predictxi. In the following experiments, we compare our results to two common collaborative filtering approaches (Shi et al.2014). LetNk(i)be the set ofk-nearest neighbors in the network for nodei. Letxˆibe the pre-dicted attribute vector for nodeiandsijbe a similarity measure (e.g. correlation) encoded through the weighted edge between nodesiandj.
Neighborhood Avg:xˆi= |N1k(i)|
j∈Nk(i)xj
Weighted Neighborhood Avg: ˆ
xi = 1
j∈Nk(i)sij
j∈Nk(i)
sijxj
neighbors again in connectivity space. Then we predict the attribute vectorxˆifor nodei asμˆc, wherecis the most common community among nearest neighbors.
We show results for these two tasks in two different biological network examples in “Applications in biological networks” section. In particular, the experiments were designed in the following ways.
Link prediction experiments
For the link prediction tasks shown in Figs.4and5, we performed a link prediction task by sampling pairs of nodes and utilizing the complementary source of attribute informa-tion. We sampled 10 different sets of 50 pairs of nodes. In each sample, 25 of the node pairs were those having an edge in the original network and 25 were pairs with no edge. For each of the 50 edges in each sample, we sought to predict whether an edge existed between the corresponding node pair in a leave one out manner. To do this, for each edge we fit the attributed SBM to the network with the pair of nodes (stubs) associated with the edge removed. We then use the nearest neighbor in attribute space of each stub as the input to each of the three baseline link prediction methods (Jaccard, Adamic Adar, and Preferential Attachment). To use our attributed SBM in this link prediction task, we also consider the most commonly observed community among the 3 nearest neighbors for the stubsiandjof the edge of interest. We denote the label for the most common community among the three-nearest neighbors of nodes i and j aszi and zj, respec-tively. We then define the link prediction score for the edge asθzi,zj, or the probability
Fig. 5Link Prediction in the protein interaction network. Performing link prediction using the attributed SBM, Jaccard, Adamic Adar, preferential attachment, and SBM. The corresponding AUC curves for these methods were 0.61, 0.58, 0.58, 0.54, and 0.42, respectively
that an edge exists between nodesi andj according to the fitted model. After gener-ating 10 samples of 50 edge pairs, this results in 500 total edge scores. Since we know the ground truth of whether or not these edges actually exist from the original network, we can construct an ROC curve for each method. From these curves we can plot area under the curve (AUC) to quantify the quality of the link prediction result. Using the attributed SBM is a way to incorporate community information into the link prediction problem which has previously shown to be effective (Soundarajan and Hopcroft2012). In “Applications in biological networks” section we show that the attributed SBM offers the highest performance (area under the ROC curve) on two biological datasets, in comparison to baseline methods.
Collaborative filtering experiments
our test node to be the most-frequently observed community among its neighbors. Using this community assignment,c, we can then predict the attribute vector,xi for a nodei from the fitted attribute SBM model. In particular, the predicted value forxi is a sam-ple from the learned multivariate Gaussian distribution for communityc. This model is parameterized by mean,μcand covariancec. These results are shown in Figs.6and7. For a nodeiand its associated vector of attributes,xiwe quantify the accuracy of the pre-dicted attribute vector,xˆiwith root mean squared error (RMSE). We denote the error for a particular collaborative filtering approach byE and for a particular node it quantifies the difference between the true and predicted attribute values (xiandxˆi).
Similar to the success of integrating community information for link prediction, col-laborative filtering tasks have previously shown success from the integration of network community structure (Deng et al.2014). In “Applications in biological networks” section, we show that using the attributed SBM for collaborative filtering tasks leads to the lowest error compared to baselines on two biological datasets.
Applications in biological networks
We evaluated the potential to combine similarity or relational information between a set of entities for application in biological data. For example, one might consider networks of proteins, genes, or bacterial species with extra experimental data. Our application of this model to biological problems provides a framework to predict attribute or connectivity information about a new observation. Note that we do not intend to suggest any new biological insights here, but rather that we can combine two sources of information for prediction tasks and alternative definitions of what constitutes a community in the data. Applying the attributed stochastic block model to integrate connectivity and attribute data provides a way to find a partition that takes into account two different sources of information, or a method to predict one source of information (connectivity, attributes) in the absence of the other (attributes, connectivity).
0
5
10
Error
Method
Attribute SBM
Neighbor Avg
Weighted Avg
SBM
0.0
0.5
1.0
1.5
2.0
Error
Method
Attribute SBM
Neighbor Avg
Weighted Avg
SBM
Fig. 7Collaborative filtering in the protein interaction network. For each of the 82 nodes, we fit a model to the remaining 81 node network and given the node’s closest neighbors (based on network connectivity) sought to predict its 6-dimensional attribute vector. The reported error is the root mean squared error (denoted byE) between the difference between the true attribute vector(xi)and its predicted attribute vector(xˆi). The mean error inxiusing the attributed SBM is 0.74, as opposed to the neighborhood average, weighted neighborhood average, and SBM, resulting in errors of 0.74, 0.62, 0.62, and 0.94, respectively
Microbiome subject similarity results
Motivation
In the analysis of biological data, it is often useful to cluster subjects based on a set of their measured biological features and to then determine what makes each of the sub-groups different. One type of biological data gaining much attention in recent years is metagenomic sequencing data, used to profile the composition of a microbiome. We refer to this as the ’metagenomic profile’ and each feature is a count for each bacterial species, also known as operational taxonomic unit (OTU). Lahti et al. conducted a study among subjects across a variety of ethnicities, body mass (BMI) classifications, and age groups to understand differences in the intestinal microbiota (Lahti et al.2014). Using metage-nomic sequencing, the counts for 130 OTUs were provided for each subject. Using the OTU profiles, we created an attributed network between subjects based on their similar-ities in OTU profiles. In this case, connectivity represents pairwise correlation between subjects based on their OTU profiles. The attributes for each node are defined as the coordinates for a lower-dimensional embedding (described in the next section). In this case, we are overlaying two similar ways to look at the data and examining how this can enhance results. Our work here is not meant to reveal novel biology, but rather to provide a computational test for understanding the performance of our attributed SBM approach.
Constructing Node Attributes Since each node had a 130-dimensional vector of attributes (counts), we used this information to create a lower-dimensional attribute vec-tor for each node by performing PCA and then representing each node with the first 5 principal components. Each dimension of this new attribute vector was then centered and scaled, and we observed an approximately Gaussian distribution.
We first visualized the differences in partitions obtained according to the classic and attributed stochastic block models in Fig.8a-b, respectively. In both networks, nodes are colored by their community assignment. Using the classic stochastic block model and the model selection criterion described in (Daudin et al.2008), 7 blocks were identified. With the attributed stochastic block model, 6 blocks were identified. While we do not have ground truth labels on the nodes, it is visually apparent that adding the attributes to the inference problem helps to ‘clean up’ the partition. For example, in Fig.8a there is mixing between communities two and three in the network colored by communities identified with the regular SBM. In Fig.8b, this mixing was reduced after using the attributed SBM by assigning all of the nodes in the general region to community three. Similarly, in Fig.8a, members of community five are periphery nodes that are connected well to community seven but not to each other. Because these nodes do not have a lot of internal connectiv-ity, it is not immediately apparent why they were assigned to be in their own community. This nuance is corrected in Fig.8b with the use of the attributed stochastic block model. Here, the members of communities five and seven from Fig.8a. are mostly agglomer-ated into community six. The layout for each of these networks was computed using the ‘layout.nicely’ function in the R igraph library.
Microbiome Link Prediction We performed link prediction on the microbiome subject similarity network as described in “Link prediction experiments” section. The associated ROC curves are plotted in Fig.4. All five methods have satisfactory perfor-mance with the attributed stochastic block model giving the best results. The AUC values
A
B
1 2 3 4 5 6 7 1 2 3 4 5 6
for the attributed SBM, Jaccard, Adamic-Adar, preferential attachment, and SBM are 0.71, 0.69, 0.69, 0.62, and 0.71, respectively.
We note that the performance of the attributed SBM and SBM are very similar in the microbiome network shown in Fig.4. This likely arises from the fact that the node attributes and connectivity are quite similar. Alternatively in Fig. 5 the attributes and connectivity are more complementary sources of information. Moreover, including the attribute information greatly helps the link prediction task in this case.
Microbiome Collaborative FilteringWe performed the collaborative filtering exper-iments on the microbiome subject similarity network in the manner described in “Collaborative filtering experiments” section to predict the 5-dimensional attribute vec-tor for each node. The box plots in Fig. 6 indicate the distribution of root mean squared error (RMSE),E, over the 121 nodes for the attribute SBM (turquoise), neigh-bor average (orange), weighted neighneigh-bor average (blue), and SBM (pink). We find that in general the edge-based collaborative filtering methods (neighbor average and weighted neighbor average) have better performance than community model-based pre-dictions (attributed SBM, SBM). This is likely because predicting an attribute vector based on an average over a collection of nodes likely introduces more noise than pre-dicting only based on closest neighbors. A similar behavior is also observed in the collaborative filtering experiments in the protein interaction network shown in Fig.7. In general, all four methods have similar error distributions, but the attributed SBM outperforms the standard SBM. The mean RMSEs for the attributed SBM, neighbor average, weighted neighbor average, and SBM were 2.3, 2.06, 2.05, and 2.45, respec-tively. This experiment along with the experiment shown in Fig.7show that while not quite as accurate as the methods based on closest neighbors, the attributed stochas-tic block model nevertheless can be effectively used for collaborative filtering tasks. A possibly interesting direction for future work would be to consider combinations of these methods from different perspectives to attempt to identify greater improvements in accuracy.
Protein interaction network results
We also apply our attributed SBM approach to the protein interaction network presented in (Bonacci et al.2014). This network represents interactions between proteins, predicted from the literature. Associated with each node (protein), is a classification of one of 6 experimental modifications observed from the exposure of cancer cells to a chemother-apeutic drug. While communities in this network should reflect functional relatedness among proteins (e.g. similar biological functions, in general), we also expect that mem-bers of a community should share similarities in the observed modification type. Also associated with each of the 6 modification types is whether that particular type of mod-ification became either more or less prominent after treatment with the drug. Since we have two types of labels associated with these nodes, we also sought to explore how these two labeling schemes (6 class vs. 2 class) aligned with the communities returned by the algorithm.
Constructing Node Attributes:Each node is classified with 1 of 6 possible modifica-tion types. For each node, we created an attribute vector that captured the modificamodifica-tion types of its neighbors. To do this, we considered the 4th order neighborhood of each node. That is, for each node, we collected its neighbors who were four hops or less away in the network. Then to define the value for attributecof nodei, orxic, we counted the num-ber of 4th order neighbors of nodeiwith labelc. After defining these attributes across all nodes, for each of the 6 classes, we centered and scaled each attribute across all of the nodes to have mean 0 and unit variance.
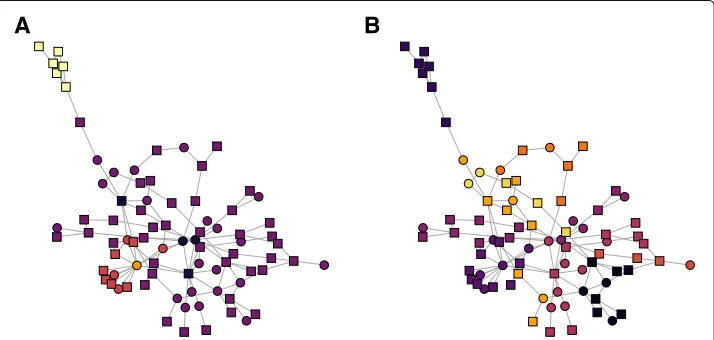
Figure9a-b show the results of fitting a classic SBM and attributed SBM, respectively. These networks are visualized with the Fruchterman Reingold force directed layout in the R igraph library. Nodes are colored by their community assignment. The 6 possible modifications arise from 3 biological processes that can either increase or decrease after exposure to the drug. The node shape reflects whether the experimental modification for a node increased (square) or decreased (circle) after treatment with the chemother-apeutic agent. Again by fitting an SBM with the model selection criterion in (Daudin et al.2008), five communities were identified. With our attributed SBM, nine communities were identified. Note that using the attributed SBM created more communities in that it split up the purple core community under the classic SBM into more small communities. The implications of this new partition are explored with an entropy calculation based on the biological classifications of the protein in Fig.10.
Using the partition of the nodes under the classic and attributed stochastic block mod-els, we sought to use the two different prior biological classifications or labeling of the nodes (proteins) (Bonacci et al.2014). The first of these classifications includes one of six modification types. The other classification refers to whether the protein has increased or decreased levels of expression. Moreover, we could use these two types of labels or classi-ficationsof the proteins to compute a label entropy measure within each community. The expectation is that by incorporating attribute information that is related to the functional
A
B
2 4 6 8
0
5
10
15
Community #
Entrop
y
SBM Attribute SBM
2 4 6 8
0
5
10
15
Community #
Entrop
y
A
B
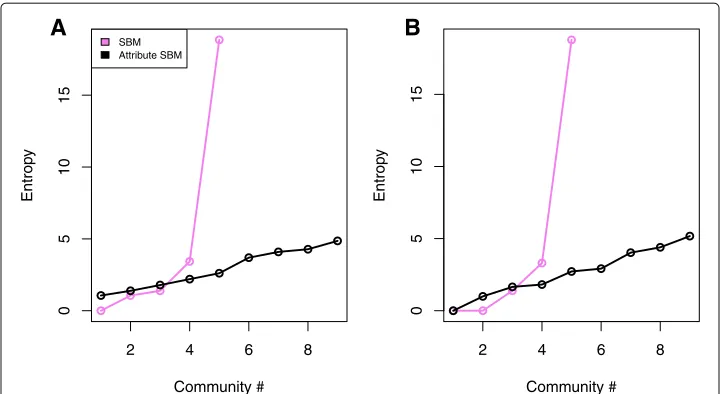
Fig. 10 Community entropies in the protein interaction network. We studied the entropy of the 2 class and 6 class classifications of the nodes ina. andb., respectively under the classic SBM (black) and attributed SBM (purple) partitions. ForA.−B. the horizontal axis denotes the community index for the particular partition. Nodes belonged to 1 of five communities under the classic SBM and belong to one of nine communities under the attributed SBM. Incorporating attributes under both classifications succeeds in breaking up a high e ntropy community (5) from the classic SBM partition to lower entropy communities in the attributed SBM partition
protein information into the community detection problem, we should see a decrease in the entropy over the biological classification labels in communities. In Fig.10a-b, we plot the entropy for the 2 class and 6 class node classifications, respectively. We defineEc, the entropy for communitycas
Ec= −
k
pklog(pk). (13)
Here,kindexes the unique classifications found in communitycandpkis the probability that a node in communitycbelonged to biological classificationkin communityc. In these plots the black and purple curves correspond to the fits of the classic and attribute SBM fits, respectively. Using both types of node classifications to compute these entropy quan-tities, we see that the attribute SBM succeeds in breaking up one high entropy community (5) from the classic SBM partition into lower entropy communities.
Link Prediction in the Protein interaction networkWe performed link prediction on the protein interaction network using the procedure described in “Link prediction experiments” section. Given that this protein network is sparse, none of the link pre-diction methods performed particularly well. The AUC values for the attributed SBM, Jaccard, Adamic-Adar, preferential attachment, and SBM were 0.61, 0.58, 0.58, 0.54, and 0.42, respectively. The associated ROC curves are shown in Fig. 5. In this exam-ple, the attributed SBM significantly outperforms the regular SBM. This is most likely due to the complementary and non-overlapping nature of the connectivity and attribute information.
are unweighted and hence the neighbor average and weighted neighbor average meth-ods produce the same result. Similar to the results in the microbiome network in Fig.6, we notice that edge-based methods (neighborhood average and weighted neighborhood average) result in a lower error than community-based methods (attributed SBM, SBM). Similarly, the attributed SBM has higher performance over the plain SBM. The root mean squared errors for the attributed SBM, neighborhood average, weighted neighborhood average and SBM were 0.74, 0.62, 0.62, and 0.94, respectively. Clearly, the attributed SBM offers several advantages over the original SBM. Similar to Fig.6, the box plots in Fig.7 represent the distribution of errors across each of the 82 nodes.
The attributed SBM leads to increased network assortativity
We further quantified the quality of the partition obtained by integrating network con-nectivity and node attributes with an assortativity measure (Newman2003). Assortativity measures the extent of homophily in a network, under some labeling of the nodes. Intu-itively, this implies that in a network with a high assortativity coefficient, nodes tend to have the same labels as their neighbors. Moreover, we labeled nodes according to their community assignments under the classic and attributed stochastic block model and computed assortativity using the assortativity function in igraph. We found that in both the microbiome and protein dataset, using the attributed SBM leads to higher assortativ-ity. In Fig.11we show that the assortativities for the regular and attributed SBMs in the microbiome data were 0.61 and 0.71, respectively. Similarly, in the protein dataset, the assortativity measures for the regular and attributed SBM were -0.122 and 0.714, respec-tively. The assortativity computed in the protein-protein interaction network with the
0.00 0.25 0.50 0.75
Microbiome Protein
Assor
tativity
Attribute Regular
Fig. 11 Assortativity for class and attributed stochastic block models. We computed assortativity coefficients for both the microbiome subject similarity and protein-protein interaction networks. The
regular SBM was negative. This implies that the induced labels are not coherent between individual nodes and their neighbors.
Conclusions and future work
We defined an attributed stochastic block model, where a node’s community assign-ment determines its connectivity and its attribute vector. Our model extends previous work on attributed stochastic block models in its ability to handle multiple continuous attributes. The continuous attributes are modeled by a Gaussian mixture model, with the assumption that the attributes for members for each community are parameterized by a unique multivariate Gaussian. Since community detection results are often difficult to validate due to the absence of a known ground truth, we quantified the ability of the fitted attributed stochastic block model to represent a particular network by performing link prediction and collaborative filtering tasks. Applying link prediction and collaborative fil-tering to two biological networks, we observed that the attributed SBM is useful for these applications.
Future work could extend the model to handle a combination of multiple discrete and continuous attributes. Further, while the inference or understanding of fitting a stochastic block model to weighted networks is not well understood, figuring out how to integrate edge weights and attributes in determining community structure could be useful. Next, we also mentioned the I-Louvain method, which is an extension of modularity to networks with potentially multiple, continuous attributes (Combe et al. 2015). It would be useful to characterize under what circumstances one might choose to use an SBM approach as opposed to a modularity optimization approach. We briefly discussed observed detectability properties in Fig. 3, noting that it would be interesting to characterize how the properties of the attributes and connectivity relate to effective identification of community structure. Next, whereas our specific attributed SBM model considered here does not include corrections for heterogeneous degrees, or the effect of partial dependency between attributes and connectivity, further work could broaden the diversity of networks able to be analyzed with the attributed SBM. Finally, in this current version of the attributed SBM with multiple continuous attributes, we have not developed model selection criteria to determine the number of communities, K, that we expect in the network. This is an important aspect of future work as it allows a user to apply the attributed SBM in a more automated manner.
Networks used across fields are becoming increasingly complex, often with multiple sources of information to integrate in order to make a conclusion for the data. Our approach to an attributed SBM advances the understanding of how to jointly consider attribute and connectivity information in a probabilistic framework.
List of Abbreviations
BMI: Body mass index; NMI: Normalized mutual information; OTU: Operational taxonomic unit; PCA: Principal component analysis; RMSE: Root mean squared error; ROC: Receiver operating characteristic; SBM: Stochastic block model
Acknowledgements
We acknowledge clarifying conversations with Aaron Clauset and Mark Newman.
Authors’ contributions
Authors’ information Not applicable.
Funding
The research reported in this publication was supported by the NSF (ECCS-1610762). The content is solely the responsibility of the authors and does not necessarily represent the official views of the funding agency.
Availability of data and materials
CodeThe code to run the attributed SBM can be found here,https://github.com/stanleyn/AttributedSBM.
Data
Protein Interaction Network:The protein interaction data and its corresponding attribute information can be found in the supplementary information of this publication,https://pubs.acs.org/doi/abs/10.1021/pr401258d.
Microbiome Subject Similarity Network:The data used to compute the microbiome subject similarity network can be found here,http://datadryad.org/resource/doi:10.5061/dryad.pk75d.
Competing interests
The authors have no competing interests to declare.
Author details
1Curriculum in Bioinformatics and Computational Biology, University of North Carolina at Chapel Hill, Chapel hill, USA. 2Present address: Stanford University, Stanford, USA.3Department of Pharmacology & Lineberger Comprehensive Cancer Center, University of North Carolina at Chapel Hill, Chapel hill, USA.4Department of Computer Science, University of Salzburg, Salzburg, Austria.5Department of Computer Science & Biomedical Research Imaging Center, University of North Carolina at Chapel Hill, Chapel hill, USA.6Carolina Center for Interdisciplinary Applied Mathematics, Department of Mathematics, University of North Carolina at Chapel Hill, Chapel hill, USA.
Received: 29 January 2019 Accepted: 9 July 2019
References
Aghaeepour N, Ganio EA, Mcilwain D, Tsai AS, Tingle M, Gassen SV, Gaudilliere DK, Baca Q, McNeil L, Okada R, et al (2017) An immune clock of human pregnancy. Science immunology, Vol. 2, Washington, DC
Bilmes JA, et al (1998) A gentle tutorial of the em algorithm and its application to parameter estimation for gaussian mixture and hidden markov models. Int Comput Sci Inst 4(510):126
Blondel VD, Guillaume J-L, Lambiotte R, Lefebvre E (2008) Fast unfolding of communities in large networks. J Stat Mech: Theory Exp 2008(10):P10008
Bonacci T, Audebert S, Camoin L, Baudelet E, Bidaut G, Garcia M, Witzel I-I, Perkins ND, Borg J-P, Iovanna JL, et al (2014) Identification of new mechanisms of cellular response to chemotherapy by tracking changes in post-translational modifications by ubiquitin and ubiquitin-like proteins. J Proteome Res 13(5):2478–2494
Bothorel C, Cruz JD, Magnani M, Micenkova B (2015) Clustering attributed graphs: models, measures and methods. Netw Sci 3(3):408–444
Combe D, Largeron C, Géry M, El ˙od E-Z (2015) I-louvain: An attributed graph clustering method. In: Advances in Intelligent Data Analysis XIV. Springer. pp 181–192
Danon L, Diaz-Guilera A, Duch J, Arenas A (2005) Comparing community structure identification. J Stat Mech: Theory Exp 2005(09):P09008
Daudin J-J, Picard F, Robin S (2008) A mixture model for random graphs. Stat Comput 18(2):173–183
Decelle A, Krzakala F, Moore C, Zdeborová L (2011) Inference and phase transitions in the detection of modules in sparse networks. Phys Rev Lett 107(6):065701
Dempster AP, Laird NM, Rubin DB (1977) Maximum likelihood from incomplete data via the em algorithm. J Royal Stat Soc Ser B (Methodol) 39(1):1–22
Deng W, Patil R, Najjar L, Shi Y, Chen Z (2014) Incorporating community detection and clustering techniques into collaborative filtering model. Proc Comput Sci 31:66–74
Fortunato S (2010) Community detection in graphs. Phys Rep 486(3-5):75–174
Fortunato S, Hric D (2016) Community detection in networks: A user guide. Phys Rep 659:1–44
Greene D, Cunningham P (2013) Producing a unified graph representation from multiple social network views. In: Proceedings of the 5th Annual ACM Web Science Conference. ACM. pp 118–121
Guinney Justin, Dienstmann Rodrigo, Wang Xin, Reyniès Ad, Schlicker A, Soneson C, Marisa L, Roepman P, Nyamundanda G, Angelino P, et al (2015) The consensus molecular subtypes of colorectal cancer. Nat Med 21(11):1350
Hric D, Peixoto TP, Fortunato S (2016) Network structure, metadata, and the prediction of missing nodes and annotations. Phys Rev X 6(3):031038
Karrer B, Newman ME (2011) Stochastic blockmodels and community structure in networks. Phys Rev E 83(1):016107 Lahti L, Salojärvi J, Salonen A, Scheffer M, Vos WMD (2014) Tipping elements in the human intestinal ecosystem. Nat
Commun 5:4344
Larremore DB, Clauset A, Buckee CO (2013) A network approach to analyzing highly recombinant malaria parasite genes. PLoS Comput Biol 9(10):e1003268
Leskovec J, Lang KJ, Mahoney M (2010) Empirical comparison of algorithms for network community detection. In: Proceedings of the 19th international conference on World wide web. ACM. pp 631–640
Newman MEJ (2003) Mixing patterns in networks. Phys Rev E 67(2):026126
Newman MEJ, Clauset A (2016) Structure and inference in annotated networks. Nat Commun 7:11863
Peixoto TP (2014) Efficient monte carlo and greedy heuristic for the inference of stochastic block models. Phys Rev E 89(1):012804
Porter MA, Onnela J-P, Mucha PJ (2009) Communities in networks. Not AMS 56(9):1082–1097
Shai S, Stanley N, Granell C, Taylor D, Mucha PJ (2017) Case studies in network community detection. arXiv preprint arXiv:1705.02305
Shi Y, Larson M, Hanjalic A (2014) Collaborative filtering beyond the user-item matrix: A survey of the state of the art and future challenges. ACM Comput Surv (CSUR) 47(1):3
Snijders TAB, Nowicki K (1997) Estimation and prediction for stochastic blockmodels for graphs with latent block structure. J Classif 14(1):75–100
Soundarajan S, Hopcroft J (2012) Using community information to improve the precision of link prediction methods. In: Proceedings of the 21st International Conference on World Wide Web. ACM. pp 607–608
Taylor D, Shai S, Stanley N, Mucha PJ (2016) Enhanced detectability of community structure in multilayer networks through layer aggregation. Phys Rev lett 116(22):228301
Wang P, BaoWen X, YuRong W, Zhou X (2014) Link prediction in social networks: the state-of-the-art. arXiv preprint arXiv:1411.5118
Yang J, Leskovec J (2015) Defining and evaluating network communities based on ground-truth. Knowl Inf Syst 42(1):181–213
Yang J, McAuley J, Leskovec J (2013) Community detection in networks with node attributes. In: Data mining (ICDM), 2013 ieee 13th international conference on. IEEE. pp 1151–1156
Zhang P, Krzakala F, Reichardt J, Zdeborová L (2012) Comparative study for inference of hidden classes in stochastic block models. J Stat Mech: Theory Exp 2012(12):P12021
Publisher’s Note