R E S E A R C H
Open Access
Estimating PageRank deviations in
crawled graphs
Helge Holzmann
1†, Avishek Anand
2and Megha Khosla
2**Correspondence:[email protected]
†The work was conducted while the author was a PhD student at L3S Research Center, Hannover, Germany.
2L3S Research Center, Leibniz University, Appelstrasse 9a, 30167 Hannover, Germany
Full list of author information is available at the end of the article
Abstract
Most real-world graphs collected from the Web like Web graphs and social network graphs are partially discovered or crawled. This leads to inaccurate estimates of graph properties based on link analysis such as PAGERANK. In this paper we focus on studying such deviations in ordering/ranking imposed by PAGERANKover crawled graphs. We first show that deviations in rankings induced by PAGERANKare indeed possible. We measure how much a ranking, induced by PAGERANK, on an input graph could deviate from the original unseen graph. More importantly, we are interested in conceiving a measure that approximates the rank correlation among them without any knowledge of the original graph. To this extent we formulate the HAK measure that is based on computing the impact redistribution of PAGERANKaccording to the local graph structure. We further propose an algorithm that identifies connected subgraphs over the input graph for which the relative ordering is preserved. Finally, we perform extensive experiments on both real-world Web and social network graphs with more than 100M vertices and 10B edges as well as synthetic graphs to showcase the utility of HAK and ourHigh-fidelity Component Selectionapproach.
Keywords: PageRank, Crawls, Ranking deviations
Introduction
Most real-world graphs collected from the Web like Web graphs and social network graphs are partially discovered (crawled) or in other words their graph topology is not known in entirety (Li et al. 2015), especially if not crawled for a particular purpose or subset, but extracted from existing crawls, such as Web archives. The goal of Web archive crawlers is to capture as much as possible starting from some seed set within some national domain or even broader, given the available but limited resources (Costa et al.2017). Complicating matters further, Web archives are often not constructed in one piece but by merging partial crawls (Holzmann et al.2016). Additional reasons for miss-ing information (links) in Web archives include the restrictive politeness policies (i.e., robots.txt) or random timeouts of Web servers. Several studies on this topic have shown that the problem of partial discovery is indeed a common issue (Huurdeman et al.2014), inevitably affecting the graphs extracted from such crawls as well.
As a result, important graph properties and measures used for link analysis and struc-tural characterization like authority of vertices might be inherently flawed or exhibit deviations from their original values. This is commonly observed where users are typi-cally agnostic to the incompleteness of the obtained graph, hoping that the input graph
is a reasonable representative sample of the underlying (unseen) original graph. Some of the well-known measures for computing authority of vertices or relative ordering of ver-tex authorities based on random walks are PAGERANK(Page et al.1999) and its variants (Kleinberg1999; Haveliwala2002).
As an example, consider PAGERANKcomputed over the.govWeb graph that we will analyze in detail later in this work. Here, thewomen.nasa.gov(Women@NASA) page has a high PAGERANKvalue and is subsequently found within the top 300 pages.
How-ever, on a closer examination we observe that most of its PAGERANKis contributed by an in-link from the highly popular NASA homepage (nasa.gov). If for some reason this particular in-link is not crawled, e.g., due to a temporary downtime or the decision by NASAto exclude their homepage from being crawled, this would cause a large decrease in its PAGERANKand hence a severe rank deviation in the obtained crawl.
One might argue that this is an unlikely case sinceimportantpages enjoy a high pri-ority and are therefore commonly crawled, but this might not always be the case in reality. To support our claim we performed the following experiment. We ranked pages in a graph constructed from a.de Web archive in 20121based on (1) inlinksand (2) PAGERANKS. The above mentioned graph considered only links that emerged in 2012 (Holzmann et al.2017). We then checked if the top ranked pages in this crawled graph were indeed archived in that year. Our experiments show that from among the top 1000 pages, ranked according to inlinks, roughly 30% are contained in the archive. According to PAGERANKrankings, less than 20% of the top 1000 pages are contained in the archive.
With this small experiment we show that high priority vertices can indeed be missed in real world crawls, which can further cause a rank deviation in the obtained crawled graph. In this paper we focus on studying such deviations in ordering/ranking imposed by PAGERANK over crawled graphs. Vertices in our input crawls are either completely crawled(all neighbors are known) or areuncrawled(none of their outgoing neighbors are known but their incoming links from the crawled vertices are known), which we also refer to asghost vertices. In this paper, we focus on the following 3 research questions.
• RQ I :Do crawls or partially discovered real-world graphs show a deviation in their PAGERANKorderings when compared to full network topology?
• RQ II :How can we reliably measure the extent of such ranking deviations for crawled graphs?
• RQ III :Can we identify suitable sized components in a graph for which PAGERANK
computations are reliable?
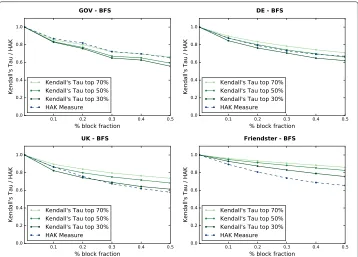
We first establish empirically that real-world networks indeed show a deviation in their PAGERANKorderings when not crawled completely compared to the full graph (RQ I). We present ranking correlations (measured byKendall’s Tau) dropping down to 0.55 on Web graphs when only 50% of it is crawled. That corresponds to an average positional displacement of 66,216 ranks among the top 30% pages in the above mentioned.gov graph. We note that for most of the applications, only ranking deviations of the top pages are interesting. In addition the results from (Ng et al.2001a) imply that vertices with small actual PAGERANKS(in the original, unperturbed graph) will have smaller deviations with
respect to their original scores in the modified or crawled graph.
Users and applications that use rankings induced by PAGERANKas a feature for down-stream ranking and learning tasks would naturally be interested in estimating such a deviation from the (crawled) input graph at hand as a measure of confidence. As an answer toRQ II, we propose a measure called HAK (an acronym of the authors’ last-names) that estimates the ranking deviation of an crawled input graph when compared to the original graph. Note that at all times we are agnostic about the original (unseen)target graphand hence, the estimates are purely based on the observed input graph. Also, our target graphs are large Web or social network graphs and hence, the computation of such a measure should be scalable. The HAK measure relies on local estimates of vertex-level attributes and can be easily computed in a distributed manner.
Our third contribution, towardsRQ III, is to propose an algorithm for the selection of maximum connected subgraphs in the given crawls, for which the relative ordering of the vertices is preserved. In other words, the aim is to identify connected components from a crawl where the ordering among the vertices would have bounded deviations with respect to the unknown parent graph. This is essential for users to give them a more representative set of vertices over which measures can be more accurately computed, if their input graph suggests strong ranking deviations.
Finally, we perform extensive experiments on both real-world Web and social network graphs with more than 100 million vertices and 10 billion edges as well as synthetic graphs to discuss the utility of HAK and propose a new algorithm, which we refer to as High-fidelity Component Selection, in order to find components from a given crawl that have relatively lower ranking deviations.
Our results, apart from measuring the deviations in PAGERANKS, also shed light on the structure of the Web and the nature of Web graphs in general. We observe that Web graphs behave more (although not completely) like random graphs under certain crawling strategies.
We remark that the main results corresponding toRQ IandRQ IIappeared in the preliminary version of the paper(Holzmann et al.2018). The present work in addition investigatesRQ IItowards which new algorithm is proposed and evaluated. In addition, we provide a more detailed analysis and discussion on the results of the other two research questions.
Related work
Ng et al. (2001a) analyzed the conditions under which eigenvector methods like PAGE
the hubs-and-authorities notion from HITS with a stabilizing “reset” (teleportation to a random vertex) mechanism from PageRank; and Subspace HITS, which provides a prin-cipled way of combining multiple eigenvectors from HITS to yield aggregate authority scores.
Bianchini et al. (2005) analysed the stability among other properties of PageRank. In essence, they show that overall change of PageRank the whole Web is proportional to the sum of PageRank of the perturbed pages, i.e, PageRank is robust with respect to changes taking place in small communities of the Web. Their theoretical analysis provide a stronger bound as compared to (Ng et al.2001a) on change in PageRank in presence of perturbations. Similar to (Ng et al.2001a) their result gives no insight on how to measure the discrepancy if only the modified graph is known.
Ghoshal and Barabási (2011) predicts analytically the presence of a small number of super-stable nodes in scale-free networks whose ranking given by PageRank is excep-tionally stable under degree-preserving perturbations. The number of these super stable nodes is typically very small, for example with the numbers reported (Ghoshal and Barabási2011) range from 1 to 4. We, on the other hand, compute ranking deviations exhibited by a larger percentage of the top ranking nodes including the not so stable (towards perturbations) nodes. Moreover, the more general crawling strategies that we consider in this work may not always be degree preserving as the case studied in the above work.
Boldi et al. (2004) were the first to show the paradoxical effects of PAGERANK
compu-tation on Web graphs. They discuss a measure of effectiveness for crawl strategies based on whether the graph obtained after a partial visit is in some sense representative of the underlying Web graph for the PAGERANKcomputation. Similar to our setting, they study how rapidly the computation of PAGERANKover the visited subgraph yields relative ranks (measured by Kendall’s Tau) that agree with the ones the vertices have in the full graph. In a later work (Boldi et al.2006), they show a connection betweengraph fibrationsand Markov chains with restart, a particular kind of Markov chains that include the PAGE
R-ANKone as a special case. In (Vattani et al.2011) the authors operate on a given subset of vertices and consider the general problem of maintaining multi-scale graph structures by preserving a distance metric based on PAGERANKamong all pairs of sampled vertices. Other authors investigated this problem before as well, however, none of them focused on random walk algorithms, such as the widely used PAGERANK, neither explored the effect of missing nodes in real-world Web graphs (Wang et al.2012; Smith and Moody2013; Smith et al.2017).
Hübler et al.2008). Other works have directly tried to estimate graph properties such as degree distribution estimation (Gjoka et al.2011), clustering coefficient estimation (Hardiman and Katzir2013), size estimation (Katzir et al.2011), and average degree esti-mation (Dasgupta et al.2014). One of the popular sampling algorithms used for Web graphs is theForest Firealgorithm by Leskovec and Faloutsos (2006), a generative graph model, in which new edges are added via an iterative “forest fire” burning process where it is shown to produce graphs exhibiting a network community profile plot similar to many real-world graphs. We use this approach in generating synthetic real-world graphs.
However, most of these works, with the exception of (Li et al.2015), assume a known graph topology. Our work focuses on the unknown graph topology, an arguably more general and useful scenario in Web graphs and social networks gathered by crawlers. In addition, with our component selection approach we optimize for a more reliable PAGERANKordering instead of other properties like degree distributions or clustering coefficients as considered in earlier works.
Preliminaries and problem
PageRank.As originally conceived, PAGERANKranks vertices of a directed graphG = (V,E)whereV andEare the vertices and edges respectively, based on the topological structure of the graph using random walks (Page et al.1999). The problem we are address-ing in this paper is attributed to this random walk model behind PAGERANK, representing theauthorityorimportanceof a vertex.
For some fixed probabilityα, a surfer at vertexv∈ V jumps to a random vertex with probabilityαand goes to a linked vertex with probability 1−α. Theauthorityof a vertex vis the expected sum of theimportanceof all the verticesuthat link tov. Consequently, a vertex receives a high PAGERANKvalue and is ranked at the top by ordering the webpages byimportance when it is either connected by many incoming edges or reachable from anotherimportantpage.
We first define the notions oftarget graph,crawlandghost verticesin the context of partial discovery/sampling in graphs:
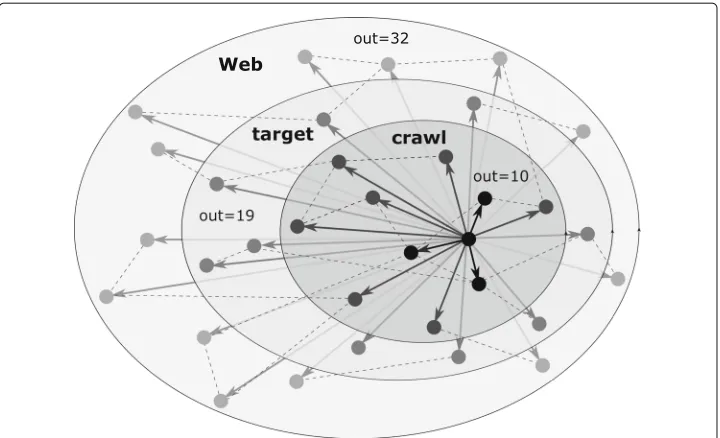
Definition 1(Target graph)The subset of vertices (with the induced edges) of a larger graph (e.g., the Web) that is theoretically reachable by a crawler given its seeds, e.g., a domain, a top-level domain, or all webpages that belong to a certain topic in case of focused crawlers. This graph would be available if every link was followed and every page captured by the crawler, illustrated by the target in Fig.1.
Definition 2(Crawled graph or Crawl)The (partial) graph derived from the set of web-pages that have actually been visited by the crawler, discovered/linked yet uncrawled web-pages are not included. This subset of the target graph is illustrated by the crawl in Fig.1.
Fig. 1Neighborhood of a webpage in different subgraphs of the Web
Ranking Deviations.The deviation among two rankings induced by PAGERANKis a global objective, independent of a specific query. Hence, local or relevance-based mea-sures such asnDCGare not applicable here. The most common metrics to quantify rank correlation are Spearman’s Rhoand Kendall’s Tau, which are both similar as they are special cases of a more general correlation coefficient and measure relative displacements. In this work, we use Kendall’s Tau (Kendall1938), ranging from [−1, 1], with 1 cor-responding to a perfect rank correlation, 0 corcor-responding to no correlation and−1 to a perfect inverse correlation, to compare the correlation/deviation of rankings computed on the vertices of a crawlGCwith respect to that of the target graphGT.
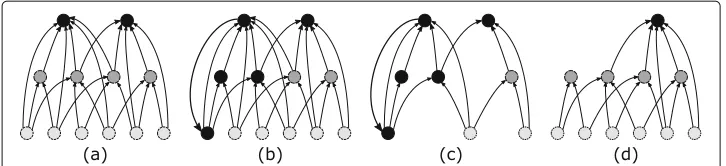
In Fig.2we provide a few examples of possible graph structures, where partial knowl-edge of the graph may affect the ranking returned by the PAGERANKvalues. We remark
Fig. 2Example graphs : Darker vertices have a higherimportance(cp. “Preliminaries and problem” section)
The HAK measure
With our measure, we estimate quantitatively how reliable a crawl is with respect to the relative ordering of the PAGERANKvalues on its vertices compared to the corresponding target graph. To this end, we first try toestimate the size of the target graph: Given the crawled vertex set and the distinct hyperlinks on the corresponding webpages, some of which are pointing to an uncrawled page (ghost vertex), how big is the target graph or a subgraph that would potentially impact or contribute to the PAGERANKvalues of the vertices in the crawl? We show that for simple crawling strategies where it can be assumed that each vertex is part of the crawl independently from all other vertices with some sampling probabilityps, the size of the target graph can be estimated in terms of a very simple property of the crawled vertices, namely, the fraction of its crawled neighbors, referred to asfidelity. Secondly, we try toestimate the impactexerted by the vertices in the target graph on the crawled vertices, which we in turn use to estimate the number of discordant pairs in the crawl. We now describe in detail the construction of the HAK measure. LetC=(VC,EC)denote thecrawled graphand letnbe the number of vertices in this graph. The main steps in our computation are as follows:
1 Estimate the size of the target graph by using connectivity properties of the crawl. LetT =(VT,ET)represent the target graph.
2 Estimate theimpact (as functions of PAGERANK) of the vertices inVC. 3 Assume that the vertices inVT exert similar impacts on other vertices. 4 Estimate the number of discordant pairs due to impacts exerted by vertices in
VT−VC on vertices inVC. Estimating the target graph
LetN denote the number of vertices in the target graph. In this section we will estimate the value ofN assuming that the crawl is constructed by sampling vertices from the tar-get graph independently and uniformly at random with some probabilityps. Note that if psis known, one can easily estimateN aspsn. We therefore first estimatepsfrom the con-nectivity properties of the crawl and the target graph, for which we need the following definition:
For any vertexv∈VT, we definefidelity(γ (v)) ofvas the ratio of its immediate neigh-bors inVC to its total out-degree (number of distinct hyperlinks on a webpage pointing to vertex inVT). Letdc(v)count the number of verticesv ∈VC reachable fromvin one step (hop) andd(v)denotes the total out-degree ofv.
Definition 4(Fidelity)The fidelity of a vertex v∈T,γ (v), is given byγ (v)= dcd((vv))and the average fidelity of all vertices in C isγ (C)=
v∈VCγ (v)
We will now show thatE(γ (v)) = ps(1 −P(d(v)=0)). In essence we would like to estimate the unknown sampling probability that is used to generate the crawl using empirically computable fidelity of the observed crawl.
Proposition 1Let for some 0 < ps < 1, each vertex in the target graph is sampled independently and uniformly at random with probability ps. For any v ∈ T,E(γ (v)) = ps(1−P(d(v)=0)).
ProofThe probability that a vertex has fidelity/kis given by
P
γ (v)= k
= P(dc(v)=|d(v)=k)·P(d(v)=k)=
k
ps(1−ps)k−P(d(v)=k). The expected value of fidelity ofTcan now be computed as
E(γ (v))= k≥1
≤k k k
ps(1−ps)k−P(d(v)=k)
= ps
k≥1
P(d(v)=k) k
=1
k−1 −1
ps−1(1−ps)k− =ps(1−P(d(v)=0)).
Withps as the sampling probability,psN gives us the expected number of vertices in the crawl. Using Proposition1we obtain
N = E(|VC|)
E(γ (v))(1−P(d(v)=0)).
We note that for Web graphsP(d(v)=0)is the probability that a webpage has no links to other webpages, i.e., there exists a page with pure text and no links. Such a sce-nario is extremely rare on the Web. Moreover, for synthetic graphs generated usingGn,p (s. “Synthetic graphs” section) one can show thatP(d(v)=0) = e−O(np), which goes to zero forn→ ∞and constantp. Note that as we do not have complete information about the target graph we cannot computeγ (v)for all vertices inVT. We instead approximate it by the observed average fidelity of the crawl,γ (C). This amounts to assuming that the degree distribution of target graph with respect to number of pointing inside the crawl and outside is homogeneous for all vertices in the target graph. Hence, using the observed averageγ (C)and the observed size of the crawl, i.e.,n, ignoring the multiplicative factor of 1−P(d(v)=0)(asP(d(v)=0)=o(1)for all practical purposes), we can approximate
N asγ (nC).
PageRank and impacts
In this section we present a heuristic to measure the PAGERANKcontribution of a vertex to its neigbors in the crawl, which we then use to estimate the contribution of ghost ver-tices to their neigbors in the crawl, as if the PAGERANKalgorithm ran on the whole target graph. In the following, we first define a measure that we will extrapolate for the ghost vertices in the next subsection.
(Haveliwala1999). We then define theimpactof a vertexv∈Con a neighboru∈N(v)as Im(v,u)= π(v)/d(v)
π(u) .
The impact on any vertexu ∈ V is π(1u)v:u∈N(v)π(d(vv)), which is always 1. This implies that an extra impact ofxon a vertex will increase its PAGERANKbyxtimes the current PAGERANK. The total impact of a vertexv,Im(v)is then defined as
Im(v)= u∈N(v)
Im(v,u)= u∈N(v)
π(v)/d(v) π(u) =
1 d(v)
u∈N(v) π(v) π(u).
We denote the average of impacts of vertices inCbyIm(C), i.e.Im(C)=
v∈CIm(v)
n .
In the next subsection we will compute the impact of ghost vertices on the vertices in the crawl assuming that each ghost vertex exerts on average an impact ofIm(C)on its neighbor.
Estimating the impact of ghost vertices
We next compute the impact that could have been exerted by the ghost vertices on the crawled vertices. For this we assume that the impact of each vertex inTisIm(C), which gives us thetotal impact,I, exerted by ghost vertices as
I= |T−C| ·Im(C)=n
1 γ (C) −1
·Im(C).
To understand the intution behind this extrapolation of impacts, consider the extreme case, i.e., whenIm(C)is close to 0. This can happen when for vertices in the crawlγ (v)is very small, i.e., vertices in the crawl have relatively high number of ghost neighbors. Note that we estimate the ground truth, i.e., the PAGERANKof vertices in the target graph with respect to (personalized to) the crawl. This would mean that at each step of the random walk, there is a higher probability of coming back to a vertex in the crawl (as compared to the probability of going back to some random ghost vertex). This intuitively means that ghost vertices (in this setting where we use crawl as the seed) cannot generate impact much more than the impact initially generated by the crawl. SimilarlyIm(C)=1 implies that none of the vertices in the crawl has a ghost neighbor, i.e.,γ (C)=1, and therefore, the total impact of the ghost vertices will be 0. In terms of computing the PAGERANKin the target graph, this implies that the set of ghost vertices is unreachable from the crawl, and hence, will have no effect on the PAGERANKof vertices in the crawl as the crawl acts as the seed set.
Some of this extra impact (generated due to ghost vertices) will be acquired by some or all of the vertices inC, changing their PAGERANKvalues accordingly. This is reflected by the pairs of each two crawled vertices(v,u) ∈ C×Cfor which their order in the ranking flip, i.e., discordant pairs, or is preserved, i.e., concordant pairs. Such flips or discordant and concordant pairs of vertices are the main ingredients ofKendall’s Tauand also estimated in HAK.
have low PAGERANKSin the modified graph. Therefore, the effect of the loss of informa-tion is observed mostly on the PAGERANKSof the nodes higher in the original ranking. We checked experimentally several variants for impact distributions and the best variant, which is affirmative with our tests on real-world and synthetic graphs, is to distribute the total impactIequally amongIvertices. IfIis the number of impacted vertices inT, then theexpected number of impacted verticesthat belong to the crawled set will be
I=I·γ (C).
In the worst case, each of these impacted vertices will result in forming a discordant pair with each of the unaffected vertex, we obtain the number of discordant pairs as
D=(n−I)·I. (1)
We recall that with our measure we aim at estimating the ranking deviation between the crawl and target graphs by means ofKendall’s Taurank correlation coefficient, which is based on concordant and discordant pairs among the rankings. As an example, if a pair of vertices from the crawled graph,(vi,vj), have the same relative ranks in both the ranking measures ( i.e., when measured using only crawl and when measured using the target graph), then such a pair is called a concordant pair. One the other hand, ifviis ranked higher thanvjin one ranking whereas the other way around in the other ranking, then it constitutes a discordant pair. Now the total number of vertex pairs in the crawled graph isn(n−1)/2. We already computed an estimate of discordant pairs in (1).
We therefore compute HAK measure as follows:
HAK=#concordant pairs - #discordant pairs
# total pairs =
n(n−1)
2 −D−D
n(n−1) 2
=1−4· D n(n−1).
(2)
In the next section we answerRQ IIIby proposing an approach for finding components of the crawl which exhibit a good rank correlation with respect to the target graph.
Time Complexity.The theoretical time complexity of HAK computation isO(m)where min the number of edges in the crawl. Note that the first step in order to compute HAK is the computation of fidelity of a vertexvrequires looking at each of its outgoing neigh-bors. Therefore, the computation of average fidelity of the crawl requiresO(m)time. The next step is to compute PageRank of all vertices in the crawl which takesO(m)time. Com-putation of impact of crawl is againO(m)as for each vertex one has to compute impacts by incorporating the PageRank of each of its outgoing neighbors. The rest of the HAK computation then requiresO(1)time.
High-fidelity component selection
So far, we have concerned ourselves in computing a local measure that estimates deviation of ranks induced by PAGERANK, i.e., it serves as a confidence measure for PAGERANK
computation over a crawl with respect to its target graph. In this section, we propose an algorithm to identify small (connected) subgraphs from the input graph/crawl that potentially have lower rank deviations.
Algorithm 1:High-fidelity Component Selection Algorithm Data: input graphGinput=(Vinput,Einput)
Parameter: fidelity thresholdτ
Result: high-fidelity connected components
1 begin
2 initout←min{d(v)|v∈Vinput∧d(v) >0}
3 V ← {v∈Vinput|d(v)≤initout}
4 E← {(m,n)∈Einput|m∈V∧n∈V}
5 G←(V,E)
6 while|{v∈Vinput\V |γG(v)≥τ}|>0do 7 V ←V∪ {v∈Vinput|γG(v)≥τ} 8 E← {(m,n)∈Einput|m∈V∧n∈V}
9 G←(V,E) 10 end
11 result←ConnectedComponents(G) 12 end
that optimize for our HAK measure, which estimates the Kendall’s Tau. Unfortunately, any routine to optimize for HAK would induce an expensive global computation per can-didate subgraph to compute the average impact in the graph (cp. “The HAK measure” section). Especially for Web graphs with millions of vertices, computing HAK on the refined subgraphs in each iteration is computationally infeasible. In our algorithm, we rather optimize for the most important ingredient of the HAK measure, namely fidelity of the given crawl, which we also use to estimate the target graph (cp. “The HAK mea-sure” section). Intuitively, high fidelity in a graph translates to fewer vertices potentially losing impact in PAGERANKtoghost vertices, which in turn reduces their effect on the crawled vertices. This reduces the number of affected vertices as well as discordant pairs. In essence, the fidelity criterion can be set by the system designer based on the intended confidence level for the output graphs. We now state the formal definition of our problem of findinghigh-fidelity components.
Definition 5(High-fidelity Component Selection) Given a crawl or input graphG, we are interested in selecting a set of maximal connected subgraphs of high fidelity given a fidelity threshold ofτ.
Selecting such components in a graph with high fidelity turns out to beNP-hardsince it is a generalization of theall-neighbors knapsack problem(equivalent whenτ = 1.0) as shown by Borradaile et al. (2012). To this extent, we propose aheuristic algorithm
We found that the naive pruning approach, which sequentially removes vertices under the threshold, returns very small components, even for smaller values of τ. Our algo-rithm, instead, first chooses from the input vertex setVinputa subsetV that contains all vertices with either 0 out-edges (fidelity is automatically 1, henceγ (v) > τ) or the min-imum non-zero out-degree in the input graph (initout). We then iteratively extendV by adding vertices for which the fidelity constraint is satisfied with respect to the current graphG(γG(v)≥τ), considering that all vertices inVinputbut not in yetV are ghost ver-tices. The resulting subgraph is the induced subgraph on the final vertex setV. Finally, we return all connected components in the resulting subgraph. The algorithm can be easily implemented in a distributed manner and in practice, as we will see in the experiments, the connected components in the resulting graph actually exhibit very low variance rank deviations with respect to the ranking of the target graph.
Experiments
To validate our research questions enumerated in “Introduction” section we consider a host of large real-world graphs as well as synthetic graphs of different structures and carefully consider crawling strategies over them. In what follows we first describe our setup and rationale for our evaluation, before we discuss the results of HAK and our High-fidelity Component Selectionapproach.
Experimental setup
In order to evaluate HAK one require the availability of crawls as well as the target graphsthat these crawls were derived from. This is necessary in order to compute how the rankings on both graphs differ and to evaluate the performance of HAK to estimate this deviation. In reality, neither obtaining the target graph is possible nor the actual crawl policy can be determined accurately. To this extent, we consider very large (as full as possible) real-world graphs under the assumption that those graphs are fully discovered (“Real-world graphs” section). We additionally simulate alternative topological structures by generating synthetic graphs (“Synthetic graphs” section). We then simulate crawls on these graphs using different crawling strategies (“Seed selection and crawling” section). For all graph and crawl combinations we ran PAGERANKon both graphs (crawl and target graphs) and compared the rankings using Kendall’s Tau to evaluate HAK (“Evaluation strategy” section).
Real-world graphs
The experiments on real-world graphs were run on a computer cluster using Apache Sparkand its graph processing frameworkGraphX(Xin et al.2013). Loading the graphs locally on a single server was impossible with our available infrastructure because of their sizes of up to more than 100M vertices and 10B edges. As discussed earlier, we obtained multiple large real-world graphs that themselves had missing information and considered them as target graphs by discarding edges that connect to ghost vertices. The following graphs were analyzed and are summarized in Table1:
Table 1Statistics on the studied real-world graphs, see “Seed selection and crawling”
and “Real-world graphs” sections for details (#V: original number of vertices, #E: original number of edges, #Vtarget: target number of vertices, #Etarget: target number of edges)
GOV DE UK Friendster
#V 301,128,778 247,641,473 39,454,746 68,349,466
#Vtarget 5,418,054 133,895,590 38,838,959 61,100,375
#E 2,111,229,433 14,795,732,782 936,364,282 2,586,147,869
#Etarget 180,657,788 10,085,242,536 928,939,162 2,575,600,737
• DE:LikeGOV, this.deTLD graph was also extracted from webpages archived by theInternet Archive, crawled in 2012 and generously provided to us in the project Alexandria2.
• UK:This.ukTLD crawl from 2005 is publicly available, already in the form of a graph without corresponding webpages (Boldi and Vigna2004; Boldi et al.2011).
• Friendster:Unlike the previous Web graphs, this is a publicly available social network, extracted from an extensive crawl of the former online platform Friendster.com in June 2011 (Archiveteam2011).
Synthetic graphs
In order to investigate ranking deviations caused by different crawling strategies on dif-ferent graph topologies, we ran a more comprehensive set of experiments on smaller, synthetically generated target graphs. This allowed for more extensive experimentation as the experiments could run locally on a single server, using theNetworkXgraph anal-ysis framework (Hagberg et al.2008). All synthetic graphs that we studied in this work (cp. Table2) were generated with 10,000 vertices to be reasonably sized for a thorough analysis.
The graphs were constructed using well-known graph generators, except for FFBack-links, which is an extension by us to theForestFiremodel. AlthoughForest Firegraphs include cycles, the model never generatesbacklinksfrom the early created vertices, which are more likely to receive many in-links over time, to newer ones. However, these links are common on the Web, where already prominent pages add links to less important ones, having a strong impact on the value propagation in PAGERANK (s. “Preliminaries and problem” section). In this graph, we added such edges between 0.05% of all pairs of an old and young vertex.
Seed selection and crawling
Crawling can be considered a special case of network sampling from a more practical point of view, where subsequent vertices can only be chosen from already discovered ones or seeds. Maiya and Berger-Wolf (2011) define this type of sampling aslink-trace sampling
Table 2Synthetic graphs (all have 10,000 vertices)
Graph generator #Edges Parameters
Gn,p(Erd ˙os and Rényi1959; Gilbert1959) 299,722 p≈0.0003 (based on#Ein Table1)
ScaleFree(Bollobás et al.2003) 21,732 α=0.41,β=0.54,γ=0.05 (default)
ForestFire(Leskovec et al.2007) 87,060 pf=0.37,pb=0.32 (most realistic (Leskovec et al.2007))
FFBacklinks 96,262 pf=0.37,pb=0.32,pbacklink=0.0005
and give a nice overview of available models for this behavior. Naturally, such approaches commonly exhibit BFS-like (Breadth-First Search) growth, but feature different strate-gies to prioritize or select the next vertices to be crawled. These variations determine the probability of a vertex to be part of the final sample.
How we model crawls.Although most crawlers employ BFS-like traversals, there are practical constraints like random timeouts and crawl restrictions on websites that make it hard to model crawls perfectly. Therefore, we focus on the most impartial strategy, which is vanilla BFS, but explicitelyproduce partial crawlsby dropping randomlyx% of the vertices of the input graph (wherex∈ {10, 20, 30, 40, 50}). We refer to this percentage as theblock fractionand the remainder asdesired fraction.
Statistics about the target graphs (Vtarget and Etarget), which are potentially
reach-able from the seeds by not blocking any vertices are shown in Treach-able 1. Addition-ally, we discuss a few edge cases by looking at slight variations of BFS as well as SEC with the synthetic graphs. Due to their scale it was computationally infeasi-ble for us given our cluster setup to analyze these on real-world graphs as well. More details on the crawling strategies as well as our seed selection are given in “More details on crawling strategies and seed selection” section.
Evaluation strategy
The objectiveof this evaluation is to assess ranking deviations as quantified by Kendall’s Tau (cf. “Preliminaries and problem” section) for rankings induced by PAGERANK, com-puted on the target graph vs. a crawl and compare it against our HAK measure, which is designed to yield values on the same scale. For this, wefocus only on high-ranked ver-tices, as these are typically more interesting in most practical scenarios (Ng et al.2001a): Firstly, because there is no tangible score difference between the PAGERANKvalues of the tail vertices. Secondly, ranking deviations in authoritative vertices are typically con-sidered more severe than among the tail ones. Since Kendall’s Tau makes no distinctions where rank reversals take place, we compared the ordering among the top 30%, top 50% and top 70% vertices of the crawl and target graph that appeared in both graphs according to the corresponding PAGERANKvalues. This also helps us characterize where the rank reversals indeed do appear.
The rankingsfor each of the graphs are computed based on the PAGERANK values. While we employed the regular version PAGERANKon the crawl (with added ghost ver-tices as sinks), we used thepersonalizedvariant of PAGERANKfor running it on the target graph. In this version, the algorithm is personalized to a set of vertices, which constitute the starting points as well as teleportation destinations in the algorithm (Page et al.1999). The resulting PAGERANKvalues can be interpreted as their importance with respect to these vertices or the domain represented by the crawl. Both variants of PAGERANKran for 30 iterations with the damping factor parameter set to the frequently cited value of 0.85.
Crawls and ranking deviations in graphs
In this section, we aim to answerRQ Iand justify the need for estimating ranking devia-tions before employing PAGERANKfor incomplete graphs. In particular, we argue about the results where we witness noticeable ranking deviations of partial crawls with respect to target graphs.
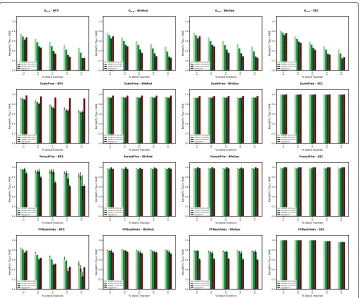
We clearly observe that all real-world graphs exhibit a decreasingτ with increasing block fraction (see Fig.3). Most acutely,τdecreases to 0.55 for theGOV. Synthetic graphs likeGn,pandFFBacklinks(first and last row in Fig.4) exhibit a similar trend withτ decreas-ing for increasdecreas-ing block fraction. On the other hand, for theScaleFree(second row) and ForeFiregraphs (third row), we do not witness much change in the ranking orderings, except in theBFScrawls.
A detailed study of the crawls reveals the reasons for such disparate trends forScaleFree andForeFire: the crawling strategy combined with the underlying structural properties of the graph sometimes lead to extremely small crawls (n<1, 000), much below the desired fraction (cp. “Seed selection and crawling” section). First, we observe a scarcity of back-linksinForestFireandScaleFree. That leads to these graphs to beDAG-likewithout an inadequate number of cycles in the corresponding graphs (cp. “Preliminaries and prob-lem” section). PAGERANKcomputations over such graphs (or over their subgraphs) tend to finish quickly since the lack of cycles prohibit the random walk to re-cycle back into the graph. This results in small high-fidelity crawls that do not exhibit large ranking devi-ations when highly linked vertices are prioritized, explicitly (SEC) or by chance (BfsRnd andBfsGeo). Only theBFSstrategy that explicitly blocks random vertices causes a devi-ation in these crawls, as top vertices may be missed as well (conceivable on the Web for different reasons, e.g., restrictive policies and random failures).
Fig. 4Ranking deviations measured and estimated with different synthetic graphs and crawls for different fractions of uncrawled vertices (rows) as well as different crawling strategies (columns). Averaged Ranking deviations in 100 crawls (generated using random seed sets) are presented along with 95% confidence intervals
Reinforcing our claim, the addition of backlinks inFFBacklinksresulted in a growing ranking deviation with increasing block fraction with theBFScrawling strategy. We argue that most of the real-world graphs will not be DAG-like and will havebacklinks induc-ing large cycles. Moreover, the random walk nature of PAGERANKcomputation increases
the importance of thesebacklinks(or feedback loops) towards reaching an equilibrium state. As the core structure ofFFBacklinksstill resembles the originalForestFiregraph, the observed rank deviation is much less severe as compared toGn,p.
In addition, we observe that the ranking deviations (in most of the presented cases) increase when we consider a small fraction of the most important vertices. This indicates that most of the low rank vertices in the target graph do not flip their ranks with the more important ones in the crawl, leading to a lower ratio of discordant pairs to the overall total number of pairs. On the other hand, crucial to most applications are the ranking deviations of thehighPAGERANKvertices, thus making it essential to monitor them.
Finally, we observe that ranking deviation in the Web graphs shown in Fig.3are inter-estingly similar to the random graphs in Fig.4and less so with other generative models likeForestFireorScaleFreegraphs. This, we believe, has strong implications in explaining the structure of Web graphs.
Effectiveness of HAK
assumption behind the construction of HAK is that each of the unseen or ghost ver-tices from the target graph would exert the same fraction of impact (on average) to the crawled set as the actual vertices in the crawl (cp. “The HAK measure” section). We ensure this by constructing the target graph such that each of its vertex has the same fraction of crawled neighbors as the crawled vertices (computed by fidelity). This assump-tion would not be followed by target graphs, which for example areDAG-like, because the ghost vertices there might not have edges back into the crawl. We remark that HAK cannot identify structures in target graph which are not similar to the crawl, yet leading to severe ranking changes in the crawl. For instance, consider a very small crawl with a very high fidelity and low impact. In such a case HAK would always estimate a very low ranking deviation. It could in the worst happen that there exist a few ghost vertices in the target graph with very high PAGERANK, having outgoing edges to only the low rank vertices in the crawl. Our results in Figs.3and4, on the other hand, support the effective-ness of HAK in most of the studied graphs and therefore also validate our assumptions behind HAK.
We first discuss our findings on synthetic graphs. HAK performs fairly well forGn,p, for instance with theBFScrawl strategy with 50% block fraction, we record an absolute error of 0.007 (actual average: 0.252, estimated: 0.259) for rank correlation of top 30% vertices. The little ranking deviations inScaleFreeandForestFirecan be attributed to the small crawls with high fidelity (γ ∈[ 0.93, 1.0]). As already discussed, HAK in these cases would always result in a high value, which also explains HAK adapting to the trends. However, we observe a larger deviation forBFScrawls inScaleFreegraphs. Here, HAK underestimates the ranking deviation, which might reflect the existence of the worst case (caused by the random vertex removal inBFS, cf. “Seed selection and crawling” section), resulting in a similar estimation as the one described above for very small crawls. However, HAK overestimates the deviation inFFBacklink(see the middle 2 plots shown in Fig.4). We attribute this to the fact that the average impact of the crawl increases in presence of backlinks(cp. “Preliminaries and problem” section), which is an overestimation of the actual impact sinceForest Fireis nevertheless the dominant topology in this graph. For our measure, a higher average impact corresponds to higher impact on the crawl from the ghost vertices (in our constructed target graph, cp. “The HAK measure” section), leading to increased number of discordant pairs. The uniformly random blocking strategy in the BFScrawls on the other hand might break suchbacklinks, which lead to a more realistic ranking deviation.
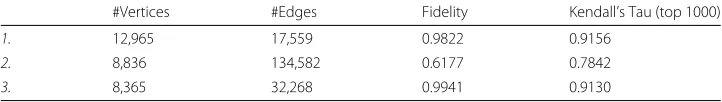
Table 3High-fidelity Component Selectionfor three largest components (out of 8998 identified components) of the 50% GOV crawl (withτ=0.5)
#Vertices #Edges Fidelity Kendall’s Tau (top 1000)
1. 12,965 17,559 0.9822 0.9156
2. 8,836 134,582 0.6177 0.7842
3. 8,365 32,268 0.9941 0.9130
In summary, the effectiveness of HAK is dependent on the fact that how well we estimate the target graph using properties like fidelity. Moreover, we would require big enough crawls to allow for a representative estimation3of the target graph. We believe that a more sophisticated use of the fidelity and impact of vertices in crawls, for instance using their distributions instead of simple average, will allow us to estimate the target graph and hence the ranking deviation more accurately. In addition, we plan to investigate more properties of the crawled graph, which can be used to predict the corresponding target graph. As our final goal, we will like to extend HAK as a black-box of measures, from which a suitable measure can be chosen in order to estimate ranking deviations in some particular crawl.
High-fidelity component selection
In this section we discuss the applicability of our proposed algorithm in selecting high-fidelity connected subgraphs that have low rank deviation when compared against the target graph. As mentioned in “High-fidelity component selection” section, we pro-vide a heuristic to find high-fidelity components, which might also be of interest for other applications (Borradaile et al. 2012). By applying our algorithm with threshold
τ = 0.5 to the highly distorted 50% crawl of theGOVgraph (Kendall’s Tau of 0.55, s. “Crawls and ranking deviations in graphs” section), we identified 8998 such components, featuring a reasonably high rank correlation. Table3shows the measured values for the three largest of these components, with vertex set sizes ranging from 8,000 to 13,000. As before, the evaluated rankings are based on PAGERANKpersonalizedto the respec-tive component (cp. “Evaluation strategy” section), resulting in correlations measured by Kendall’s Tau of over 0.9. We remark that, since the returned components are very small, a relatively large fraction of vertices withlow importanceare already present among the top 30% as studied before (cp. “Evaluation strategy” section). In addition, their inter-PAGERANKdistances are so small, that a small change in their PAGERANK values give rise to a larger number of discordant pairs, resulting in low rank correlation values for the whole component. We, therefore, report the measured values only for the top 1000 vertices.
As our algorithm returns a high number of components and we believe that compo-nents with higher fidelity will have correspondingly high rank correlation values, the desired components may be filtered with respect to their size and final fidelity values.
We recall that we optimize for high fidelity instead of our HAK measure with this approach, because of the associated high computational costs. Moreover, due to the unsuitability of using HAK for evaluating small crawls as discussed in “Effectiveness of HAK” section, we do not compare the rank deviations of the identified
components with their corresponding HAK values. As a matter of fact, for such small components, HAK would almost always return a very high value.
Finally, we conclude two interesting facts from our results: First, our original assump-tion in HAK about the close relaassump-tion of fidelity with the rank deviaassump-tion is justified by our results. We observe that components with higher fidelity also exhibit a higher rank cor-relation with respect to the target graph. Second, it suffices to use a low thresholdτto be able to select high-fidelity components. Settingτto a higher value increases the fidelity of the returned components, but these components would be too small to be of any practical use.
More details on crawling strategies and seed selection Crawling strategies
• BFS:The breadth-first search (BFS) starts from a set of seed vertices and runs until all vertices are reached. A number of vertices according to the block fraction were chosen uniformly at random and blocked/discarded before the BFS, simulating vertices that cannot be crawled, e.g., due torobots.txt, slow response times, etc.
• BfsRnd:Instead of blocking vertices from the beginning we determine a number of vertices to pursue at each vertex, chosen uniformly at random from its outgoing edges. Additionally, we remove a random number of vertices according to the block fraction from the seed set and run the BFS until the specified desired fraction is discovered.
• BfsGeo:Similar toBfsRnd, but the number of edges to follow was geometrically distributed with parameterp=0.3, resemblingForrest Fire Sampling (Leskovec and Faloutsos2006).
• SEC:In thisSample Edge Count stategy (Maiya and Berger-Wolf2011), at each step the number of edges from the crawled vertices to all remaining vertices are tracked and those with incoming edges are prioritized.
Seed selection
We found out that the most realistic seed selection strategy is to pick the most important vertices as seeds. This is also the case for real crawls as these correspond to more well-known pages. To identify such pages in our target graphs, we first ran PAGERANKon them and constructed the seed set from the top 1%. This allowed us to reduce the size of the large real-world graphs by pre-computing the actual target graphs, consisting only of vertices that are reachable from the seeds (s. Table1,VtargetandEtarget). Interestingly, for
theGOVandDEgraphs, the size difference of the target graphs compared to the originally provided graphs is huge, which confirms common characteristics of these Web archive graphs, i.e., they are not constructed in one crawl, leading to a fairly large number of unimportant vertices (with no in-edges) that were discovered from crawls outside target graphs. TheUKandFriendstergraphs on the other hand remained at almost the same size, suggesting that they have already been created that way in the first place, which proves our seed selection strategy actually realistic.
Conclusion
measure, which can reliably estimate such deviations purely on the crawl without any knowledge of the original graph. We also presented an algorithm that is capable of select-ing multiple connected subgraphs (high-fidelity components) from the crawl in which the relative ordering is much closer to the original ranking.
Our results suggest that crawled Web graphs behave surprisingly similar to random graph models and unlike other generative Web models, such as Forest Fire, in terms of PAGERANKdeviations. Thus, this study on crawled Web graphs could be important in
studying the structure of the Web as well. For future work, it would be interesting to check if Web graphs are indeed composed of local random structures. Further, from the insights on the effect of backlinks in this work, we intend to look into other representative formal Web models. Also, we would like to investigate the applicability of our measure to determine the confidence of results produced by other centrality measures on partially discovered graphs. Finally, understanding the high-fidelity components might also allow us to identify vertices that cause a severe ranking deviation if not present in a crawl, which is valuable in improving crawling strategies.
Abbreviations
HAK : Holzmann Anand Khosla
Acknowledgements
We thank the anonymous reviewers for their valuable comments which helped in improving the manuscript. The publication of this article was funded by the Open Access Fund of the Leibniz Universität Hannover.
Authors’ contributions
HH performed the study and specifically proposed the HAK measure. MK developed the theoretical framework for explaining and supporting the HAK measure. AA proposed experiments to evaluate HAK. All authors analyzed the results and wrote the manuscript.
Funding
This work is partially funded by SoBigData (European Union’s Horizon 2020 research and innovation programme under grant agreement No. 654024).
Availability of data and materials
This GOV graph is based on crawled webpages provided by theInternet Archive(The Internet Archive1996). It was extracted from the latest captures of all their archived webpages under the.govtop-level domain (TLD) from 2005 to 2013. The DE graph was also extracted from webpages archived by theInternet Archive, crawled in 2012 and generously provided to us in the project Alexandria4.This UK graph TLD crawl from 2005 is publicly available, already in the form of a graph without corresponding webpages (Boldi and Vigna2004; Boldi et al.2011). Friendster is a publicly available social network, extracted from an extensive crawl of the former online platformFriendster.comin June 2011 (Archiveteam2011).
Competing interests
The authors declare that they have no competing interests.
Author details
1Internet Archive, 300 Funston Avenue, San Francisco, USA.2L3S Research Center, Leibniz University, Appelstrasse 9a, 30167 Hannover, Germany.
Received: 27 February 2019 Accepted: 30 August 2019
References
Archiveteam (2011) Friendster Social Network Dataset: Friends.https://archive.org/details/friendster-dataset-201107, published under CC0 1.0 Universal
Bianchini M, Gori M, Scarselli F (2005) Inside pagerank. ACM Trans Internet Technol (TOIT) 5(1):92–128
Boldi P, Lonati V, Santini M, Vigna S (2006) Graph fibrations, graph isomorphism, and pagerank. RAIRO-Theor Inform Appl 40(2):227–253
Boldi P, Rosa M, Santini M, Vigna S (2011) Layered label propagation: A multiresolution coordinate-free ordering for compressing social networks. In: Srinivasan S, Ramamritham K, Kumar A, Ravindra MP, Bertino E, Kumar R (eds). Proceedings of the 20th international conference on World Wide Web. ACM Press. pp 587–596.https://doi.org/10. 1145/1963405.1963488
Boldi P, Santini M, Vigna S (2004) Do your worst to make the best: Paradoxical effects in pagerank incremental computations. In: International Workshop on Algorithms and Models for the Web-Graph. Springer. pp 168–180. https://doi.org/10.1007/978-3-540-30216-2_14
Boldi P, Vigna S (2004) The WebGraph framework I: Compression techniques. In: Proc. of the Thirteenth International World Wide Web Conference (WWW 2004). ACM Press, Manhattan. pp 595–601.http://law.di.unimi.it/datasets.php Bollobás B, Borgs C, Chayes J, Riordan O (2003) Directed Scale-free Graphs. In: Proceedings of the Fourteenth Annual
ACM-SIAM Symposium on Discrete Algorithms. Society for Industrial and Applied Mathematics, Philadelphia. pp 132–139.http://dl.acm.org/citation.cfm?id=644108.644133
Borradaile G, Heeringa B, Wilfong G (2012) The knapsack problem with neighbour constraints. J Discret Algoritm 16:224–235.https://doi.org/10.1016/j.jda.2012.04.011
Costa M, Gomes D, Silva MJ (2017) The evolution of web archiving. Int J Digit Libr 18(3):191–205
Dasgupta A, Kumar R, Sarlos T (2014) On estimating the average degree. In: Proceedings of the 23rd international conference on World wide web. ACM. pp 795–806.https://doi.org/10.1145/2566486.2568019
Erd ˙os P, Rényi A (1959) On random graphs. Publ Math Debr 6:290–297
Ghoshal G, Barabási AL (2011) Ranking stability and super-stable nodes in complex networks. Nat Commun 2:394 Gilbert EN (1959) Random graphs. Ann Math Statist 30(4):1141–1144
Gjoka M, Kurant M, Butts CT, Markopoulou A (2011) Practical recommendations on crawling online social networks. IEEE J Sel Areas Commun 29(9):1872–1892
Hagberg AA, Schult DA, Swart PJ (2008) Exploring network structure, dynamics, and function using NetworkX. In: Proceedings of the 7th Python in Science Conference (SciPy2008)
Hardiman SJ, Katzir L (2013) Estimating clustering coefficients and size of social networks via random walk. In: Proceedings of the 22nd international conference on World Wide Web. ACM. pp 539–550.https://doi.org/10.1145/ 2488388.2488436
Haveliwala T (1999) Efficient computation of pagerank. Tech Rep:1999–31
Haveliwala TH (2002) Topic-sensitive pagerank. In: Proceedings of the 11th international conference on World Wide Web. ACM. pp 517–526.https://doi.org/10.1145/511511.511513
Holzmann H, Anand A, Khosla M (2018) Delusive pagerank in incomplete graphs. In: Complex Networks and Their Applications VII. pp 104–117.https://doi.org/10.1007/978-3-030-05411-3_9
Holzmann H, Nejdl W, Anand A (2016) The dawn of today’s popular domains: A study of the archived german web over 18 years. In: Digital Libraries (JCDL), 2016 IEEE/ACM Joint Conference on. IEEE. pp 73–82.https://doi.org/10.1145/ 2910896.2910901
Holzmann H, Nejdl W, Anand A (2017) Exploring web archives through temporal anchor texts. In: Proceedings of the 2017 ACM on Web Science Conference. ACM. pp 289–298.https://doi.org/10.1145/3091478.3091500
Hübler C, Kriegel HP, Borgwardt K, Ghahramani Z (2008) Metropolis algorithms for representative subgraph sampling. In: Data Mining, 2008. ICDM’08. Eighth IEEE International Conference on. IEEE. pp 283–292.https://doi.org/10.1109/icdm. 2008.124
Huurdeman HC, Ben-David A, Kamps J, Samar T, de Vries AP (2014) Finding pages on the unarchived web. In: Proceedings of the 14th ACM/IEEE-CS Joint Conference on Digital Libraries. IEEE Press. pp 331–340.https://doi.org/ 10.1109/jcdl.2014.6970188
Katzir L, Liberty E, Somekh O (2011) Estimating sizes of social networks via biased sampling. In: Proceedings of the 20th international conference on World wide web. ACM. pp 597–606.https://doi.org/10.1145/1963405.1963489 Kendall MG (1938) A new measure of rank correlation. Biometrika 30(1/2):81–93
Kleinberg JM (1999) Authoritative sources in a hyperlinked environment. J ACM (JACM) 46(5):604–632
Leskovec J, Faloutsos C (2006) Sampling from large graphs. In: Proceedings of the 12th ACM SIGKDD international conference on Knowledge discovery and data mining. ACM. pp 631–636.https://doi.org/10.1145/1150402.1150479 Leskovec J, Kleinberg J, Faloutsos C (2007) Graph evolution: Densification and shrinking diameters. ACM Trans Knowl
Discov Data 1(1).https://doi.org/10.1145/1217299.1217301
Li RH, Yu JX, Qin L, Mao R, Jin T (2015) On random walk based graph sampling. In: Data Engineering (ICDE), 2015 IEEE 31st International Conference on. IEEE. pp 927–938.https://doi.org/10.1109/icde.2015.7113345
Maiya AS, Berger-Wolf TY (2011) Benefits of Bias: Towards Better Characterization of Network Sampling. In: Proceedings of the 17th ACM SIGKDD International Conference on Knowledge Discovery and Data Mining. ACM, New York. pp 105–113.http://doi.acm.org/10.1145/2020408.2020431,https://doi.org/10.1145/2020408.2020431
Ng AY, Zheng AX, Jordan MI (2001a) Link analysis, eigenvectors and stability. In: Proceedings of the 17th International Joint Conference on Artificial Intelligence - Volume 2, IJCAI’01. Morgan Kaufmann Publishers Inc., San Francisco. pp 903–910 Ng AY, Zheng AX, Jordan MI (2001b) Stable algorithms for link analysis. In: Proceedings of the 24th annual international
ACM SIGIR conference on Research and development in information retrieval. ACM, New York. pp 258–266 Page L, Brin S, Motwani R, Winograd T (1999) The PageRank Citation Ranking: Bringing Order to the Web. In: Technical
Report. Stanford InfoLab. Previous number = SIDL-WP-1999-0120.http://ilpubs.stanford.edu:8090/422/ Smith JA, Moody J (2013) Structural effects of network sampling coverage i: Nodes missing at random. Soc Netw
35(4):652–668
Smith JA, Moody J, Morgan JH (2017) Network sampling coverage ii: the effect of non-random missing data on network measurement. Soc Netw 48:78–99
The Internet Archive (1996) The Internet Archive.http://archive.org
Vattani A, Chakrabarti D, Gurevich M (2011) Preserving Personalized Pagerank in Subgraphs. In: Proceedings of the 28th International Conference on International Conference on Machine Learning. Omnipress, USA. pp 793–800.http://dl. acm.org/citation.cfm?id=3104482.3104582
Wang T, Chen Y, Zhang Z, Sun P, Deng B, Li X (2010) Unbiased sampling in directed social graph. In: ACM SIGCOMM Computer Communication Review, ACM, vol. 40. pp 401–402.https://doi.org/10.1145/1851275.1851231
Xin RS, Gonzalez JE, Franklin MJ, Stoica I (2013) Graphx: A resilient distributed graph system on spark. In: First International Workshop on Graph Data Management Experiences and Systems, GRADES ’13.https://doi.org/10.1145/2484425. 2484427
Zhou Z, Zhang N, Gong Z, Das G (2016) Faster random walks by rewiring online social networks on-the-fly. ACM Trans Database Syst (TODS) 40(4):26
Publisher’s Note