R E S E A R C H
Open Access
Flood modelling for cities using Cloud
computing
Vassilis Glenis
1, Andrew Stephen McGough
2*, Vedrana Kutija
1, Chris Kilsby
1and Simon Woodman
2Abstract
Urban flood risk modelling is a highly topical example of intensive computational processing. Such processing is increasingly required by a range of organisations including local government, engineering consultancies and the insurance industry to fulfil statutory requirements and provide professional services. As the demands for this type of work become more common, then ownership of high-end computational resources is warranted but if use is more sporadic and with tight deadlines then the use of Cloud computing could provide a cost-effective alternative. However, uptake of the Cloud by such organisations is often thwarted by the perceived technical barriers to entry. In this paper we present an architecture that helps to simplify the process of performing parameter sweep work on an Infrastructure as a Service Cloud. A parameter sweep version of the urban flood modelling, analysis and visualisation software “CityCat” was developed and deployed to estimate spatial and temporal flood risk at a whole city scale – far larger than had previously been possible. Performing this work on the Cloud allowed us access to more computing power than we would have been able to purchase locally for such a short time-frame (∼21 months of processing in a single calendar month). We go further to illustrate the considerations, both functional and non-functional, which need to be addressed if such an endeavour is to be successfully achieved.
Keywords: Cloud computing, Task execution, Flood modelling, Parameter sweep execution
Introduction
We are now able to collect vast quantities of data about the physical world but this has little significance until we are able to process it, through analysis or simulation, to extract understanding and meaning. The so called fourth paradigm [1] of data-intensive discovery often requires significant computational power. All sectors of society (commercial, public and academic) have a need to exploit this new approach.
For large organisations (companies, governments or large research projects) access to appropriate levels of computational resources is easily within their reach. How-ever, for smaller organisations this can often be beyond their means – especially if the organisation is not expect-ing to make significant use of the resources. Tradition-ally these organisations have relied on access to shared resources managed by others or making do with the resources available – which may preclude them from
*Correspondence: [email protected]
2School of Computing Science, Newcastle University, Newcastle upon Tyne, UK
Full list of author information is available at the end of the article
meeting tight deadlines or require them to make promises in order to achieve these deadlines. These com-promises may be through reduced complexity models (simpler or less realistic) or the processing of smaller data sets than desired.
The problem outlined above is no more prevalent than in cases where an organisation is required to complete a task within pre-defined budget and time-limit constraints. The use of the Cloud [2] offers a potential solution by allowing the organisation to gain access to vast quan-tities of computing power almost instantaneously, often far greater quantities of computing power than the bud-get would allow them to purchase and use within the defined time-constraints and without the associated lead-time required to acquire and install resources. The use of the Cloud does, however, lead to a situation where after completion of the task the organisation lacks any collat-eral which could be used for future tasks. However, if such task requirements are rare these extra resources would have little if any value for the organisation. Thus the choice to use the Cloud or not rests on an analysis of the cost-time benefits of performing the work on the Cloud as
opposed to a comparison with upfront purchasing of the appropriate hardware resource(s).
The Cloud allows scaling of resource to meet current needs with payment being only for the time that the organisation ‘rents’ the resources. This allows organisa-tions access to a wide variety of computational resource types either not normally available to them or which would not gain enough utilisation to warrant purchasing.
Many organisations are required to run the same soft-ware (often developed by themselves or adapted to their own needs) multiple times with different starting condi-tions in order to determine characteristics about a prob-lem space or identify an “optimal” solution. This process, referred to as parameter sweep, can be performed in par-allel over a large number of computers and would seem to match nicely with the Cloud model of (apparently) infi-nite resources available on demand. If the same software is required by many different users then the process of performing the parameter sweep and this software can be made available to the end user in a Software as a Ser-vice (SaaS) manner in which the user interacts with the Cloud through an external interface with all work being performed for them. However, if the user wishes to run his/her own software then such a SaaS offering could be too restrictive. Instead tooling could be provided to an Infrastructure as a Service (IaaS) simplifying the pro-cess of performing parameter sweep executions. However, adding an external user interface to these tools would allow them to be exposed as a SaaS.
Once a decision is made to run large parameter sweeps on the Cloud, then the development of a parameter sweep-ready task is needed. This often requires making the jobs which make up the task parameter sweep-ready-removing the need to interact directly with each job thus allowing many jobs to be invoked quickly, and providing the correct environment in which to run the job [3]. Tasks then need to be enacted on the Cloud-provisioning appro-priate resources on the Cloud, uploading of executables to the Cloud along with any associated dependencies and data, the execution of the jobs and finally the staging of data back to the organisation. This process is clearly non-trivial to perform and not unique to the Cloud–similar problems exist in Grid and other distributed computing environments.
Although the financial barrier to using the Cloud is (relatively) low, the technical aspect of actually using the Cloud is still a barrier to entry. Many organisations lack the technical expertise to deploy work to the Cloud and make efficient use of it, reducing uptake. Also if digital technologies are not the core activities of the organisation neither should we expect them to be proficient in using Cloud infrastructure.
In this paper we propose a generic architecture which automates many of the stages in using the Cloud for
parameter sweep based batch-processing type problems, thus reducing the barrier to entry for organisations. We exemplify the use of this architecture for an applica-tion in pluvial flood risk assessment using the CityCat flood modelling simulation tool to identify areas of high flood risk during rare-event storms (once every one to 200 years). We further exemplify the cost-time implica-tions by having a limited budget of£20,000 (∼$32,500) and a project deadline of one month. Assessing both the perceived ‘best’ Cloud provider to use a priori along with an assessment of the performance achieved from running these simulations. We present preliminary results for the Pluvial flood modelling before consider-ing the non-functional issues encountered durconsider-ing this work.
Background and related work Flood risk assessment using CityCat
Pluvial flood risk analysis, where intense direct rainfall overwhelms urban drainage systems, is complex and time-consuming as it is sensitive to the spatial-temporal charac-teristics of rainfall, topography of the terrain and surface flow processes influenced by buildings and other man-made features. Assessment of urban flood risk is based on the results of flood models which provide the depth and velocity of surface water generated by intense rainfall. Sur-face water flow is well described by the two dimensional, depth averaged, hydrodynamic shallow water equations which are partial differential equations of time depen-dent conservation of mass and momentum [4]. These equations can only be solved using a numerical method which requires discretisation of the domain into small cells and discretisation of the period of simulation into small time steps.
Due to these computational complexities the assess-ment of pluvial flood risk is usually carried out at relatively small scales using a restricted number of design storms [7]. Alternatively, for large city-scale assessments, simpli-fied models are used [8]. The use of fully detailed numeri-cal models for larger areas is in its infancy for two reasons. Firstly, most of the models in this field are compiled as 32-bit applications and this limits the addressable mem-ory and constrains the size of the computational domain. Secondly, detailed modelling of larger areas results in high computational requirements which are best resolved using High Performance Computing (HPC) or cluster based facilities. However, such facilities might not be easily accessible to water consulting and engineering com-panies and local authorities that have to carry out flood risk assessment studies.
Cloud for computationally intense applications
Using the Cloud for computationally intense tasks has been seen in recent years as a convenient way to pro-cess data quickly. Deelman [9] evaluated the cost of using Amazon’s Elastic Compute Cloud (EC2) [10] and Amazon’s Simple Storage Service (S3) [11] to service the requirements of a single scientific application. Here we add the constraints of memory dominant executions under fixed time limits.
De Assuncao [12] proposed the use of Cloud computing to extend existing clusters to deal with unexpectedly high load – greater than that which can be handled locally. This work was further extended by Mattess [13] by proposing the use of Amazon spot instances, supply-and-demand driven pricing of instances, to further reduce the cost of Cloud Bursting. Our approach differs to these in that we seek to optimise the execution of a single set of simula-tions rather than the general capacity of an organisation. However, we see that the use of spot instances could be a mechanism to increase the number of hours available for a given budget.
Palankar [14] showed the criticality of data locality in the Cloud. In our work we take into account the effects of uploading and downloading data from the Cloud by making use of Cloud storage facilities such as S3. This minimises external data transfers and allows instances to terminate sooner.
Evangelinos [15] evaluated the use of Cloud resources for running High Performance Computing applications, showing a decrease in performance in comparison with dedicated supercomputing facilities and more akin to low-cost clusters. However, as our application is processing parameter sweeps of jobs in a batch-processing manner (often referred to as High Throughput Computing) we do not expect to see the same degradation in performance.
Lu [16] presents an application for processing gene sequences on the Cloud. Although this work is similar, in
batch-processing, to our own we present a more generic architecture.
Cloud execution architecture
Staff in many organisations do not possess the skills to per-form parameter sweep executions on the Cloud – starting up Cloud instances, deploying and managing jobs on these instances along with transferring data to and from the Cloud. Nor should they be expected to perform such tasks-especially if their need to use the Cloud is intermit-tent and not part of their main function. In this section we present an architecture which abstracts the user away from the complexities of using the Cloud to perform parameter sweep executions presenting them instead with a command line interface that captures the information required to run these executions on the Cloud.
Figure 1 shows the architecture for our system which interacts with an Infrastructure as a Service Cloud offer-ing. The user interacts with the system through the user interface – currently this is a command line interface though this could easily be replaced by a GUI or web por-tal. The user interface sends information to the Cloud Enactor which is responsible for deploying new cloud instances when required and terminating those that are no longer required. The Cloud enactor is also responsible for simple task deployment to the Cloud (starting a task off on a Cloud instance) along with monitoring these running tasks. We exploit the load-balancing facilities of existing batch queuing technologies such as HTCondor [17] in the situation where the number of Cloud instances is less than the number of parameter sweep jobs we wish to per-form. DeltaCloud [18] is used to abstract us away from the underlying Cloud infrastructure allowing our architecture to run over multiple Clouds.
The user interface collects information about the max-imum number of instances to use and the location of a compressed file containing the executable (or script to run) including any settings, dependencies or data required by the executable [3], other compressed files (which are assumed to be further data used by the executable), the number of runs which are to be processed, along with the name of the executable.
Cloud Enactor
Deploy
Terminate
Monitor
Delta Cloud
User interface
Figure 1Architecture for Cloud parameter sweep.Outline architecture for Cloud parameter sweep system.
Cloud interaction is handled through the Cloud enactor module. The archives are first uploaded to the Cloud data store (such as Amazon S3 [11]) before Cloud instances are deployed. Once deployed the Cloud enactor gives each instance the locations of the archive(s) in Cloud storage. The instance can then download and decom-press these before executing them. The system provides two execution models. If the maximum number of Cloud instances is smaller than the number of parameter sweep jobs then the tasks will be deployed through a HTCon-dor [17] cluster, provisioned by the Cloud enactor, formed from the deployed instances. We use HTCondor here as our own deployment mechanism does not support load-balancing of work across resources. However, if the number of Cloud instances matches the parameter sweep count then the jobs will just be deployed on the Cloud instances. This removes the overheads of deploying and using HTCondor on the Cloud just to execute a single job per instance.
Once a task has completed then the files which remain will be compressed before uploading to the Cloud stor-age. Due to data transfer costs the application developer is encouraged to delete any superfluous files as part of his/her executable (or script) before the job terminates.
Once all tasks are completed on a given instance then the instance will be terminated. All result data are uploaded to the user’s own storage space on the Cloud for later retrieval through the (command line) interface.
Parameter sweep enabling the CityCat application “CityCat” is an urban flood modelling, analysis and visu-alisation tool. It is based on the solution of the shallow water equations using the method of finite volume with shock-capturing schemes. Originally, CityCat was devel-oped and compiled as a 32-bit application using Borland Delphi [19], under the Windows operating system with an integrated Graphical User Interface (GUI) for data prepa-ration and visualisation of results. Figure 2 shows the
original GUI. Note that, as well as dividing the landscape up into a regular grid of cells, buildings are ‘stamped’ out of this grid. However, this configuration of CityCat is not easily usable in a parameter sweep consisting of many invocations as it requires the interaction of the user through the GUI in each invocation. In order to over-come this limitation a new version was developed by separating the computational engine from the GUI. The computational engine can be controlled through the use of configuration scripts which contain the initial parameters and the input/output file names.
The maximum addressable memory of 4GB for the 32-bit CityCat application limited the number of compu-tational cells to less than one million. To overcome this limitation a 64-bit version of the application was devel-oped and this enabled simulations of much larger domains using the high memory instances on the Cloud.
Deployment of a Windows application on the Cloud requires the installation of the Windows OS at each Cloud instance and this incurs additional costs. In order to avoid unnecessary expenditure and allow for 64-bit compila-tion (increasing the size of models that could be run), the model was ported and compiled under Linux using the Lazarus Linux IDE [20] and the Free Pascal compiler [21]. This had an impact on the performance of the code, increasing the execution time by approximately 10% – assumed to be a consequence of moving from 32-bit to 64-bit code and the Free Pascal compiler not optimising the code as well as the Delphi compiler. However, as the sav-ing in cost for ussav-ing Linux based instances was at least 20% this increase in execution time was considered acceptable as it was felt that the increase in the number of instances which could be run offset the increased execution time.
Scientific experimental environment
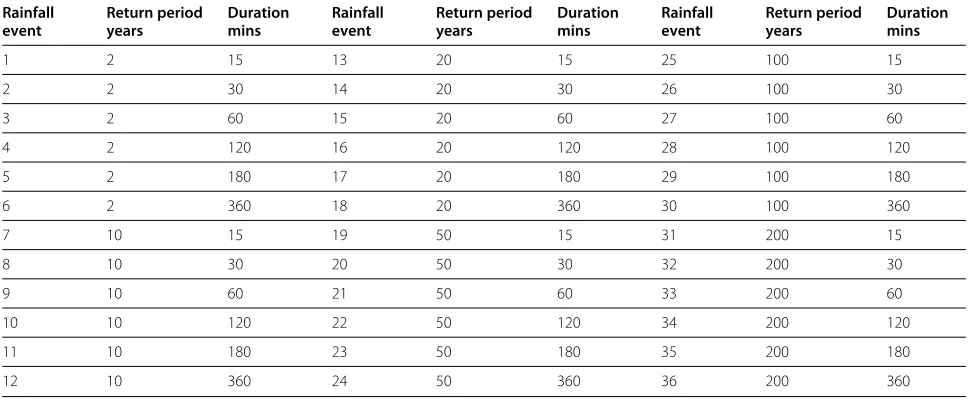
We have been able to apply the computational engine of CityCat to much larger domains and for more exten-sive event durations (through the ability to run multiple long-running simulations on the Cloud). Three different domains, ranging in size from one million to 16 million cells were tested, much larger than the domains used in current engineering practice – normally of the order of 5,000 to 50,000 cells. Additionally, for one of the domains, four different grid sizes were used which resulted in very different model sizes. Table 1 shows the different areas used within this work. All of the pluvial flood models were then run using a set of 36 rainfall events, containing a combination of six different return periods and six dif-ferent storm durations. See Table 2 for the storm details. Rainfall events were generated following the standard FEH procedure [22]. All these simulations required differ-ent memory and computational effort leading to differing run times. Table 3 presents the system requirements, in terms of memory, for these simulations. Note that the
index for these simulations (column 1) matches with the index (column 1) of Table 1.
Cost-time analysis for the CityCat simulations Here we investigate the cost-time analysis of using different Cloud options along with the relative cost for performing the same work on locally provisioned resources. The CityCat application is a single threaded simulation model which is memory dominant – we use the memory requirements which were presented in Table 3.
As it is not possible to tell a priori the exact amount of time that these simulations will take to perform we instead define two metrics by which to compare the cost of using each offering: cost per simulation hour and max-imum number of hours available within a single month. The cost per simulation hour for Cloud offerings is com-puted asp/cwherepis defined as the unit cost per hour, for the Cloud instance, andcis the number of concurrent runs of CityCat that the instance can handle without each run affecting the others. For locally provisioned resources we can define the cost per unit hour asp=E/M, whereE is the cost of purchasing the resource andMis the num-ber of hours during which the work we are conducting must be completed – in our case one month. We appreci-ate that this artificially gives higher values for purchasing resources locally and hence do not use this as justifica-tion for using Cloud resources over local resources, only including it here for comparison.
Although (in theory) the number of Cloud hours avail-able per month is infinite there are practical limitations on this, cost and vendor capping being the most significant. Each vendor provides a capping limit on the maximum number of instances which can be running concurrently – Amazon for example limits this to 20 per region – though this limit can be overcome through prior arrangement with the vendor. We therefore provide a figure for the number of hours available asc×i×h, wherecis the num-ber of concurrent runs of CityCat on the resource,iis the number of resources that can be run (the lower of 36 or the maximum number of resources which keeps us within
budget) and his the number of hours per month. The
same equation is used for locally provisioned resources withi limited to the number of resources which can be purchased.
Table 1 The different areas and scales used for the simulations
Domain Area Cell Boundary Event Number
size conditions duration of runs
1 Newcastle 4 km2 2 m Rainfall See rainfall 36
city centre events 1-36 events
2 Newcastle 4 km2 1 m Rainfall See rainfall 36
city centre events 1-36 events
3 Newcastle 4 km2 0.5 m Rainfall See rainfall 36
city centre events 1-36 events
4 Newcastle 4 km2 2 m Hypothetical 2 hrs 1
city centre flood wave
5 Whole Newcastle 120 km2 4 m Rainfall See rainfall 36
City Council area events 1-36 events
6 Thames ∼1100 km2 15 m Tidal surge 33 hrs 2
estuary water level and 21 hrs
large data problem (simulation set 3) – 40GB memory requirement.
Locally provisioned resources
A large server machine purchased by the School of Com-puting in November 2011 cost∼ £3,182 (∼$5,142), this had 12 CPUs and 128GB RAM. Table 4 shows the cost-time analysis for this resource. Given our initial budget we could have purchased six such servers. Note that the cost of installing managing and energy for these servers is not factored in here. We assume that the remaining money would cover these costs. We also do not factor in the time for delivery and commissioning of such systems – which would often take longer than our one month deadline – and appreciate that this cannot be fairly compared with
the Cloud. Hence, we do not use this as a justification for or against the use of the Cloud, rather just a compari-son of the cost for performing work on locally provisioned resources.
Amazon EC2 instances
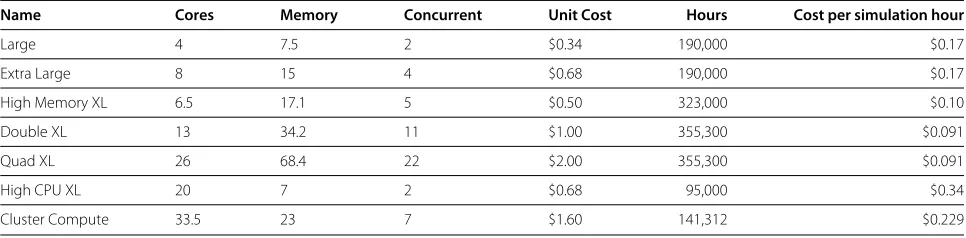
Amazon Elastic Cloud Compute (EC2) [10] offers com-putational power as an Infrastructure as a Service (IaaS). Amazon has a large range of computational offerings. Table 5 shows the cost-time analysis for EC2 for the 3GB simulation runs and Table 6 for the 40GB simulation runs. Note that in all cases only resource types capable of running the simulation are provided. Also note that the number of concurrent instances of the software is com-puted from the number of concurrent runs which can fit
Table 2 Frequency and duration of the different rainfall events
Rainfall event
Return period years
Duration mins
Rainfall event
Return period years
Duration mins
Rainfall event
Return period years
Duration mins
1 2 15 13 20 15 25 100 15
2 2 30 14 20 30 26 100 30
3 2 60 15 20 60 27 100 60
4 2 120 16 20 120 28 100 120
5 2 180 17 20 180 29 100 180
6 2 360 18 20 360 30 100 360
7 10 15 19 50 15 31 200 15
8 10 30 20 50 30 32 200 30
9 10 60 21 50 60 33 200 60
10 10 120 22 50 120 34 200 120
11 10 180 23 50 180 35 200 180
Table 3 Computational requirements (size and memory) for the six simulation areas
Number of cells Cell size Required memory
1 1,000,000 2 m 3 GB
2 4,000,000 1 m 11 GB
3 16,000,000 0.5 m 40 GB
4 1,000,000 2 m 3 GB
5 7,500,000 4 m 20 GB
6 ∼5,000,000 15 m 13 GB
into memory at the same time. As the code was unable to exploit more than one core the processor load was not considered.
In the case for the small simulation runs (3 GB) the Quad XL and Double XL instances show the best cost-time values. Thus going for the larger instances and running multiple simulations concurrently would appear to give better cost-time performance. Only one resource type is capable of running the large (40 GB) jobs–Quad XL.
Microsoft Azure instances
Microsoft Azure [23] offers a Platform as a Service (PaaS) option on which users are given a modified Windows 2008 server instance. At the time of analysis Azure was unable to offer instances capable of running the 40GB simula-tion. Table 7 shows the cost-time analysis for the Azure instance types running the 3 GB jobs.
Azure provides a very level offering in which the simula-tion cost per hour is the same for all instance types along with the number of hours which could be used within a month.
GoGrid instances
GoGrid [24] offers IaaS instances in which each offer-ing is effectively double, in core count, memory and disk space, the previous instance. GoGrid had instance types which support the 3 GB simulation jobs and the cost-time analysis is presented in Table 8.
GoGrid provides a slight advantage for their largest instance type (16/16/800) though this is more due to the ability to pack simulations more efficiently into memory than due to their costing model.
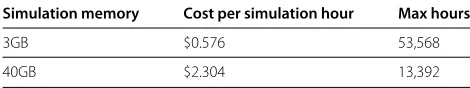
Table 4 Cost-time analysis for locally provisioned resources
Simulation memory Cost per simulation hour Max hours
3GB $0.576 53,568
40GB $2.304 13,392
RackSpace instances
RackSpace [25] is a UK based IaaS provider. It offers only one instance type suitable for the 3GB simulation runs – see Table 9. Being UK-based could be benefi-cial if restrictions require that work is performed within the UK although that was not a constraint in this case.
Summary
If we were to just take the raw cost for performing the work on the Cloud into account this would seem to make a compelling reason for choosing this option, with most providers managing to undercut the localy purchased hourly cost. However, if we factor in the ownership of the resources and the fact that they could be re-used for future projects the story is not so clear. Given a three year life-expectancy for a server this would require six months’ worth of use over the three year life for the 3 GB simula-tion jobs to be more cost-effective on the local resources than even the best Cloud offering whilst only around 1.15 months of the 40 GB simulations would be required over this time scale.
The biggest advantage in using the Cloud, however, comes from the number of hours of compute time which can be obtained within the one month available, pro-viding up to 563% more hours for the 3GB simula-tions and 20% for the 40 GB simulasimula-tions. When you factor in the number of simulations that can be pro-visioned concurrently (40 large (40 GB) simulations on Amazon EC2 as opposed to 18 large simulations on local resources) and the time to provision the resources (within minutes for the Cloud as opposed to the pur-chasing, delivery, installation, and configuration cycle for local resources) this makes the Cloud more appealing. The Cloud hours can be consumed within 16 days as opposed to the full 31 days for the locally provisioned resources.
Cloud simulation results
Table 5 Cost-time analysis for 3GB simulations on EC2
Name Cores Memory Concurrent Unit Cost Hours Cost per simulation hour
Large 4 7.5 2 $0.34 190,000 $0.17
Extra Large 8 15 4 $0.68 190,000 $0.17
High Memory XL 6.5 17.1 5 $0.50 323,000 $0.10
Double XL 13 34.2 11 $1.00 355,300 $0.091
Quad XL 26 68.4 22 $2.00 355,300 $0.091
High CPU XL 20 7 2 $0.68 95,000 $0.34
Cluster Compute 33.5 23 7 $1.60 141,312 $0.229
Newcastle city centre – simulation set 1
For these simulations an estimated runtime of 30 minutes to one hour was predicted. Four large Cloud instances were used (m1.large on Amazon), each with 7GB of RAM and four compute units. Although each resource was capable of running two CityCat simulations concurrently only one was run per Cloud instance. As the problem size was relatively small it was decided to run this as a param-eter sweep using fewer resources than the number of simulation runs. Thus HTCondor was used to perform job coordination. Figure 3 shows the execution timelines of the 36 simulations where each horizontal line represents the execution of a single simulation on Cloud comput-ers C1 to C4. All Cloud computcomput-ers were started between 08:50 and 09:30 and terminated by C1 – 06:30, C2 – 06:00 and C3 – 07:00 the following morning. Note that Com-puter C4 was terminated manually at 18:20 to determine if the system could cope with such a loss. This repre-sents some 76 hours of Cloud chargeable time at a total of $25.84 – large instances were $0.34 per hour in December 2011.
The total amount of simulation run-time for this was 29 hours and 21 minutes, giving an effective charge of $0.88 per hour of simulation. It should be noted that this does not take into account the time for transferring data files to and from the Cloud instances.
Data ingress to the Cloud was free whilst egress was charged at $0.12 per GB over the first GB. As the com-pressed data egress was 11GB this incurred a charge of $1.20 for data transfer.
Newcastle city centre – simulation set 2
Figure 4 shows the execution timelines for the Newcastle City Centre simulations – simulation set 2. The Amazon Quad XL instances used for this simulation set were
capable of running six simulations per instance, requir-ing a total of six instances. Simulations were allocated to instances in order – hence simulations 1 to 6 were run on instance 1. Note that simulation 36 was started manually later as there was a bug in the original code which failed to launch it.
The total simulation time for all 36 runs was 4,589 hours and four minutes. However, due to the order in which sim-ulations were allocated to instances the longest of each set of six jobs kept the instance alive even though the other simulations had finished. Thus the number of Cloud instance hours was 2,361 costing a total of $4,722. This equates to a real simulation cost per hour of $1.03. If jobs had been grouped by expected execution time then this could have brought the execution time down substantially. Manually re-ordering the jobs would bring the number of cloud hours down to 906 and the cost per simulation hour down to $0.395.
Data egress for this simulation set was 10GB resulting in a charge of $1.08. Note that all simulation sets apart from set 1 required downloading of their data during Decem-ber. The one free GB of data transfer has been arbitrarily discounted from this set.
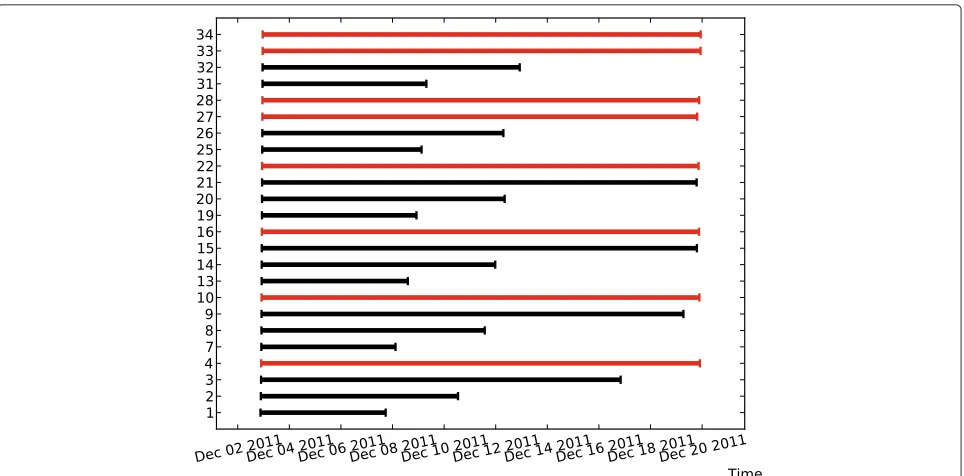
Newcastle city centre – simulation set 3
These simulations each required 40GB of RAM and were run individually on Amazon Quad XL instances. Figure 5 shows the timelines for these simulation executions. Note that only simulations 1 to 4 of each set of six were executed as it was decided that the runtime for simulations 5 and 6 would take us beyond our month deadline. The red time-lines indicate those simulations which failed to complete before the month deadline was reached. These simula-tions were manually terminated, although the results up till the point of termination are still valid.
Table 6 Cost-time analysis for 40GB simulations on EC2
Name Cores Memory Concurrent Unit cost Hours Cost per simulation hour
Table 7 Cost-time analysis for 3GB simulations on Azure
Name Cores Memory Concurrent Unit cost Hours Cost per simulation hour
Medium 2 3.5 1 $0.24 134,583 $0.24
Large 4 7 2 $0.48 134,583 $0.24
Extra Large 8 14 4 $0.96 134,583 $0.24
The simulations consumed a total of 6,856 hours and 50 minutes. However, with an average of three minutes to deploy the instance and decompress the files, along with an average of 30 minutes to compress the data and upload it to Cloud storage this brings the number of Cloud chargeable hours up to 6,929, costing $13,858. This equates to a real simulation cost per hour of $2.02. Thus the overhead for running this work on the Cloud is marginal. A total of 18GB of data egress was required for this simulation set at a cost of $2.16.
Newcastle city centre – simulation set 4
This single simulation was run on an Amazon High Mem-ory XL instance taking 33 hours and 54 minutes. This consumed 35 hours of Cloud time at a cost of $17.50. The data transfer for this single job was just 195M – less than $0.12. This single run produced a cost per simulation hour of $0.51. However, an extra simulation of the 36 rain pat-tern from set 6 was also run on this computer, thus giving greater utilisation of the hardware.
Whole Newcastle city council area – simulation set 5 These simulations each required 20GB of RAM allow-ing three simulations per Amazon Quad XL instance. Figure 6 depicts the timelines for these simulations. Note that the blue timelines indicate runs which were restarted due to an error in the system. The total simulation time is 3,623 hours and 21 minutes. With additional time for Cloud initiation, file decompression, file re-compression and file transfer this brings the number of Cloud charge-able hours up to 2,212 costing $4,424, thus giving a real simulation cost per hour of $1.22. This value is roughly twice the expected value due to the late start-ing of some of the jobs and the arbitrary orderstart-ing of jobs. Re-ordering of these jobs could have brought the number of Cloud hours down to 1,413 ($2,826) and a simulation hour cost of $0.780. A total of 12GB of data egress was required for this simulation set at a cost of $1.44.
Thames estuary – simulation set 6
Only two 13GB simulations were run for this case, those for simulations 24 and 36. These simulations took a total of 322 hours and 42 minutes. This was achieved through a total of 162 chargeable Cloud hours totalling $324. This gives a real simulation cost per hour of $1.006 – very close to optimal. Data transfer of 4GB added an additional cost of $0.48.
Preliminary result of the CityCat simulations We present preliminary results for two of the simulations presented in Section ‘Scientific Experimental Environ-ment’. The use of Cloud computing in performing these simulations has generated a large amount of output which now requires significant effort to process.
Newcastle city council area – simulation 5
The whole area of Newcastle City Council which covers approximately 120 km2, depicted in Figure 7, was used to demonstrate that by using Cloud Computing and City-Cat, organisations would be able to model areas of such scale for Surface Water Management Planning. Running the model at such a scale (cell count) allows more accu-rate predictions to be made. In urban catchments, water pathways are quite complex because they are influenced by the topography and man-made features. The conven-tional approach of detailed modelling of small domains is dangerous, however, because delineation of catchments can be difficult in complex and dynamic situations. Larger domains are therefore required to ensure inclusion of upstream sources which may not be obvious a priori.
Thames estuary – simulation 6
The largest domain we simulated was the Thames estu-ary with an area of approximately 1,100 km2. In order to keep the cell count within bounds we used a cell size of 15 m – resulting in five million cells. The propagation of the tidal surge upstream along the Thames was modelled to see if CityCat could also be used in coastal and fluvial
Table 8 Cost-time analysis for 3GB simulations on GoGrid
Name Cores Memory Concurrent Unit cost Hours Cost per simulation hour
Server 4/4/200 4 4 1 $0.76 42,500 $0.76
Server 8/8/400 8 8 2 $1.52 42,500 $0.76
Table 9 Cost-time analysis for 3GB simulations on RackSpace
Name Cores Memory Concurrent Unit cost Hours Cost per simulation hour
4096/160 1 4 1 $0.252 128,174 $0.252
flood risk studies. The boundary condition for this simu-lation was the tidal water level given as a function of time and placed at the east boundary of the domain. Figures 8 and 9 illustrate the Thames tidal surge at 27 and 31 hours after onset. The use of high-end Cloud instances allows us to model the effects of a tidal surge at an unprecedented level of detail and scale. This development could have sig-nificant impact on modelling of such phenomena around the world in the future.
Non-functional issues with Cloud deployment Local alternatives
As discussed in the section ‘Cost-time analysis for the CityCat simulations’ the main benefits of using the Cloud come more from the rapid provisioning of resources to meet immediate deadlines rather than the cost-effectiveness of resources, especially over the whole life-time of a resource. Large organisations, such as univer-sities, are constantly looking at the long term benefit of the purchases they make. Hence, given the scenario where money is to be spent on a short-term benefit of Cloud computing as opposed to purchasing of local resources which could be used by others over a longer period of time the university naturally favours the latter.
However, given a situation where strict deadlines pre-vent the purchasing of enough resources in a timely enough manner to meet requirements, this long-term view can often be too restrictive. A careful balance needs
Figure 3Simulation run times for Newcastle city centre (simulation 1).Time profile for the one million cell simulation of Newcastle City Centre at 2m by 2m resolution – simulation set 1.
to be drawn between short-term benefits and long-term goals. In an ideal environment all would favour the long-term goals and contribute their resources to a global pool allowing others to obtain their short-term requirements from this. However, if people instead favour the short-term benefits then none can benefit from the global pool. Persuading management that a short-term benefit is more important can often be a challenge and requires manage-ment to fully appreciate the need for rapid turn-around.
Credit cards
The (apparent) democratic process for access to Cloud resources is achieved by a credit card purchasing model. It is assumed that anyone in a position to purchase time on the cloud will be in possession of a credit card and that this is the Cloud providers’ only requirement for any user. Although this simplifies the process – if you have money (or credit) then you can use the resources – it has knock-on effects when purchasing significant amounts of computational time on the Cloud. A credit limit of say $10,000 is easy enough to obtain, though a limit of $32,500 which was needed for this project was much harder to obtain.
This problem was compounded by the fact that many large institutional organisations, including Newcastle University, have tight regulations on credit card spends. These include not only low credit limits but also maxi-mum values for individual purchases. Also as the exact cost of using the Cloud could not be determined a priori it was difficult to convince the finance department that this purchase was not going to spiral out of control.
Eventually a compromise was reached in which a lower credit limit could be used by splitting the Cloud usage over two billing periods along with tight monitoring of monies spent.
Conclusions
Cloud computing has enabled higher resolution larger scale modelling of pluvial flooding on a much larger scale than usually performed. Additionally, the use of the Cloud has provided access to enough resources to allow simulta-neous simulations of different rainfall events required in studies of flood risk.
Figure 4Simulation run times for Newcastle city centre (simulation 2).Time profile for the four million cell simulation of Newcastle City Centre at 1 m by 1 m resolution – simulation set 2.
study, which is currently being undertaken using crowed sourced images of the flooding over the whole Tyne urban area, will show the full potential for using Cloud comput-ing in urban flood risk management and will be reported elsewhere.
The city-wide application demonstrated here can be replicated for other cities in the United Kingdom using
readily available data sets from the Ordnance Survey (MasterMap building information) and airborne lidar available from various providers. Similar data are avail-able in many parts of the world and there is consideravail-able demand for such detailed urban flood risk assessments in the insurance industry, government authorities and other hazard management and civil protection agencies.
Figure 6Simulation run times for whole Newcastle city council area (simulation 5).Time profile for the 7,500,000 cell simulation of Newcastle City Centre at 4 m by 4 m resolution – simulation set 5.
Figure 8Thames estuary at 27 hours.Flooding of Thames estuary due to the 1000-year return period tidal wave after 27 hours.
These simulations produced a huge amount of detailed results which, in order to become meaningful to end users, need to be combined and presented in the form of maps and video animations. The automatic visual-isation and analysis of flood risk was lost when the numerical engine and the GUI of “CityCat” were sepa-rated in order to be deployed on the Cloud for parameter sweeps. Therefore, a potential area for further develop-ment is automatic creation of flood risk maps and ani-mations based on the CityCat results generated on the Cloud.
Although this work does not present a motivational case for using the Cloud based on financial concerns it does support the notion that Cloud computing can pro-vide rapid access to computational resources as and when needed without the need for significant financial outlay and continued expenses for maintaining the resources. This can be of particular benefit to organisations for whom performing such computational work is an infre-quent process.
Significant care needs to be taken to ensure high util-isation of Cloud resources to ensure that they are cost-effective. This is no different to the utilisation issues for existing HPC facilities. As each individually ‘rented’ resource is now charged for independently this can
quickly lower the utilisation and hence increase the cost per simulation hour. Adaptation of the Cloud deployment tool to take into account the expected execution time of the different runs could help alleviate much of this prob-lem. However, the additional costs for using the Cloud – data transfer and (de)compression – are relatively small in these cases and have little impact on the overall cost of using the Cloud.
The adaptation of an application to run as a parameter sweep is often a non-trivial task – as in this case. How-ever, this process only needs to be performed once and would still have been needed if the application were to have been run on locally provisioned resources. The ben-efits of adaptation of the code are easily apparent – the ability to run parameter sweeps of simulations concur-rently and the ability to script multiple scenarios quickly. This is an example of where closer inter-relationships between those experienced in using parameter sweep exe-cutions and the Cloud and those who are experts in the science is essential to ensure the transfer of appropri-ate skills. Although this process consumed a significant amount of effort, the ability to process more than 15,450 hours (∼21 months) of simulation time within one cal-endar month is significant and can be re-used easily in the future.
Competing interests
The authors declare that they have no competing interests.
Authors’ contributions
VG decomposed the CityCat execution engine from the GUI and produced the simulation run requirements. ASM and SW proposed and developed the architecture for performing parameter sweep applications on the Cloud and conducted the simulation runs on the Cloud. VK, VG and CK drafted the Abstract; Background (Flood Risk Assessment using CityCat); Parameter sweep enabling the CityCat application; Scientific Experimental Environment; Preliminary result of the CityCat simulations and parts of the Conclusions. ASM drafted the Introduction; Cloud for computationally intense applications; Cloud execution architecture; Cost-time analysis for the CityCat simulations; Cloud simulation results and Non-functional Issues with Cloud deployment. ASM and SW drafted parts of the Conclusions. All authors read and approved the final manuscript.
Acknowledgements
The authors are grateful to the EPSRC/JISC grant EP/I034351/1 which allowed this work to be conducted. The authors are grateful to the reviewers for their constructive comments.
Author details
1School of Civil Engineering and Geosciences, Newcastle University, Newcastle upon Tyne, UK.2School of Computing Science, Newcastle University, Newcastle upon Tyne, UK.
Received: 14 November 2012 Accepted: 5 March 2013 Published: 22 March 2013
References
1. Hey T, Tansley S, Tolle K (Eds) (2009) The Fourth Paradigm. Data-Intensive Scientific Discovery. Redmond, Washington. Microsoft Research. http://research.microsoft.com/en-us/collaboration/fourthparadigm/ 2. Armbrust M, Fox A, Griffith R, Joseph AD, Katz R, Konwinski A, Lee G,
Patterson D, Rabkin A, Stoica I, Zaharia M (2010) A view of Cloud computing. Commun ACM 53(4): 50–58
3. McGough AS, Lee W, Das S (2008) A standards based approach to enabling legacy applications on the Grid. Future Generation Comput Syst 24(7): 731–743. http://www.sciencedirect.com/science/article/pii/ S0167739X08000095
4. Wei Yan T (1992) Shallow water hydrodynamics. Elsevier Oceanography Series, vol 55. Elsevier, Amsterdam, p 434
5. Toro EF (2001) Shock-capturing methods for free-surface shallow flows. John Wiley & Sons, Chichester, p 309
6. Toro E (2009) Riemann solvers and numerical methods for fluid dynamics, third edition. Springer-Verlag, Berlin Heidelberg, p 724
7. Hunter N, Bates P, Neelz S, Pender G, Villanueva I, Wright N, Liang D, Falconer R, Lin B, Waller S, Crossley A, Mason D (2008) Benchmarking 2D hydraulic models for urban flooding. In: Proceedings of the ICE - Water Management, vol 161. pp 13–30. http://centaur.reading.ac.uk/1180/ 8. Neal JC, Bates PD, Fewtrell TJ, Hunter NM, Wilson MD, Horritt MS (2009)
Distributed whole city water level measurements from the Carlisle 2005 urban flood event and comparison with hydraulic model simulations. J Hydrol 368(1-4): 42–55. http://www.sciencedirect.com/science/article/ pii/S002216940900047X
9. Deelman E, Singh G, Livny M, Berriman B, Good J (2008) The cost of doing science on the Cloud: the Montage example. In: Proceedings of the 2008 ACM/IEEE conference on Supercomputing, SC ’08. IEEE Press, Piscataway, 50:1–50:12
10. Amazon Web Services. Elastic Compute Cloud. http://aws.amazon.com/ec2/
11. Amazon Web Services. Simple Storage Service. http://aws.amazon.com/s3/
12. de Assuncao MD, di Costanzo A, Buyya R (2009) Evaluating the cost-benefit of using Cloud computing to extend the capacity of clusters. In: Proceedings of the 18th ACM international symposium on High performance distributed computing, HPDC ’09. ACM, New York, pp 141–150
13. Mattess M, Vecchiola C, Buyya R (2010) Managing peak loads by leasing cloud infrastructure services from a spot market. In: Proceedings of the
2010 IEEE 12th International Conference on High Performance Computing and Communications, HPCC ’10. IEEE Computer Society, Washington, pp 180–188
14. Palankar MR, Iamnitchi A, Ripeanu M, Garfinkel S (2008) Amazon S3 for science grids: a viable solution? In: Proceedings of the 2008 international workshop on Data-aware distributed computing, DADC ’08. ACM, New York, pp 55–64
15. Evangelinos C, Hill CN (2008) Cloud computing for parallel scientific HPC applications: Feasibility of running coupled atmosphere-ocean climate models on Amazon’s EC2. In: Cloud Computing and its applications. https://my.cloudme.com/seadog5339/webshare/CloudComputing/ Cloud%20Computing/Applications/Cloud%20Computing%20and%20its %20Applications%20-%202008/Paper34-Chris-Hill.pdf
16. Lu W, Jackson J, Barga R (2010) AzureBlast: a case study of developing science applications on the Cloud. In: Proceedings of the 19th ACM International Symposium on High Performance Distributed Computing, HPDC ’10. ACM, New York, pp 413–420. http://doi.acm.org/10.1145/ 1851476.1851537
17. Litzkow M, Livney M, Mutka MW (1998) Condor-a hunter of idle workstations. In: 8th International Conference on Distributed Computing Systems. IEEE Computer Society, Washington, pp 104–111
18. Apache Software Foundation. Deltacloud. http://deltacloud.apache.org/ 19. Borland. Delphi. http://www.embarcadero.com/products/delphi 20. The Lazarus Team. Lazarus. http://www.lazarus.freepascal.org/ 21. Free Pascal Team. Free Pascal: Free Pascal Compiler. http://www.
freepascal.org/
22. Institute of Hydrology (1999) Flood estimation handbook, vol 3: Statistical procedures for flood frequency estimation. Institute of Hydrology, Wallingford, UK
23. Microsoft. Windows Azure Platform, Microsoft Cloud Services. http://www.microsoft.com/windowsazure/
24. GoGrid. Cloud Hosting. http://www.gogrid.com/
25. RackSpace. Cloud Servers. http://www.rackspace.co.uk/cloud-servers/
doi:10.1186/2192-113X-2-7
Cite this article as:Gleniset al.:Flood modelling for cities using Cloud
com-puting.Journal of Cloud Computing: Advances, Systems and Applications2013 2:7.
Submit your manuscript to a
journal and benefi t from:
7Convenient online submission
7Rigorous peer review
7Immediate publication on acceptance
7Open access: articles freely available online
7High visibility within the fi eld
7Retaining the copyright to your article