ISSN: 2470-850X
Vol. 1, No. 1
Summer, 2016
JSARD
Journal of
School
Administration
Research and
The Journal of School Administration Research and Development
J
SARD
JSARD Editorial Board Members
Editor-in-Chief, James Mullooly, Ph.D., California State University, Fresno
Senior Editor, M. Anne Visser, Ph.D., University of California, Davis
Copy Editor, Joshua Kunnath, Ed.D., Principal Research Center, Inc.
Managing Editor, Brandon Palmer, Ed.D., Principal Research Center, Inc.
The Journal of School Administration Research and Development
J
SARD
Welcome to the Principal Research Center’s first issue of the peer-reviewed Journal of School
Administration Research and Development (JSARD), an open access, online and print publication.
The purpose of the JSARD is to support the mission of the Principal Research Center Inc., which
ad-vocates for the highest quality 21
stcentury education of children through the improvement of
selec-tion and development of school leaders in our naselec-tion’s schools. By publishing high quality research
and commentaries on school leadership topics, we hope to connect educational stakeholders from
universities, governing agencies, school districts, and other educational organizations interested in
improving education for children in the United States. Our first issue includes articles from
re-searchers and practitioners on topics including student assessment, school climate as it relates to
student achievement, student discipline disproportionality, goal setting, bias against men in early
childhood education, and a book review on improving reading in middle and secondary education.
The publication of this journal represents a collaboration between researchers and practitioners
currently working in universities, education organizations, and school districts who are actively
pursuing the improvement of leadership selection and development in education. As we begin
working on the second issue of the JSARD, scheduled to publish in early 2017, we want to thank
you for supporting our journal.
Sincerely,
Brandon Palmer
The Journal of School Administration Research and Development
J
SARD
Table of Contents
Q and A Dialogue: Principal Selection and Development
5
David Shuler, Township High School District 214, IL Leigh Wallace, University of Wisconsin-Milwaukee
The School Climate—Student Achievement Connection: If We Want
9
Achievement Gains, We Need to Begin by Improving the Climate
John Shindler, California State University, Los Angeles Albert Jones, California State University, Los Angeles A. Dee Williams, California State University, Los Angeles Clint Taylor, California State University, Los Angeles Hermenia Cardenas, California State University, Los Angeles
The Relation between easyCBM and Smarter Balanced Reading and
17
Mathematics Assessments
Julie Alonzo, University of Oregon
Disciplinary Consequence Differences in Grade 6 Students as a Function of
36
Race, Ethnicity, and Economic StatusMyriam Quintero Khan, Spring Independent School District, TX John R. Slate, Sam Houston State University
Goal Setting to Increase Student Academic Performance
44
Ronnie Dotson, Carter County Schools, KY
The “Othering” of Men in Early Childhood Education
47
Kevin McGowan, Sam Houston State University
Book Review: Improving Reading Comprehension of Middle and High
50
School Students
School leadership has been a burgeoning topic in
ed-ucation since the turn of the millennium. There is no shortage of research, articles with best practices, and “how to” books on educational leadership. Unfortu-nately, the development and selection of school lead-ers has only recently started to gain the attention of educational stakeholders. Initiatives such as the Wal-lace Foundation’s Principal Pipeline Initiative, which started several years ago, has focused attention on the development of school leaders, while the selection of school leaders is still emerging as a topic of interest.Numerous educational researchers and experts have long argued for collaboration between universi-ties and school districts to improve how educational leaders are developed and selected. The purpose of this Q and A Dialogue is to connect educational stake-holders with both the practitioner and researcher per-spectives on the development and selection of school leadership in order to understand each perspective and develop points of collaboration to improve both.
Dr. David Schuler is the Superintendent of Town-ship High School District 214 near Chicago, Illinois. Township High School District 214 is recognized as a Blue Ribbon High School District by the U.S. Depart-ment of Education. Dr. Schuler also serves as presi-dent of the American Association of School Adminis-trators (AASA) and represents the practitioner per-spective for this Q and A Dialogue.
Dr. Leigh Wallace, Assistant Clinical Professor of Administrative Leadership, also currently serves as the program coordinator for Administrative Leader-ship and Supervision at the University of Wisconsin-Milwaukee. Dr. Wallace’s research interests include the role of the principal and assistant principal; dis-trict level leadership structures; and equity, access, and the achievement gap. Dr. Wallace represents the
researcher perspective for this Q and A Dialogue.
Q1: There is sudden interest among educational stakehold-ers in the preparation and development of school princi-pals. What in your opinion is driving this interest?
DS: I think there are a number of reasons for the inter-est in the preparation and development of school prin-cipals. There has been significant research from Robert Marzano, the Wallace Foundation, and the 2010 re-search study from the University of Minnesota and the University of Toronto, among others, that tightly link school leadership to improved student learning and student achievement. The research supports what most of us in the field have known for years: princi-pals really matter when it comes to teaching and learning. I would say it is awesome to see this new focus on principal development. I also think including school and district leadership as priorities in the Race to the Top applications and state waivers highlighted the importance of the role of the principal.
LW: Given the increased pressure on schools and in-dividual teachers to increase student outcomes, re-duce the achievement gaps among different groups of students, and prepare students for post-secondary options, it only follows that while teachers are being more carefully “evaluated,” the same will be expected of school building principals. Those who are truly invested in successful schools and developing effec-tive leaders see this as an important opportunity and an area that requires our attention and focus. MOST principals (and assistant principals) will tell you that once they become an administrator—usually after their first or second year on the job—there is little or no support offered to them as it relates to their profes-sional growth. We have found that much of what constitutes principal professional development is real-ly little more than obligatory meetings with mentors
with
David Schuler, Ph.D., Superintendent and
who are mismatched in terms of experience and con-text, and the meetings do very little to coach and truly support the new principal. As principals are facing even more stringent evaluations themselves, their par-ticipation in such activities is rarely meaningful or growth oriented.
So, what’s driving the interest? I’d like to believe that it is a sincere belief and understanding that prin-cipal leadership matters and it is time for society to invest in principal and leadership development and support. Given the significant need for qualified prin-cipals—especially in our urban schools—this focus has the potential to develop leadership capacity and ensure that administrators are prepared to manage the day-to-day operations; guide instructional improve-ment; and create a culture of trust, academic opti-mism, and collective efficacy.
Q2: Researchers and scholars have linked the principal with student achievement and school success for decades. Based on your knowledge and expertise, in what ways do you be-lieve principals can improve student achievement and school success within schools?
DS: Principals must become the lead learner of their school. It is really that simple. They must ensure that high quality teaching and learning is occurring in each classroom. The Wallace Foundation has done some really incredible work in this area and their research would suggest, and I would completely agree, that principals need to focus on the following five key re-sponsibilities in their role as the lead learner of their respective school:
Shaping a vision of academic success for all stu-dents based on high standards.
Creating a climate hospitable to education in or-der that safety, a cooperative spirit, and other foundations of fruitful interaction prevail.
Cultivating leadership in others so that teachers and other adults assume their parts in realizing the school vision.
Improving instruction to enable teachers to teach at their best and students to learn to their utmost.
LW: I am first going to give you a very non-academic or professorial response: It really IS a no-brainer that the quality of the building principal is critical to the success of the school. My father, a former school su-perintendent, would always say, “You show me a suc-cessful school, and I’ll show you a strong principal. You show me a school that is struggling, and I’ll show you a principal that just isn’t getting the job done. The principal is EVERYTHING.”
Those of us in the field of education have recog-nized this simple truth from the beginning—as class-room teachers, administrators, scholars, or prepara-tion faculty. I can’t help but go back to the 1982 Effec-tive Schools Research work done by Ron Edmonds and Larry Lezotte. Their work highlighted the im-portance of an effective school leader and how leaders create the culture and climate critical for meaningful teaching and learning to take place—from the focus on instructional leadership, monitoring student pro-gress, maintaining safety, connecting with families, and protecting student time on task . . . I’m sure I left out a few—but, really, this is such a significant body of work and truly worth a second look (or a first one if you haven’t explored it yet).
Recent research also supports the assertion that building-level leadership behaviors can make a differ-ence in student achievement. In fact, Karen Seashore-Louis and her colleagues identified three key school leadership behaviors—specifically those of the princi-pal—that indirectly influence student achievement based on their impact on teachers’ work: 1) instruc-tional leadership, 2) shared leadership, and 3) trust. Also, as a critical component of principal leadership, we have to maintain our focus on equity and justice for all students when it comes to the systems we cre-ate in our schools, the opportunities we offer students, and the subtle, or not so subtle, messages we send to students about who should be—and can be— successful.
Principals need to get out of their offices—spend time in classrooms, in the building, and throughout the community. They have to be visible and know what their teachers need and make it a point to secure those resources for them—whether it is time, profes-sional learning, support, or materials. One of Michael Fullan’s new texts, The Principal, talks about creating “learning leaders” that combine the role of the effec-tive manager, instructional leader, and transforma-tional leader . . . That is another way to envision the work.
Q3: Despite recent interest in the preparation and develop-ment of school principals, principal selection has seldom been investigated by researchers. Subsequently, principal selection methods have not evolved with the importance of the role of the principal. Why do you think the improve-ment of principal selection has not been given the same at-tention as the development and preparation of school princi-pals?
comprehend until fairly recently the critical im-portance of a principal being the building’s instruc-tional leader. As a result, selections may have been made based on other priorities. It is interesting that you ask this question, as the Wallace Foundation has created a Principal Pipeline Initiative in which they talk about school leadership often being overlooked as an education improvement strategy even though the research is very clear in that space. According to their work, the principal is the most important factor in de-termining whether a school can attract and retain high quality teachers. I’m also a huge fan of David Cot-trell’s book Monday Morning Leadership, where he talks about the imperativeness of ‘hiring tough, hiring right’. Too often, many people hire based on conven-ience, comfort, or familiarity. Our students need us to commit to creating a recruitment and selection process that ensures we have the best instructional leader pos-sible in each of our nation’s schools.
LW: Let’s face it: Principal selection is a highly politi-cal endeavor! It’s not about the “methods” we use to select the best possible candidate, but whether or not we are WILLING to select the best candidate! I am always amazed at individuals that look great on paper and interview well but are, as I like to say, “a mile wide and an inch deep.” How can we find truly ex-ceptional candidates for principalships? Especially given the complex, incredibly stressful, high-stakes nature of the job. I remember the NASSP’s “Principal Assessment Center” and believe that similar models can be used as a part of the interview process to deter-mine how a candidate presents themselves over a pe-riod of time and a variety of situations. There is also a need for more deliberate succession planning for prin-cipalships. While vacancies can’t always be anticipat-ed, districts can engage in “shoulder tapping” of their teacher leaders and assistant principals to groom them for the principalship within the district. I would as-sert that many districts lose highly competent leaders because they don’t—or won’t—recognize talent. Also promising leaders may become discouraged when leadership is lacking, but continue to be allowed to either maintain the status quo or eventually “move up the chain.”
I am also a big believer in finding “fit.” We have our students engage in Gallop’s “Strength Finder 2.0” instrument to determine their strengths and reflect on the type of team they want to create and be a part of as a leader in order to excel. I always tell them you can’t always wait for the “perfect” position to come along, but it would be foolhardy to take a position where a good fit doesn’t exist. Finding the right envi-ronment and school culture is one way to ensure
bet-ter outcomes for new and experienced leaders. Change agents will certainly feel stymied in a district where the status quo prevails and there is little or no support for innovation.
Q4: Principal selection researchers and selection personnel have both questioned the reliability of selection methods in predicting the success of school principals. What do you think can be done to improve the reliability of principal se-lection methods?
DS: As mentioned earlier, I think the selection process has to be purposefully and strategically developed to ensure that the process identifies the strongest instruc-tional leader for the building. Communication, gen-eral competency, and building relationships are im-portant, but instructional leadership must be the pri-mary determining factor in selecting a school princi-pal. I recently was part of a webinar hosted by AASA and Learning Forward to discuss the new Model Prin-cipal Supervisor Professional Standards that were re-leased in December 2015 by the Council of Chief State School Officers (CCSSO). Having professional stand-ards for those of us who supervise principals is awe-some. We need to continue to look for ways to show-case and share those standards to ensure that princi-pal supervisors are using them in the principrinci-pal selec-tion process as well as in how to best support princi-pals based on research.
LW: I have to concur with Dr. Schuler. Districts have to be deliberate and strategic about the hiring process. I would also assert that they must have a clear district mission and vision focus in place as well. Again, as my father always said, “If you don’t know where you’re going, any road will take you there” (Actually, I think maybe he borrowed that from the great Lewis Carroll). But, really, it makes sense. If we want princi-pals to be successful, they need to understand what the district expects of them and what the “guiding light” or “compass” is as it relates to the mission and vision.
Q5: In what ways can researchers and practitioners collabo-rate to improve the preparation, selection, and development of school principals?
DS: There must be opportunities for those conducting the research in this space like CCSSO, the Wallace Foundation, AASA, Learning Forward, and others to host avenues for information exchanges and other professional development activities for principal su-pervisors to share the research and recommendations surrounding the preparation, selection, and develop-ment of school principals. I also think there needs to be more writing published in professional journals about this topic. Not every principal supervisor can travel to attend a meeting, but most of us read profes-sional journals, and it would be awesome to see some articles on this topic in our professional journals.
LW: Universities have a great deal to offer districts as it relates to leadership preparation and development, and conversely, university faculty at all levels can learn from practitioners and use these relationships to stay abreast of what is actually happening in the field. Often, the criticism of university programs is the dis-connect between what we know and teach and what the practitioners already know and need to learn. As university faculty, we need to be mindful of “bridging the gap” between theory and practice—principals need to understand the WHY and the HOW, but we have to make it relevant to their work. Creating, nur-turing, and maintaining partnerships with local dis-tricts are promising practices as is developing collabo-rative action research. Working together, I believe universities and districts can create (fundable) part-nerships—we just have to make the time and commit-ment to do that work together. These might be “pipeline” programs or sustained professional devel-opment offerings. The conversation has to occur, but the possibilities are infinite.
Summary
The Q and A Dialogue presented two unique perspec-tives on the development and selection of school lead-ership. According to both Dr. Schuler and Dr. Wal-lace, interest in the development and selection of school leaders is tied to the realization that school leaders affect student outcomes. Numerous research-ers over an extensive period of time have linked the principalship to either school success or improved student achievement. The link between school leader-ship and student achievement has been well estab-lished and will continue to be examined.
What can school leaders do to improve student achievement? Dr. Schuler and Dr. Wallace point to
school climate as a factor in improving both teaching and learning. Additionally they also mentioned building leadership capacity in others and engaging in shared leadership practices as other avenues princi-pals can use to improve student academic achieve-ment in schools.
Despite national research in 1983 by Baltzell and Dentler that demonstrated significant selection issues in the United States, principal selection has seldom garnered the attention or concern of educational stakeholders. Dr. Schuler acknowledged that practice has trailed research, but as the principal’s critical role has been realized, selection procedures should be strengthened to ensure the best educational leaders are at the helm of our nation’s schools. Dr. Wallace stressed that selection of the best candidate is mostly a matter of will—selectors must be willing to select the best candidates for the principalship. She also sug-gested using assessments similar to the NASSP’s Prin-cipal Assessment Center, which was in use decades ago, and she also discussed the use of succession plan-ning as strategies to develop high quality school lead-ers.
Principal selection methods can be strengthened and predictability can be improved when methods focus on educational leadership. Principal selection methods should be “purposely and strategically de-veloped,” and tied to national and state standards, according to Dr. Schuler. Dr. Wallace supported this position and also believed a clear district vision and mission to focus efforts in selecting school principals is necessary.
Collaborations between research and practitioners can occur through multiple avenues. Dr. Wallace sug-gested partnerships between universities and practi-tioners could develop and maintain “pipeline pro-grams.” Dr. Schuler suggested researcher-practitioner collaboration could be improved by sharing research through hosting information exchanges sponsored by educational organizations such as the AASA or other school leadership organizations. He also stressed the need for more published research on the selection and development of school leaders.
▪▪▪
If you are interested in participating in a future Q and A Dialogue article featured in the Journal of School
Ad-ministration Research and Development, please email
[email protected] and include a brief letter of interest with the following information: name, title, organiza-tion, and area of expertise.
The School Climate - Student Achievement
Connection: If We Want Achievement Gains, We
Need to Begin by Improving the Climate
John Shindler
California State University, Los Angeles
Clint Taylor
California State University, Los Angeles
Albert Jones
California State University, Los Angeles
Hermenia Cardenas
California State University, Los Angeles
A. Dee Williams
California State University, Los Angeles
ABSTRACT: This study examined the relationship
between school climate and student achievement rat-ings in urban school districts in five states (N =230). Many educators view school climate and student achievement as separate considerations. However the results of this study suggest that climate and student achievement were highly related. In fact, the quality of the climate appears to be the single most predictive factor in any school’s capacity to promote student achievement. The findings of the study suggest a se-ries of general and theoretical implication for the field of education. It appears that the use of practices that promote a “psychology of success” lead to greater achievement and higher quality climate, and those that promote a “psychology of failure” lead to under-performance.
Key words: student achievement, school climate,
psy-chology of success
relationship would not be news to most school admin-istrators or teachers, considerations of climate are most often viewed as secondary.
Likewise few would endorse neglecting the quality of the climate at one’s school, yet a minority of schools have systematic approaches to promoting or main-taining the quality of their climate. In many cases, the reason for the casual approach to climate is that it is not well understood or is viewed as a discrete consid-eration—unrelated to such things as pedagogical prac-tice, achievement goals, curriculum, and teacher de-velopment. When school climate is defined narrowly, it can appear as a relatively independent factor. How-ever, when viewed contextually, it becomes clear that it is related to everything else. In a study of urban pub-lic schools, Jones, Shindler, Cardenas, and Taylor (2003) found that all of the various aspects of climate were correlated to one another at most schools. Where one variable was found to be either high or low, the others were as well. In other words, no cases were found in which one variable, such as the discipline culture, was low and another, such as student interac-tions, was high.
While more direct methods of intervention with the goal of improving student achievement make sense, if the basic structure of a school is dysfunctional, its ca-pacity to promote its desired goals is limited (Fullan, 2003). Examining student achievement trends from the past few years, data shows what could best be de-scribed as stagnation in the effort to improve test scores and decrease of the unacceptably large size of the achievement gap (National Assessment of Educa-tional Progress, 2008). This may suggest that the com-mon practice of adding isolated or piecemeal reforms has not produced the kinds of results that were hoped for (Norton, 2008). Placing climate at the heart of the reform process may provide the mechanism to situate
M
any educators view school climate and student achievement as separate considerations. For some, the idea of promoting a high quality climate can seem like a luxury in the face of the current high stakes assess-ment environassess-ment in which student achieveassess-ment gains are paramount. However, the results of this study suggest that climate and student achievement are related. In fact, the quality of the climate appears to be the single most predictive factor in any school’s capacity to promote student achievement.problems and solutions more effectively so that they can be better diagnosed, assessed, and mapped.
Purpose
The purpose of this study was to explore the rela-tionship between student academic achievement and various elements within the domain of school climate, and to examine the nature and potential causality of that relationship. The study also sought to derive im-plications for practice, including a possible fundamen-tal conceptual framework for climate quality and function and an operational roadmap for moving from a less functional to more functional climate.
Methodology
The study examined school climate and achieve-ment at 230 urban public schools. The purposive sam-ple of schools was drawn from districts in five states reflecting regional diversity, yet all districts contained schools with a range of achievement levels as well as diverse ethnic and socio-economic communities. Each school assessment team administered the Alliance for the Study of School Climate (ASSC) School Climate Assessment Instrument (SCAI). The team at each school incorporated a standard protocol and surveyed a minimum number of participants (N= 30+ students, 10+ teachers as well as 10+ staff and parents, with most sample sizes being much larger). Academic Per-formance Index (API) and Similar School Rating (SIM) scores (published by the state) were used to measure student achievement in California. Relative achieve-ment test score percentile rankings were used in all other states.
The SCAI was designed to achieve an in-depth ex-amination of the health, function, and performance of each school. While the term “school climate” was judged the best description for the intent of the instru-ment, it examines the construct of climate broadly, and includes eight distinct dimensions:
School appearance and physical plant
Faculty relations
Student interactions
Leadership decision making
Discipline environment
Learning environment
Attitude and culture
School-community relationsItems within the SCAI are structured to reflect three levels: high-, medium-, and low-functioning, and descriptive language is used to explain each level of each item. Participants are asked to rate their expe-rience of their school on each item. Example items from the SCAI can be seen in Figure 1. High, medi-um, and low level items in the SCAI correspond to overall levels of school function and performance. Ta-ble 1 depicts the characteristics of these three levels. At the core of what defines a high functioning school is a high degree of organizational intentionality, col-laborative effort, reflective practice, and a pervasive orientation toward achievement that could be classi-fied as a “psychology of success (POS) (Table 2). Social contexts such as schools tend to promote either more POS or more “psychology of failure” (POF). Every pedagogical and administrative action could be judged to promote either more POS or POF. There-fore, items within the ASSC-SCAI reflected this con-struct theoretically as well as its practical indicators.
Success Psychology as a Conceptual Framework
As we examine the idea of a “psychology of suc-cess” what becomes evident is that several familiar concepts are rooted in this common phenomenon. The concepts of self-esteem, achievement psychology, in-trinsic motivation, needs satisfaction, and success psy-chology are all rooted in the same fundamental com-ponents. They are:
Growth versus fixed ability orientation as related to one’s self-efficacy
A sense of belonging and acceptance versus alien-ation and worthlessness
Internal versus external locus of controlParing the research in this area down, these three es-sential factors emerge to explain the degree to which a student has a psychological orientation toward suc-cess or failure. Moreover, there are a large number of studies to indicate that each of the three factors is cor-related with academic success (Auer, 1992; Benham, 1993; Dweck, 2000; Klein & Keller, 1990). As we exam-ine each factor independently, their efficacy becomes more evident.
Growth vs. Fixed Ability
5. Discipline Environment
Level 3
Level 2
Level 1
High high-middle middle middle-low low
5.c---o--- o --- o --- o --- o --- Most teachers use effective discipline
strategies that are defined by logical consequences and refrain from pun-ishments or shaming.
Most teachers use some form of posi-tive or asserposi-tive discipline but accept the notion that punishment and sham-ing are necessary with some students.
Most teachers accept the notion that the only thing the students in the school understand is punishment and/ or personal challenges.
5.e---o--- o --- o --- o --- o --- Maximum use of student-generated
ideas and input. Occasional use of student-generated ideas. Teachers make the rules and students should follow them. Figure 1. A sample of three items from scale 5 (Discipline Environment) of the ASSC School Climate Assessment Instru-ment (SCAI).
Table 1
Theoretical Construct for Each of the Three Levels of the ASSC School Climate Assessment Instrument (SCAI).
Table 2
Sub-factors for the Theoretical Construct of Achievement Psychology.
Level 3 Level 2 Level 1
System Intentional
Semi-Intentional Accidental
Ethos Sound vision translated into effective practice
Good intentions translated into practices that “work”
Practices defined by the rela-tive self-interest of faculty and staff
Effect on Students Liberating
Experience changes students for the better
Perpetuating
Experience has a mixed effect on students
Domesticating
Experience has a net negative effect on students
Staff relations Collaborative
Collegial Competitive
Psychology of Achievement
Promotes a Psychology of Suc-cess (POS)
Promotes a Mixed Psycholo-gy
Promotes a Psychology of Failure (POF)
Psychology of Success (POS) Psychology of Failure (POF)
Internal locus of control External locus of control
Belonging and acceptance Alienation and worthlessness
as much the result of talent (i.e., fixed ability factors) or current level of ability as it is the result of the orien-tation-cognitive strategy one uses to approach learn-ing tasks (i.e., a growth mindset). Research of others along with personal reflection support the notion that the level of one’s sense of competence (or self-efficacy) will relate to the level of self-esteem. We of course want our students to experience healthy levels of self- esteem. However, the different cognitive strategies that one might choose to use to attain that sense of competence will not accomplish the same result, espe-cially in the long term. Dweck (2000) offers a useful lens for distinguishing two contrasting cognitive strat-egies for feeling competent and how they have dra-matically different results over time. When a student uses a growth orientation, they view a situation as an opportunity to learn and grow. They do not see their performance within a situation as a measure of their innate ability as much as a measure of their invest-ment—better results require more practice. Students who approached tasks with a fixed-ability orientation viewed the context as a reflection of how much ability they innately possessed in that area. The result is a student who is looking for situations that will not challenge their fragile self-image or make them feel “dumb.” Dweck (2000) found that students with a growth pattern were more likely to persist in the face of failure and experience higher levels of academic achievement. The gap in achievement between the growth and fixed students was found to expand as students got older (Dweck, 2000).
Acceptance and Belonging vs. Alienation and Worthlessness
This second factor within the framework for
“success psychology” reflects the degree to which any member feels wanted and part of the group and the degree to which one likes and accepts one’s self. The more one feels accepted and acceptable, the more one will be able to express one’s self, act authentically, and be fully present to others (Osterman, 2000). Self-acceptance is in contrast to self-aggrandizement, or a compulsion to please. A sense of belonging and ac-ceptance is essential to a young person’s mental health and ability to trust and take risks (Shann, 1999; Shin-dler, 2009). It comes in part from accepting messages from influential persons, practicing a positive ap-proach and attitude, experiencing emotional safety, and feeling a part of a community.
Research has shown a relationship between a sense of belonging with acceptance and self-esteem (Osterman, 2000; Shann, 1999). Moreover, building a sense of classroom belonging and the sense of self and
peer-acceptance has been shown to promote higher achievement (Dembrowsky, 1990; Sanders & Rivers, 1996).
Internal vs. External Locus of Control
The third factor in the construct of “success
psy-chology” is defined by one’s sense of internal causali-ty and orientation toward personal responsibilicausali-ty. The more internal locus of control (LOC) we possess, the more we feel that our destiny is in our own hands. It could be contrasted to an external LOC or an orienta-tion that views cause as an external factor and one in which life “happens to us.” An internal LOC can be defined as the belief that one is the author of his or her own fate. An internal LOC comes from having a casu-al understanding of behavior and effect. It is learned from freely making choices and taking responsibility for the consequences of those choices. Through re-sponsible action and accountability for those actions, the young person learns to attribute the cause of suc-cess or failure internally. Consequently, he or she feels a sense of power and responsibility and is able learn from his or her life experience. Another term we could use for internal LOC is “personal empowerment.”
Research has drawn a strong relationship between levels of student self-esteem and sense of an internal LOC (Hagborg, 1996; Klein & Keller, 1990; Sharidan, 1991). Moreover, studies have shown repeatedly that students with higher degrees of internal LOC demon-strate higher levels of achievement (Auer, 1992; Park & Kim, 1998). In fact, having high levels of internal LOC have been shown to be an even more significant predictor of achievement than intelligence or socioeco-nomic status (Hagborg, 1996). In addition, higher in-ternal LOC has also been shown to mediate the stress response (Ayling, 2009). Taken together these three interdependent variables make up a comprehensive explanation for why some students achieve more of their potential and why some contexts promote more students meeting more of their potential. These factors influence students’ growth in all aspects of their lives, yet the effect of what takes place in schools make up a significant amount of their influence.
Results
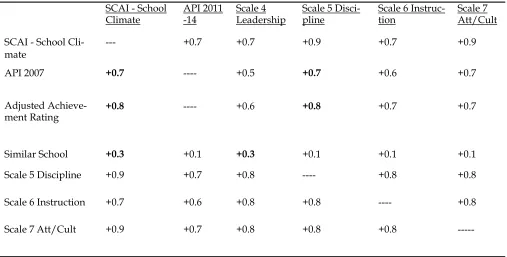
= 5.8). Second, achievement was shown to be highly correlated to overall mean school climate (SCAI) (r = 0.7). Third, achievement was also shown to correlate with all eight SCAI climate and function indicators, including a very substantive correlation coefficient for classroom discipline practices (r = 0.7). Fourth, all eight of the climate factors at each school tended to be highly inter-related. This suggests that factors are highly inter-dependent. Fifth, similarly, when socio-economic status was accounted for, the correlation between the SCAI scores and the achievement scores grew more prominent (r = 0.8). Sixth, intra-school data showed similar variation. The experience of climate for students within each school also varied relative to academic track of the student group. Students in lower performing tracks identified different practices being the norm than their higher track peers and expe-rienced lower quality climates.
In general the high correlation coefficients (see Ta-ble 3) between school climate and achievement sug-gest that they are strongly related. While the direction of the causality between the two variables is not en-tirely indicated by the data, the substantial relation-ship between climate and SIM rating suggest that a conclusion can be drawn that, to a good degree, better climates led to achievement and were not simply a byproduct.
A scatter plot distribution of each school’s SCAI rating (1-low to 9-high) by API scores (200-low to 1000
-high) shows a distinct pattern, as depicted in Figure 2. Higher levels of climate corresponded to higher levels of academic achievement.
When individual school climate ratings are graphed against achievement (i.e., API) scores, the 0.7 correlation can be seen in the scatter plot diagram (see Figure 2). The figure illustrates that as SCAI climate scores increase, so does achievement. In this data set there were no outliers from this trend line. Region A in Figure 2 represents a score combination of low cli-mate and high achievement. Region B represents the inverse: low achievement and high quality climate. Cases in which a school scored in either of these re-gions of this graph were absent from this set of schools and appear unlikely to exist elsewhere.
Study Implications
The results of the study have both theoretical and practical implications. First, they offer a better theo-retical understanding of the nature of student achieve-ment, causes of the achievement gap, and the role that school climate plays. Second, they imply practical considerations for teachers and administrators at-tempting to increase student achievement and reduce the achievement gap at their schools.
Theoretical Implications
The findings of the study suggest a series of general and theoretical implications for the field of education
Table 3
Correlation Table Achievement by Climate Factors
SCAI - School
Climate API 2011-14 Scale 4Leadership Scale 5 Disci-pline Scale 6 Instruc-tion Scale 7Att/Cult SCAI - School
Cli-mate --- +0.7 +0.7 +0.9 +0.7 +0.9 API 2007 +0.7 ---- +0.5 +0.7 +0.6 +0.7 Adjusted
Achieve-ment Rating +0.8 ---- +0.6 +0.8 +0.7 +0.7
---including the following:
It appears higher quality climates lead to higher levels of student achievement.
High student achievement test score means ap-pear virtually impossible within the context of a school with a low quality/functioning climate.
Dimensions of school climate were found to be highly correlated at each site indicating that dimen-sions are strongly interdependent. This implies that change within one discrete dimension will be influ-enced by the effects of the others.
It is questionable to assume that implementing isolated, de-contextualized, add-on programs within a school where the climate is of fundamentally poor quality will achieve the desired effect.
In the absence of a deliberate attempt to improve the quality of the climate and the function of a school, it can be assumed that quality of school climate will continue to get worse on average from grade to grade.
Surface indicators of achievement may not offer enough information to judge progress toward school improvement. Measures of the systemic function level seem to be necessary as well.
It appears that the use of practices that promote a “psychology of success” (POS) lead to greater achieve-ment and higher quality climate, and those that pro-mote a “psychology of failure” (POF) lead to under-performance.
Intentionally using practices that promote climate function and POS and reducing those that promotePOF may likely increase achievement for all groups of students.
Practical Implications
The implications for educational practitioners in-clude the following:
Consider the consequences of acquiescence to the status quo. Consistent with previous research, the re-sults of this study suggest that the default approach to teaching and school organization has in great measure created the conditions for low achievement and the achievement gap. If we do not make fundamental changes to what are doing, why would we assume that we will get substantially different results from what we have to date?
Assess your school’s climate. It appears that start-ing with a clear sense of the health and function level of the school is necessary to accurately diagnose what is and is not working. We need to know where we are before we can know where we want to go.
Identify desirable and undesirable practices. As part of the school self-assessment, it makes sense to evaluate the practices at your school to determine which are promoting either a healthy or unhealthy school climate. Consistent with previous research, the findings of the study suggest that all areas of school performance are inter-dependent. Therefore every neglected or dysfunctional area of school performance is dragging down the larger effort to promote school achievement.
Classify practices as either POS- and POF-promoting. As a collective set of stakeholders, identify which common practices at the school would best becharacterized as POS promoting and which are POF promoting. The appendices available from ASSC and the book Transformative Classroom Management (Shindler, 2009) will be a helpful starting point. How-ever, the more this construct is developed as a person-ally meaningful concept to each member of the school community, the more effectively it will be implement-ed.
Below are list of some practices that can be inferred to create either a psychology of success or psychology of failure. Below are examples of some practices that promote a psychology of success:
Cause-and-effect and clarity
Process focus (especially with assessment)
Student collective identity and sense of belonging
Meaningful work
Student responsibility, choice, and voice
Emotional safety
Below are examples of some practices that promote a psychology of failure:
Comparison and excessive competition
Public shaming
Assessment as a form of “gotcha”
Punishments as consequences
Meaningless work
Emphasis on end products
Colored cards and other gimmicks
Bribes, praise, and other extrinsic rewards
When most educators examine the POS promoting list, few of the items surprise them. Most schools are attempting to promote at least some level of each of these outcomes. The differences between schools in this regard usually relate to the level of commitment and degree of deliberateness with which they attempt to actualize these outcomes at their site. However, when educators examine the POF promoting list, they recognize many of the items to be common practices used at their schools. In fact, often they find that these POF practices are classified within the taxonomy of what is considered “desirable practice.” For example, few teachers are aware that their colored card or names on the board behavior modification systems or their use of personal praise and disappointment are actually promoting a POF, undermining the prospects of each student’s long-term achievement and
promot-ing the expansion of the achievement gap. In most cases, the greatest effect on climate as well as achieve-ment will likely come from the practices that schools cease doing rather than what they add to what they are already doing.
Reflect on limiting personal assumptions. When we, or other members of the school, use phrases such as “this is what these students need,” we need to re-flect on what is being implied. It often implies that we assume that low performing students need to be taught with school level 1/POF-promoting methodol-ogies. The use of these practices can seem necessary, as these students may respond to that form of treat-ment in a way that makes everyone most comfortable. Yet, the results of this study supports earlier research that suggests that teaching any students in a level 1 (i.e., high conformity, lower level thinking, shame-based) context actually promotes lower levels of achievement and an expansion of the achievement gap over time. Unfortunately many well-intentioned teachers are working hard at promoting low achieve-ment and an achieveachieve-ment gap under the assumption that what they are doing is best for the students with whom they work (i.e., they mistakenly assume that region A results are possible). When we use POS-promoting practices, they have the most significant impact on those that lack a POS. When we use POF-promoting practices, we reinforce POF in those that are least resilient and most susceptible to their ill ef-fects. The data from this study suggests that the prac-tices that define the level 3 category in the ASSC/ SCAI will lead to the highest level of achievement and greatest level of POS for all students.
Conclusion
We have all heard someone make the statement that in so many words “teaching is not rocket sci-ence.” Yet, it seems that producing high achievement in traditionally low-achieving schools and solving the achievement gap may be on that order. It may require solutions that require thinking that goes far beyond where common sense has led us up to this point. It may require a broader and deeper perspective on the problem and a rethinking of some basic design think-ing in the system. An understandthink-ing of the role school climate plays in the development of student achieve-ment appears to be a critical piece of that effort.
References
Auer, C. J. (1992). A comparison of the locus of control of first and second
grade students in whole language, basal reader, and eclectic instructional approach classrooms (Doctoral dissertation).
Ayling, G. (2009, in submission) Report of an adolescent transition, a possible intervention for the stress response and diseas-es in adult life. International Journal of Epidemiology. Benham, M. J. (1993). Fostering self–motivated behavior, personal
re-sponsibility, and internal locus of control. Eugene, Oregon.
Office of Educational Research and Improvement (ERIC Document Reproduction No. ED 386 621).
Dembrowsky, C. H. (1990). Developing Self-Esteem and Internal
Moti-vation in At Risk Youth. Practicum Paper (ERIC Document
Reproduction No. ED 332 130).
Dweck, C. (2000) Self-Theories: Their role in motivation, personality and
development. Lillington, NC: Psychologists Press.
Dweck, C. (2006) Mindset: The new psychology of success. Lillington, NC: Psychologists Press.
Freiberg, H.J., Driscoll, A., & Knights, S. (1999). School climate. Bloomington, IN: Phi Delta Kappa.
Fullan, (2003) Leadership for the 21st century: Breaking the bonds of
dependency. Educational Leadership. 55(7), 6-10.
Hagborg, W. J. (1996). Self-concept and middle school students with learning disabilities: A comparison of scholastic compe-tence subgroups. Learning Disability Quarterly. 19,(2), 117-26.
Hoy, W., & Hannum, J. (1997) Middle School Climate: An empiri-cal assessment of organizational health and student achievement. Educational Administration Quarterly, 33(3), 290-311.
Jones, A., Shindler, J., Cadenas, H., Taylor, C. (2003, January)
Trans-cending traditional school assessment: Examining the efficacy of a participant driven school climate assessment and improve-ment system. Presentation at the American Association of
the College Teachers of Education. New Orleans, LA. January 25-27.
Klein, J. D., and Keller, J. M. (1990). Influence of student ability, locus of control, and type of instructional control on per-formance and confidence. Journal of Educational Research,
83(3), 140-46.
Kober, N. (2001) It takes more than testing: Closing the achievement gap. A Report of the Center on Education Policy. Washington D.C. (ERIC Reproduction Service Number ED454358) Loukas, A. & Robinson S. (2004). Examining the moderating role of
perceived school climate in early adolescent adjustment.
Journal of Research on Adolescents, 14(2).
National Assessment of Educational Progress. (2008). Online report. Retrieved from http://nces.ed.gov/nationsreportcard/ lttnde/criteria.asp
Norton, M.S. (2008) Human resources administration for educational
leaders. New York: Sage.
Osterman, K.F. (2000) Students’ need for belonging in the school community. Review of Educational Research, 70(3), 323-367. Park, Y., & Kim, U. (1998) Locus of control, attributional style, and
academic achievement: Comparative analysis of Korean-Chinese, and Chinese students. Asian Journal of Social
Psychology, 1(2), 191-20.
Sanders, W., & Rivers, J. (1996). Cumulative and residual effects of
teachers on future student academic achievement. Knoxville,
TN: University of Tennessee Value-Added Research and Assessment Center.
Shann, M. H. (1999). Academics and a culture of caring: The rela-tionship between school achievement and prosocial and antisocial behaviors in four urban middle schools. School
Effectiveness and School Improvement, 10(4), 390-413.
Sharidan, M. K. (1991). Self-Esteem and competence in children.
International Journal of Early Childhood, 23(1), 28-35.
Shindler, J. (2009) Transformative Classroom Management. John Wiley & Sons. Chappaqua, NY.
Shindler, J., Jones, A., Taylor, C., & Cardenas, H. (2004). Does seeking
to create a better classroom climate lead to student success and/ or improved teaching? Examining the relationship between pedagogical choices and classroom climate in
ur-ban secondary schools. Paper presented at the AERA, San
The Relation Between easyCBM and Smarter
Balanced Reading and Mathematics Assessments
Julie Alonzo
University of Oregon
ABSTRACT: This study investigated the relation
be-tween the easyCBM Benchmark Assessments in both mathematics and reading and the Smarter Balanced assessment, widely adopted across the United States. Data for the study were obtained from a convenience sample of approximately 1,000 students per grade in grades 3-8 provided by two school districts in the Pa-cific Northwest. Results indicate that the easyCBM CCSS math assessments are a strong predictor of the Smarter Balanced total math score, with correlations ranging from .69 to .84 across grades and seasonal benchmarks. Linear regression analyses indicate that the different easyCBM CCSS math measures account for 68% to 77% of the variance in Smarter Balanced total math score. In addition, all of the easyCBM read-ing assessments are significantly related to the Smart-er Balanced English language arts total score, with correlations ranging from .50 to .69 across grades, measure types, and seasonal benchmarks. Linear re-gression analyses indicate that the different easyCBM reading measures account for 50% to 62% of the vari-ance in Smarter Balvari-anced English language arts score.
Key words: assessment, student achievement, Smarter
Balanced, interim assessment
terventions. In the spring, a third benchmark assess-ment is normally given, enabling districts to evaluate the effectiveness of their instructional program and track progress made throughout the year.
Most districts that have adopted RTI often use one of several commercially available interim formative assessment systems. One such system, easyCBM, of-fers both literacy and mathematics assessments with built-in Spanish language supports for students in grades K-8. As of November 8, 2015, the system was used by over 500,000 teachers, representing 4.6 million students in schools and districts spread across every state in the country. They collectively took over 28.2 million measures from grades K-8 in reading and mathematics (Anderson et al., 2014).
The easyCBM assessments are an integral part of many school districts’ RTI processes (Alonzo, Tindal, Ulmer, & Glasgow, 2006). In RTI, districts administer screening assessments, also known as benchmark as-sessments, three times each year, using the data to identify students at risk who might benefit from addi-tional supports and targeted interventions. Although the system includes both benchmarking and progress monitoring assessments, only data from the bench-mark assessments are included in this study. This is because the progress monitoring assessments tend to be administered only to those students identified as at -risk, whereas the benchmark assessments are univer-sally administered to all students enrolled within a district.
The easyCBM assessment system includes two types of mathematics tests: one type which is aligned to the National Council of Teachers of Mathematics Focal Point Standards and another which is aligned to the Common Core State Standards in Mathematics (CCSS Math). The easyCBM CCSS Math benchmark assessments consist of 40 (grades 4-5) to 45 (grades 6-8) selected-response items in which students are pre-sented with a math problem and prompted to select
in-the best answer choice from three possible solutions. These measures are designed to be taken online, although paper-pencil administration options also exist. The assessments are administered to students by their classroom teachers in either school computer labs or in regular classrooms using laptop computers provided by the school. Students earn one point for every item they answer correctly. Partial credit is not awarded; thus, possible scores range from 0-40 in grades 4-5 and 0-45 in grades 6-8. The CCSS Math measures are reported to have strong reliability evi-dence, with Cronbach’s Alpha ranging from .90 to 95 and split-half reliability ranging from .79 to .95 in grades 4 through 8 (Wray, Alonzo, & Tindal, 2014). In addition to the math tests, the easyCBM system provides a variety of reading assessments. The pas-sage reading fluency (PRF) assessment consists of original works of narrative fiction, ranging in length from 250-350 words. Students are asked to read aloud from stories presented on a single-sided sheet of paper while assessors follow along on their own copy. As-sessors mark any word read incorrectly or skipped, while students read aloud for 60 seconds. Self-corrections are not counted as errors. At the end of 60 seconds, assessors mark the last word read and sub-tract the number of errors to compute the final score of correct words read per minute. Prior studies have reported alternate-form reliability ranging from .87 to .96 (Alonzo & Tindal, 2009) and .83 to .98 (Alonzo, Lai, Anderson, Park, & Tindal, 2012) and test-retest reliability ranging from .86 to .96 (Alonzo et al., 2012). The correlations between PRF and the Oregon Assess-ment of Knowledge and Skills (OAKS), the state test used in Oregon prior to adoption of Smarter Balanced (SB), were generally high, ranging from .55 to .69. An-derson, Alonzo, and Tindal (2011) reported correla-tions between the winter PRF measure and the spring state test used in Washington State prior to the adop-tion of SB, the Measures of Student Progress (MSP), ranging from .46 to .64.
The easyCBM vocabulary assessments are selected-response items where students are presented with a sentence with a missing word or phrase, or one in which a word or phrase is bolded and students are asked to select the answer option that best fits the spe-cific prompt from three possible answer choices. Stu-dents earn one point for every correct answer they provide for a total possible score of 0 to 20. These as-sessments are designed for online administration with responses automatically scored by the computer but are also available in a paper-pencil format. Cronbach’s Alpha for the easyCBM vocabulary measures ranges
from .76 to .84, with a median of .81 for all vocabulary measures in both the fall and winter. Split-half relia-bilities ranged from .61 to .75 for the first and second half of the measures, with a median of .66 and .69, re-spectively. The correlation between the two halves ranged from .58 to .72, with a median correlation of .64 (Wray et al., 2014).
The easyCBM Multiple Choice Reading Compre-hension (MCRC) measures consist of original works of narrative fiction ranging of approximately 1,500 words in length, followed by 20 selected-response items in which students select the answer choice they believe is the best option out of the three possible re-sponses. Students earn one point for every correct an-swer they provide for a total possible score of 0 to 20. Correlations between the easyCBM MCRC measures and the OAKS, the State tests used in Oregon before SB adoption, ranged from .55 to .67 in the fall and .44 to .61 in the winter (Sáez et al., 2010). They ranged from .52 to .65 in the fall and from .41 to .71 in the winter between the MCRC and MSP, Washington’s former state-wide assessment (Tindal, Nese, & Alonzo, 2009).
With the adoption of the SB assessments across nu-merous states, it is important to evaluate the relation between the SB assessments and widely-adopted in-terim-formative assessment systems such as easyCBM. This manuscript presents the initial find-ings of one such study.
Methodology
based on the students in the sample whose data in-cluded full-resolution demographic information. Dur-ing data cleanDur-ing, data from students who were ad-ministered the alternate assessment rather than the general education assessment were removed from the dataset prior to further analyses. In all, six students each from grades 4, 6, and 7 and three students from grade 5 were removed from the dataset in this step. Data from all additional students were retained.
Measures
The data set provided for this study included scores from the fall 2014, winter 2015, and spring 2015 easyCBM CCSS math, PRF, vocabulary benchmark assessments. Data were also from the fall 2014 and winter 2015 MCRC benchmark assessments, as well as from the 2015 SB mathematics and ELA total scores.
Data Analysis
For this study, the relations between the easyCBM benchmark assessments and the SB assessments were analyzed using bivariate correlations as well as linear regression. The results for the mathematics assess-ments are presented first, followed by the results for the individual reading assessments (i.e., PRF, then vocabulary, and finally MCRC), and then the reading assessments as a whole. Scatterplots of the bivariate correlations are also presented. To further aid in inter-preting the results, horizontal lines have been added to the scatterplots to depict the cut score for “proficient” on the SB assessment, as well as vertical lines to indicate the scores that correspond with the 50th, 75th, and 90th percentile scores, respectively, on
the easyCBM assessments.
Results
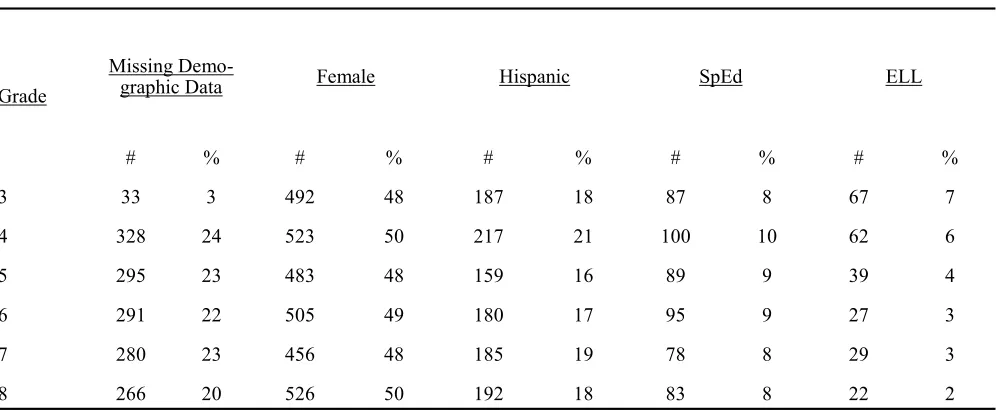
Results for the math assessments are presented first, followed by the literacy assessments. Demo-graphic statistics for the math sample are presented in Table 2 and for the reading sample in Tables 3 through 5 (Tables 2-13 and Figures 1-4 are located in Appendix A and B, respectively).
Relation between easyCBM CCSS Math Bench-marks and SB Total Math
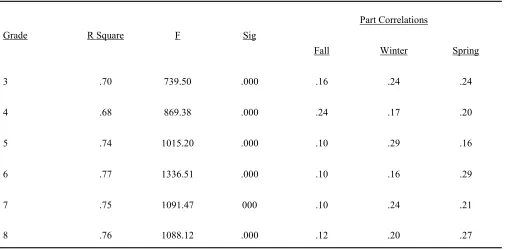
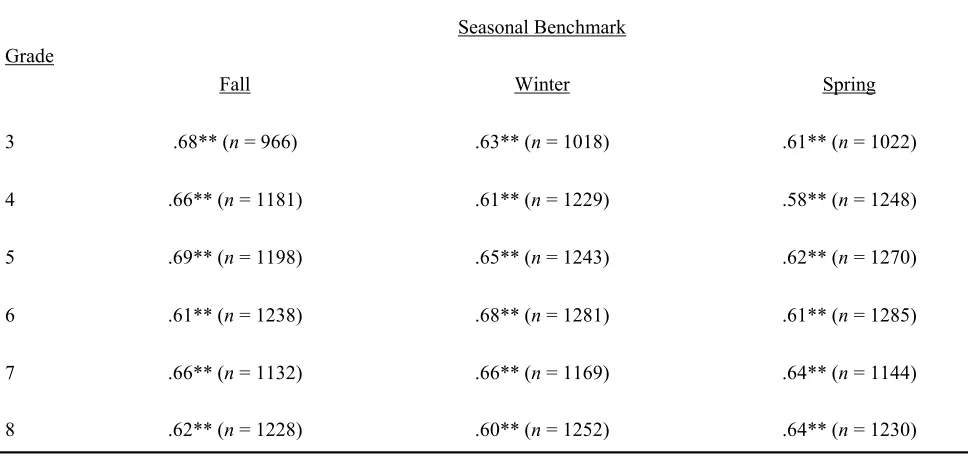
The easyCBM CCSS math benchmark assessments had a moderate-to-strong positive correlation with the SB total math score, ranging from a low of .69 (grade 3, fall) to a high of .84 (grade 6, spring), with the rela-tion getting stronger as grade level increased (See Ta-ble 6). Correlation results were then graphed on a series of scatterplots with a horizontal line to delineate the cut score on SB at which a student is deemed pro-ficient and vertical lines to indicate the scores that cor-respond with the 50th, 75th, and 90th percentile rank, based on the easyCBM national norms published by easyCBM (Saven, Tindal, Irvin, Farley, & Alonzo, 2014). These scatterplots are presented in Figure 1. At all grade levels, the CCSS math seasonal bench-mark assessments were significant predictors of stu-dents’ performance on the SB mathematics assessment (See Table 7). The proportion of variance on the SB mathematics assessment accounted for by students’ performance on the easyCBM CCSS math assessments varied from a low of 68% (grade 4) to a high of 77% (grade 6).
Table 1
Participant Demographics
Grade
Missing
Demo-graphic Data Female Hispanic SpEd ELL
# % # % # % # % # %
3 33 3 492 48 187 18 87 8 67 7
4 328 24 523 50 217 21 100 10 62 6
5 295 23 483 48 159 16 89 9 39 4
6 291 22 505 49 180 17 95 9 27 3
7 280 23 456 48 185 19 78 8 29 3
Relation between easyCBM PRF Benchmarks and SB ELA Total
The easyCBM PRF benchmark assessments had a moderate positive correlation with the SB Total ELA Score (See Table 8). Correlations ranged from a low of .56 (grade 8, fall) to a high of .68 (grade 5, fall). The most consistently high correlations were found in grade 5, where the correlation between PRF and SB ELA total score remained in the high .60’s across all three seasonal benchmarks.
Correlation results were then graphed on a series of scatterplots, with a horizontal line to delineate the cut score on SB at which a student is deemed proficient and vertical lines to indicate the scores that corre-spond with the 50th, 75th, and 90th percentile rank, based on the easyCBM national norms published by easyCBM (Saven et al., 2014). These scatterplots are presented in Figure 2.
Relation between easyCBM Vocabulary Benchmarks and SB ELA Total
The easyCBM vocabulary benchmark assessments had a moderate-to-strong positive correlation with the SB Total ELA Score (see Table 9). Correlations range from a low of .58 (grade 4, spring) to a high of .69 (grade 5, fall). Correlation results were then graphed on a series of scatterplots, with a horizontal line to delineate the cut score on SB at which a student is deemed proficient and vertical lines to indicate the scores that correspond with the 50th, 75th, and 90th percentile rank, based on the easyCBM national norms published by easyCBM (Saven et al., 2014). These scat-terplots are presented in Figure 3.
Relation between easyCBM MCRC Benchmarks and SB ELA Total
The easyCBM MCRC benchmark assessments had a moderate-to-strong positive correlation with the SB total ELA score (See Table 10). Correlations ranged from a low of .50 (grade 6, winter) to a high of .68 (grade 4, fall and grade 5, winter). Correlation results were then graphed on a series of scatterplots, with a horizontal line to delineate the cut score on SB at which a student is deemed proficient and vertical lines to indicate the scores that correspond with the 50th, 75th, and 90th percentile rank, based on the easyCBM national norms published by easyCBM (Saven et al., 2014). These scatterplots are presented in Figure 4.
All of the easyCBM seasonal benchmark reading assessments were significant predictors of students’ performance on the SB English language arts
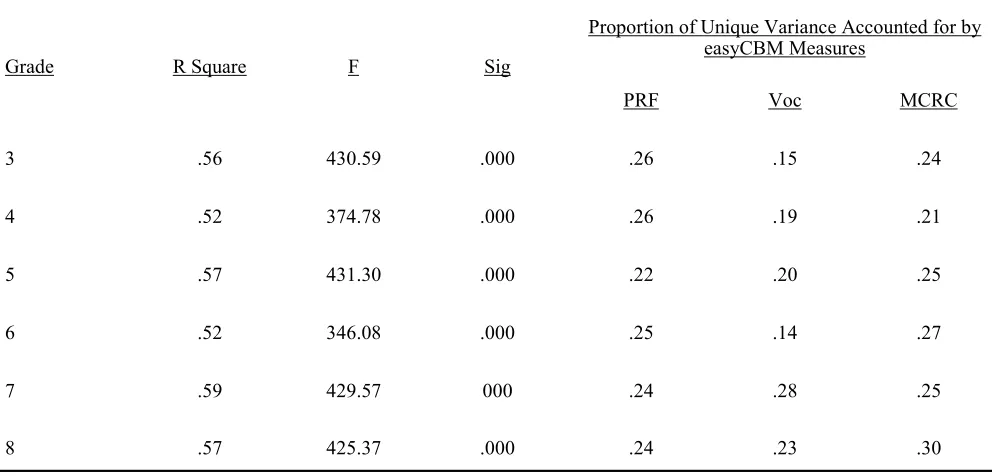
assess-ment across all grade levels and all three seasons. In the fall, the three easyCBM reading assessments ac-counted for between 50% (grade 6) and 62% (grade 5) of the variance on the SB ELA assessment, with the three sub-tests (i.e., PRF, vocabulary, and MCRC) uniquely accounting for roughly equal proportions of that variance (See Table 11). In the winter, the three easyCBM reading assessments accounted for between 53% (grade 8) and 60% (grade 5) of the variance on the SB ELA assessment, with the three sub-tests (i.e., PRF, vocabulary, and MCRC) uniquely accounting for roughly equal proportions of that variance (See Table 12).
In the spring, the three easyCBM reading assess-ments accounted for between 52% (grades 4 and 6) and 59% (grade 7) of the variance on the SB ELA as-sessment, with the three sub-tests (i.e., PRF, vocabu-lary, and MCRC) uniquely accounting for roughly equal proportions of that variance (See Table 13).
Discussion
This study provides promising evidence for dis-tricts interested in knowing the degree to which the easyCBM assessments provide useful guidance in terms of how well students are prepared for meeting the demands of the Smarter Balanced Assessments in mathematics and ELA. However, it is important to point out several limitations with the current study. The largest limitation relates to the sample used in these analyses. Although the initial results are prom-ising, the sample used comes from only two districts located in the Pacific Northwest (in some cases slight-ly fewer than 1,000 students for a particular anaslight-lysis). To the extent that the demographics of the districts supplying the data differ in substantive ways from districts to which the results are being extended, cau-tion is warranted.
Despite this caution related to the sample, this study provides some reason for optimism. The results suggest the relation between the easyCBM CCSS math and reading assessments is actually slightly stronger than that reported in earlier studies examining the relation between the easyCBM assessments and state tests in Oregon (Sáez et al., 2010; Tindal et al., 2009) and Washington (Anderson et al., 2011). Based on these results, districts interested in an interim forma-tive assessment system that can be used to predict performance on the SB assessment should have a de-gree of confidence that the easyCBM assessments are predictive of students’ performance on SB assess-ments.