Improving Indoor Localization Based on Artificial
Neural Network Technology
Chi Han Chen
1and Rung Shiang Cheng
2,*1 Department of Information Technology, Overseas Chinese University, Taiwan 2 Overseas Chinese University, Taiwan
Abstract
Wireless networks are ubiquitous nowadays and hence provide a promising approach for indoor localization. Many algorithms have been proposed for exploiting wireless signals for localization purposes. Among the methods, ANN-based methods have attracted particular attention due to their robustness in complex signal environments. However, their accuracy is still degraded by multi-path effects, signal fluctuations, and so on. Accordingly, this study com-mences by examining the effects of fluctuations in the received signal strength indicator (RSSI) measurement on the accuracy of an ANN-based localization algorithm. This study list some strategies and illustrate by simulation eximent. Based on the investigation results, a systematic methodology is proposed for improving the localization per-formance by increasing the number of APs. The feasibility of the proposed method is demonstrated by means of nu-merical simulations.
Keywords: Internet of things, Sensors, Smart devices, Machine-Type Communications, Prototypes and demonstrators, Embedded systems.
Received on 17 August 2018, accepted on 29 October 2018, published on 31 October 2018
Copyright © 2018 Chi Han Chen et al., licensed to EAI. This is an open access article distributed under the terms of the Creative Commons Attribution licence (http://creativecommons.org/licenses/by/3.0/), which permits unlimited use, distribution and reproduction in any medium so long as the original work is properly cited.
doi: 10.4108/eai.31-10-2018.159633
1. Introduction
Location-based service (LBS) technology has entered the mainstream as the location accuracy of the global positioning system (GPS) has improved to within 10 m. However, GPS signals have only a limited ability to penetrate building exteriors, and hence GPS-based localization methods perform poorly in indoor environments. Nonetheless, indoor localization is important for many applications, ranging from healthcare, to asset management, augmented reality, retail management, sales promotions, and so forth. As a result, enhanced localization services are urgently required.
Wi-Fi, Bluetooth, Infrared/Laser, Radio Frequency Identification (RFID), ZigBee and Ultra-wideband (UWB) have all attracted significant attention as enabling technologies for indoor localization [1]. Among these techniques, Wi-Fi is regarded as a particularly promising solution due to the proliferation of wireless networks in both outdoor and indoor environments nowadays and the Wi-Fi capability implemented as standard on most handheld and portable devices (e.g., smartphones, tablets, watches, and so on). In typical Wi-Fi localization services, the position of the user (mobile device) is determined by applying a mathematical model (typically, triangulation) to the received signal strength indication (RSSI) measurement obtained from multiple access points (APs). However, in more recent years, the feasibility for implementing indoor localization based on fingerprinting technology and artificial neural networks (ANNs) (or some other form of neural network) has attracted growing attention. The training procedure performed in ANNs improves the robustness of the localization performance toward environmental effects compared to simple triangulation-based schemes. It has been shown that ANNs enable a localization error of as little as 2 m in ideal scenarios.[2] As a result, they vastly outperform conventional GPS methods.However, their accuracy is still adversely affected by RSSI signal fluctuations. While several studies have shown that this problem can be mitigated by adopting the channel state information (CSI) to build the fingerprint rather than the RSSI [3], further improvements in the ANN localization accuracy are still required to implement finer LBS solutions.
Accordingly, this research commences by examin-ing the effects of RSSI signal fluctuations on the perfor-mance of an ANN-based localization scheme given the simple case of a single AP and a straight-line transmission path. A systematic methodology is then proposed for improving the localization performance by adding addi-tional APs to the sensing field. The feasibility of the pro-posed approach is demonstrated by means of numerical simulations. Notably, the results provide a useful refer-ence for improving not only the performance of
ANN-based localization methods, but also that of conventional triangulation schemes.
2. Related Work
Many radio propagation models are available for distance prediction in wireless communications. These models are generally based on the signal-strength decay, and comprise the free space propagation model, the two-ray ground model, and the log-distance model [4] The models perform well in outdoor, uncluttered environ-ments, and are thus widely deployed in traditional wire-less sensor networks (WSNs).However, the authors in [2] showed that the RSSI signal fluctuations produced in general indoor environments by scattering and other phys-ical effects severely degrade the accuracy of the distance estimates in WSNs. Unfortunately, it is most common problem in every wireless indoor location system re-search. Various studies have suggested exploiting the channel state information (CSI) rather than the RSSI to construct the fingerprint [5]. Generally speaking, the CSI provides a more robust estimation ability than the RSSI [3]. However, the CSI has the form of a high-dimensional vector, and hence some form of data preprocessing, e.g., data compression, is required before it can be used for estimation purposes. As a result, the complexities of the localization algorithm and associated hardware are inevi-tably increased. Additionally, the extremely environment sensitive of CSI is still a problem. Moreover, the mini-mum average localization error is still around 2.4 m even for simple straight-line observations [5]. Consequently, further improvements in the localization preformation of indoor distance estimation schemes are still required.
3. Preliminaries
In the RSSI-based localization scheme proposed in [6], the robustness of the distance estimates to signal intensity fluctuations was improved by using a base sta-tion (BS) as a reference point to detect the RSSI of three other anchor APs. In particular, the BS received the RSSI values from any of the three anchors and these signals were used to compute a dynamic distance coefficient to support the localization process. The authors in [7] pro-posed an RSSI real-time correction method based on the particle swarm optimization – back propagation neural network (PSO-BPNN) RSSI-distance model presented in [8].In the proposed approach, a terminal was established to collect the RSSIs of the surrounding APs and the RSSI measurements were then adjusted intelligently in real-time using RSSI fluctuation data stored on a local server. However, BPNNs fail to properly converge when present-ed with nonlinear separable input data [9, 10]. Conse-quently, only a limited improvement in the distance esti-mation is obtained.
3.1 RSSI Observations
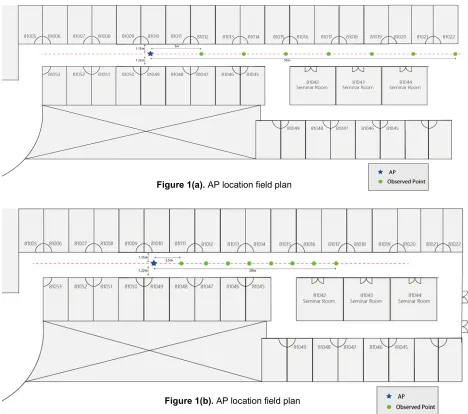
The authors in [2] examined the typical signal fluc-tuations observed in RSSI samples collected in indoor environments. The results showed that small variations in the RSSI signal occurred in samples collected at the same distance from the AP, while large variations occurred in samples collected at different distances. It was hence inferred that the RSSI strength does not decay uniformly with increasing distance. To further investigate this phe-nomenon, the present study commenced by investigating the RSSI decay at eight observation points arranged uni-formly along a straight indoor corridor with a spacing of 5 m between them (see Figure 1(a)). To investigate RSSI decay in shorter distance, we also gathered data at eight observation shown in Figure1(b). For each observation
point, 10 RSSI samples were collected at 1-s intervals over a 10-s period.
Figure 2 shows the average value of the RSSI ob-tained at each of the eight observation points in Figure 1(a). Figure 3 shows the variation of the 10 RSSI meas-urements collected at at each of the eight observation points in Figure 2. In general, the results presented in the two figures show that the RSSI varies almost randomly. For example, the RSSI values collected at the same dis-tance from the AP fluctuate arbitrarily (see Fig. 3), while the RSSI value at a distance of 30 m from the AP is great-er than that at 25 m (see Fig. 2), while that collected at 10 m is slightly higher than that collected at 5 m. In other words, the variation of the RSSI strength with the sensing distance differs markedly from that predicted in the ideal logarithmic decrement model [11][12].
Figure 1(b). AP location field plan
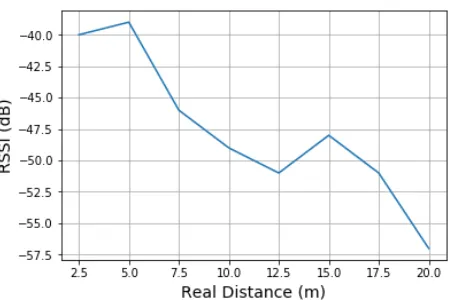
Figure 2. Average RSSI decay over distance of 35 m from AP in Figure 1(a)
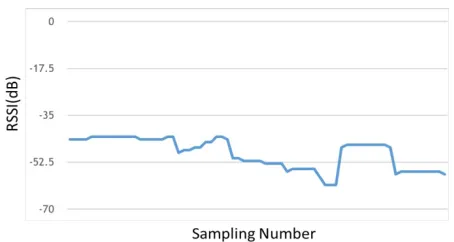
Figure 3. RSSI variation over 10 samples collected at each observation point in Figure 1(a)
3.2 RSSI Signal Fluctuations
Given the uncluttered environment considered in Figure 1, the RSSI variations shown in Figures 2 and 3 can be attributed most likely to the multi-path effect [5]. In practice, the non-linear variation of the RSSI strength with an increasing sensing distance, and the fluctuations of the RSSI measurement at the same collection point, pose significant challenges in implementing RSSI-based localization schemes. For example, referring to Figure 2, an average RSSI value of -46.2 dB may map to a sensing distance of 30 m, but may also conceivably map to a dis-tance of 15 m. Thus, even if a robust ANN scheme is employed for distance estimation purposes, the training model may still fail to converge if the RSSI distribution is not taken into account. Furthermore, for sensing distances of 25 ~ 35 m, the detected RSSI values vary widely (and non-linearly) in the range of -46.2 dB ~ -57.2 dB. Conse-quently, even a well-fitting model may fail to accurately predict the sensing distance from the AP. In general, the results confirm that a single input feature (i.e., a single RSSI measurement) is insufficient to perform straight line distance location estimation in even simple, uncluttered environments.
3.3 RSSI Decay Simulators
To facilitate the present investigations, a sample generator was constructed to simulate the RSSI decay behavior based on the actual RSSI measurements ob-tained in the sensing field. Figure 4 shows five sets of RSSI-distance data collected in the sensor field shown in Figure 1(b) on five different dates, respectively. In gen-eral, the results suggest that two different RSSI simulators are required to properly model the variations of the RSSI strength at different distances from the AP and at the same distance from the AP, respectively. For simplicity, in constructing the first model, the complexity of the environmental effects on the RSSI strength was modeled using a Gaussian random distribution with a mean and variance determined in accordance with the measurements obtained in the real environment. Figures 5~7 show 5, 50 and 100 sets of simulated RSSI data obtained at distances of 5 ~ 35 m from the single APin Fig 1 (a).
Figure 4. Experimental RSSI decay over distance of 20 m from AP in Figure 1(b)
Figure 5. Fivesets of RSSI decay data over distance of 35 mfrom AP in Figure 1(a)
Figure 6. Fifty sets of simulated RSSI decay data over distance of 35 m from AP in Figure 5
Figure 7. 100 sets of simulated RSSI decay data over distance of 35 m from AP in Figure 5
The second RSSI generator was used to simulate the fluctuations in the RSSIstrength at the same distance from the AP. Based on an inspection of the standard deviations of the RSSI signals measured experimentally at each of the observation locations shown in Fig. 1 (b), the RSSI generator was constructed using a Gaussian distribution random output with a variance value of 0.5 dB. Figure 8 shows a typical RSSIdataset produced by the first sample generator. Figure 9 shows the 720 samples (i.e., 8 sampling locations with 90 Gaussian random points per location)produced by the second generator. From a close inspection, the samples generated at distances of 10 m and 15 m, respectively, have similar distributions, while those at 12.5 m and 17.5 m, respectively, also have similar distributions. In other words, despite prior training, the ANN may struggle to differentiate between samples obtained at 10 m and 15 m, respectively, or 12.5 m and 17.5 m, respectively.
Figure 8. Simulated RSSI decay over distance of 20 m from AP
Figure 9. Simulated RSSI samples at each of 8 observation points over distance of 20 m from AP
3.4 Artificial Neural Network
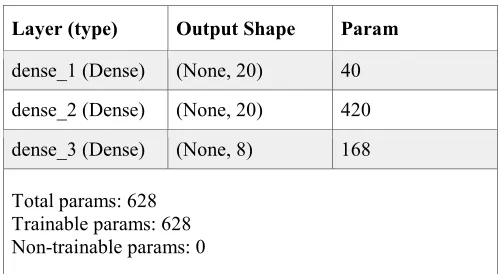
Table 1.Structure of adopted Multi-Layer Neural Network
Layer (type) Output Shape Param
dense_1 (Dense) (None, 20) 40 dense_2 (Dense) (None, 20) 420 dense_3 (Dense) (None, 8) 168
Total params: 628 Trainable params: 628 Non-trainable params: 0
The supervised learning process for the ANN com-prised three steps, namely (1) data preprocessing, (2) training and (3) testing. In the data preprocessing step, the RSSI data produced by the second sample generator de-scribed above was split into a training set and a testing set in the ratio of 80% : 20%. The samples in the testing set were manually labeled with the sensing distance and en-coded into 8 classes accordingly using the one-hot encod-ing method. The trainencod-ing process was conducted for a maximum of 1000 epochs with a termination criterion of an accuracy of 0.75 (75%). It was found that the training process failed to converge to the required accuracy level even after 1000 epochs. Nonetheless, the testing process was performed anyway under the consideration that the testing outcome might yield useful insights into possible improvement strategies. Table 2 shows the confusion matrix for the testing results. It is seen that the test data associated with the fifth class (15 m) are incorrectly pre-dicted as belonging to the third class (10 m), while the testing data associated with the sixth class (17.5 m) are similarly incorrectly predicted as belonging to the fourth class (12.5 m).
Table 2.Confusion matrix for testing data
In general, the training and testing results presented above indicate that the Multi-Layer Neural Network fails to properly converge when using a single RSSI input to predict the sensing distance if the RSSI measurements are subject to fluctuations. Notably, this situation occurs not only in the simple straight-line distance estimation prob-lem considered here, but also in the two-dimensional estimation problem involving three APs. This kind of situation is common in indoor location system that pre-dicting location flipping between several points losing the accuracy.[17]
4.1 Enhanced Precision Strategy
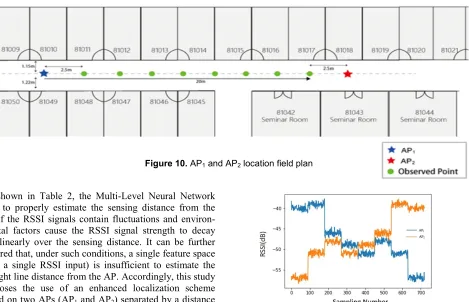
Figure 10. AP1 and AP2 location field plan
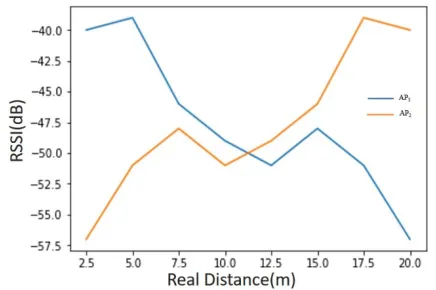
As shown in Table 2, the Multi-Level Neural Network fails to properly estimate the sensing distance from the AP if the RSSI signals contain fluctuations and environ-mental factors cause the RSSI signal strength to decay non-linearly over the sensing distance. It can be further inferred that, under such conditions, a single feature space (i.e., a single RSSI input) is insufficient to estimate the straight line distance from the AP. Accordingly, this study proposes the use of an enhanced localization scheme based on two APs (AP1 and AP2) separated by a distance of 20 m and having the same RSSI distributions. Figure 11 shows the simulated RSSI distributions of the two APs over a sensing distance of 20 m in figure 10 . Note that for simplicity, the two distributions are simply mirror images of one another. Figure 12 shows the detailed RSSI fluctu-ations at each sampling point in the two cases. Finally, Figure 13 plots the RSSI measurements of AP2 (on the Y-axis) against those of AP1 (on the X-axis). The plotted line of each point shows the propinquity of the two RSSI data distributions as the observation point moves between AP1 and AP2. In other words, Figure 13provides an in-sight into the ability of the combined feature space to identify the sensing distance. In this particular case, the absence of any crossing-points in the plotted line implies that the feature space is sufficient to perform accurate sensing distance estimation.
Figure 11. RSSI distributions of AP1 and AP2
Figure 12. RSSI fluctuations at each observation point in Figure 10
Table 3. Confusion matrix for testing results obtained using RSSI data in Figure 12
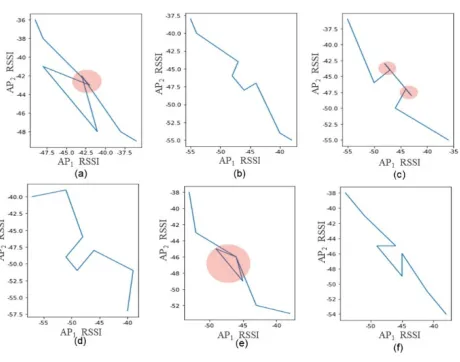
The results presented in Table 3 confirm the effica-cy of adding a second AP to the sensing field to improve the localization accuracy. However, it is still necessary to confirm whether the addition of this AP improves the localization accuracy for all possible distributions of the RSSI-distance profile. Accordingly, the RSSI generators were used to produce 6 random sets of RSSI data for AP1 and AP2, as shown in Figure 14(a)~(f). In each depict, the circled regions show the RSSI discontinuity points which cause confusion when implementing the ANN using a single input feature space. Figure 15(a)~(f) shows the corresponding AP2 vs. AP1RSSI signal plots. The results show that the addition of the second AP resolves the con-fusion problem in three out of the six cases. In other words, while the deployment of an additional AP is bene-ficial in improving the average accuracy of the localiza-tion process, it cannot guarantee a precise localizalocaliza-tion outcome in every case.
Figure 14(a)~(f). Six sets of RSSI data and correspond-ing confusion regions
Figure 15(a)~(f). RSSI distributions of AP2 vs. AP1 for RSSI profiles shown in Figure 14(a)~(f)
Table 4.Confusion matrixfor testing results obtained using RSSI plots in Figure 14(e)
For illustration purposes, consider the RSSI plot shown in Figure 14(e). Inputting the two-dimensional feature training data into the ANN, the localization accu-racy is found to be just 0.88 (88%). Furthermore, the confusion matrix shows that the Class 5 outcome (corre-sponding to a sensing distance of 15 m) and Class 2 out-come (corresponding to a sensing distance of 7.5 m) are confused. This result is reasonable since the RSSI data at 15 m (AP1: -46 dB, AP2 : -46 dB) are identical to those at 7.5 m (AP1 : -46 dB, AP2 : -46 dB ). Since the distance between the two confusion points is just 7.5 m, the 0.12 error rate (i.e., 1.0-0.88=0.12) prevents the ANN from discriminating between them. It is possible that this prob-lem can be overcome simply by adding a third AP. How-ever, this inevitably introduces a cost-accuracy tradeoff. Consequently, an alternative method for improving the localization reliability is required, as described in the following section.
4.2 Ap2 Placement Adjustment
In practice, the distance between AP1 and AP2 is flexible. Hence, the potential exists to solve the confusion problem described above by adjusting the distance be-tween the two APs. Accordingly, the distance bebe-tween AP1 and AP2 was increased from 20 m to 25 m. The cor-responding RSSI distributions are shown in Figures 16 and 17. It is seen in Figure 17 that a continuous RSSI profile with no crossing points is obtained. In other words, the region of confusion is eliminated. The trained model converged to an accuracy of 0.95 (95%) after 200 epochs. The confusion matrix for the test results is shown in Table 5 and confirms the improvement in the estima-tion results. In other words, the results confirm that the localization performance can be improved without any increase in the hardware cost simply by adjusting the distance between the APs.
Figure 16. RSSI distributions of AP1 and AP2 after location adjustment
Figure 17 RSSI distributions of AP2 vs. AP1 after location adjustment
Table 5.Confusion matrixfor testing results obtained using RSSI plots in Figure 16
5. Conclusion
This paper has shown that when using a single AP, the localization performance of RSSI-based methods is seriously degraded due to a non-linear decay of the RSSI signal strength with an increasing sensing distance and fluctuations of the RSSI signal at the same observation point. A similar problem may occurs even when using 3 APs to define a two-dimensional coordinate location. Notably, the deployment of additional APs in an attempt to improve the localization performance also introduces an inevitable tradeoff between the localization perfor-mance and the hardware cost. Accordingly, this study has proposed a low-cost solution for improving the localiza-tion performance in indoor environments using a minimal number (two) of APs.The detailed steps in the proposed approach can be summarized as follows:
1. Collect historicalreal-world RSSI data in the target sensing field and analyze the RSSI dis-tribution (mean, variance and standard devia-tion).
2. Plot the RSSI data of two APs against one an-other in the X-Y coordinate space and identify any possible regions of confusion (as indicat-ed by crossing-points in the AP2 vs AP1RSSI profile).
3. Check if the confusion problem can be re-solved by adjusting the distance between the two APs.
4. As a last resort, deploy an additional AP with-in the senswith-ing field.
References
[1] Indoor positioning system’ , From Wikipedia, the free encyclopedia. Retrieved from
https://en.wikipedia.org/wiki/Indoor_positioning_syst em.
[2] K. Benkic, M. Malajner, P. Planinsic, Z. Cucej. Using RSSI value for distance estimation in Wireless sensor networks based on ZigBee. IEEE 15th Interna-tional Conference on Systems, Signals and Image Processing. 2008: 10.1109/IWSSIP.2008.4604427. [3] Yang-ChunSu. Exploiting Wi-Fi CSI for Fine-Grained Indoor localization. College of Electrical En-gineering and Computer Science, National Taiwan University. 2013:10.6342/NTU.2013.00702
[4] Paolo Santi (2005). Topology Control in Wireless Ad Hoc and Sensor Networks, Hoboken, United States : John Wiley and Sons Ltd . ISBN-13: 978-0470094532.
[5] Zheng Yang, ZiMu Zhou, YunHao Liu. From RSSI to CSI: Indoor Localization via Channel Re-sponse. ACM Computing Surveys (CSUR) Volume 46 Issue 2. 2013: 10.1145/2543581.2543592 [6] Ugur Bekcibasi1, MahmutTenruh. Increasing RSSI Localization Accuracy with Distance Reference Anchor in Wireless SensorNetworks. Acta Poly-technicaHungarica. 2014:
10.12700/APH.11.08.2014.08.6.
[7] Guoquan Li, EnxuGeng, Zhouyang Ye, Yongjun Xu, Jinzhao Lin, Yu Pang. Indoor Positioning Algo-rithm Based on the Improved RSSI Distance Model. Sensors. 2018:10.3390/s18092820.
[8] Ali Yassin, Youssef Nasser, Mariette Awad, Ah-med Al-Dubai,Ran Liu, Chau Yuen, Ronald Raulefs, Elias Aboutanios. Recent Advances in Indoor Locali-zation: A Survey on Theoretical Approaches and Ap-plications. IEEE Communications Surveys & Tutori-als. 2017: 10.1109/COMST.2016.2632427.
[9] Haider, S.S., Zeng, X.J. Simplified Neural Net-works Algorithms for Function Approximation and Regression Boosting on Discrete Input Spaces. Ph.D. Thesis, University of Manchester, Hong Kong, China, 2011.
[10] Lian, T., Xie, M., Xu, J., Chen, L., Gao, H. Mod-ified BP neural network model is used for oddeven discrimination of integer number. Appl. Mech. Mater. 2013: 423–426, 2675–2678.
[11] Qian Dong and WaltenegusDargie. Evaluation of the reliability of RSSI for Indoor Localization [12] Jiayou Luo and Xingqun Zhan. Characterization of Smart Phone Received Signal Strength Indication for WLAN Indoor Positioning Accuracy Improve-ment.
[13] M. Brunato, R. Battiti. Statistical learning theory for location fingerprinting in wireless LANs. Comp. Netw. 2005:ISDN Syst.47(6), vol. 47, pp. 825–845.
[14] R. Battiti, T. Nhat, A. Villani. Location-aware computing: a neural network model for determining location in wireless LANs. University of Trento , Trento, Tech. Rep. 2002.
[15] Shiu Kumar, Seong-Ro Lee. Localization with RSSI values for Wireless Sensor Networks: An Arti-ficial Neural Network Approach. International Elec-tronic Conference on Sensors and Applications. 2014:10.3390/ecsa-1-d007
[16] Simon Haykin. Neural Networks: A Comprehen-sive Foundation. ISBN:0023527617