D.R. Mundhada et al., J. Sci. Res. Phar. 2014, 3(1), 38-44
Journal of Scientific Research in Pharmacy
Research Article
Available online through
ISSN: 2277-9469
www.jsrponl
ine.com
Formulation Development & Evaluation of Mepivacaine Gel using Solid-Lipid Nanoparticles
D.R.Mundhada1*, Shyamala Bhaskaran2
1, 2Department of Pharmaceutics, Agnihotri College of pharmacy, Wardha; Maharashtra, INDIA.
Received on: 22-03-2014; Revised and Accepted on: 03-04-2014
ABSTRACT
I
n order to have a dosage form of mepivacaine for Trans-dermal delivery, a gel preparation was formulated. The microemulsion was incorporated in to a HPMC based gel and solid lipid nanoparticles having mepivacaine was incorporated in to Chitosan based gel. Certain enhancers were used to check the permeability rate in case of HPMC gels. In-vitro release study, stability studies, skin retension study and anesthetic effect study by pinprick method was carried out. HPMC and chitosan were selected in order to have bioadhesive activity, so that release of the drug will be better.Keywords: Trans-dermal delivery, microemulsion, solid lipid nanoparticles, stability studies, skin retension study, bioadhesive activity.
INTRODUCTION
A
microemulsion is considered to be a thermodynamically or kinetically stable liquid dispersion of an oil phase and a water phase, in combination with a surfactant. The dispersed phase typically comprises small particles or droplets, with a size range of 5 nm-200 nm, and has very low oil/water interfacial tension and has very low oil/water interfacial tension. Because the droplet size is less than 25% of the wavelength of visible light, microemulsions are transparent. The microemulsion is formed readily and sometimes spontaneously, generally without high-energy input. In many cases a cosurfactant or co-solvent is used in addition to the surfactant, the oil phase and the water phase. In the present study Mepivacaine is selected as the model drug. Mepivacaine is an effective local anesthetic of rapid onset, intermediate action, and low systemic toxicity [1-4].EXPERIMENTAL DETAIL
Preparation of microemulsion:
The selected percent composition for all the microemulsion systems at a ratio of 3:1. The selection of this ratio was based on being a common system in all the phase diagrams constructed with the different oils used. Also, this ratio was expected to give an O/W microemulsion system due to the relatively low weight ratio of oil to water.
Solid Lipid Nano particles:
A. Preparation of SLNs:
The SLNs were prepared by modified solvent injection method. Briefly, tristearin, phospholipon 80 and drug mepivacaine were dissolved in ethanol in a definite ratio and warmed to 70 ± 2°C. Tween 80 in a definite amount was dissolved in PBS solution (pH 7.4) to prepare aqueous phase. The organic phase, i.e. alcoholic solution containing lipid mixture, was added dropwise with stirring to prewarmed aqueous solution (70 ± 2°C) with the help of a hypodermic needle [5]. The mixture was then sonicated for varying
time periods to obtain nanoparticles with optimum size. Six different formulations were prepared by using different concentrations of tween 80 and sonication time to determine the effect of surfactant and sonication time on the potency of the SLNs. The variable parameters used during formulation development are given in Table No. 2.
*Corresponding author:
D.R.MundhadaAgnihotri College of pharmacy,
Wardha, Maharashtra, INDIA. Mob. No. 09423882961.
*E-Mail: [email protected]
Mepivacaine Gel:
Formulation of topical gel using Chitosan for mepivacaine loaded Solid lipid nanoparticles. One ml of acetic acid 6% was dissolved in 100 ml of water. To this one gram of chitosan was added. This preparation was kept overnight and the viscosity determined. One gram of drug loaded SLN and SLN without drug, 1% glycerine, 2.5% propylene glycol was added and made up to 100g with purified water.
Evaluations: Microemulsions:
A. Thermodynamic stability:
To assess the thermodynamic stability of the prepared microemulsions, two tests were carried out:
1) Centrifuge Stress Test:
Microemulsions were centrifuged at 6,000 rpm for 30 min and then examined for phase separation.
2) Freeze–Thaw Cycle Stress Test:
Microemulsions were subjected to a total of three complete freeze–thaw cycles, each cycle consisting of 24 h at 25°C followed by 24 h at −5°C.
B.Characterization:
A.Visual Appearance and Clarity:The appearance and clarity
were determined visually.
B.pH: The pH of the systems was measured by direct immersion
of the electrode of the pH meter in the system at room temperature.
C.Refractive Index: Refractive indices of the systems were
determined at 25°C using refractometer.
D.Droplet size determination:The average droplet size and zeta
potential of the microemulsions were measured using a Zetasizer Nano-ZS (Malvern Instruments, UK). The measurement was performed at 25°C. It is used to identify the charge of the droplets. Zeta potential determined by Zeta-meter was monitored at 25ºC (Zetasizer Malvern Insrument). Samples were placed in clear disposable zeta cells and results were recorded. Before putting the fresh sample, cuvettes were washed with methanol and rinsed using the sample to be measured before each experiment.
E.Rheological study: Microemulsion systems were studied for
D.R. Mundhada et al., J. Sci. Res. Phar. 2014, 3(1), 38-44
6, 12, 30, 60, 100 rpm. The developed formulation was poured into the small adaptor of the brook field synchroelectric viscometer and the angular velocity increased gradually.
F.Refractive Index Measurements:Refractometry is the method
of measuring substances' refractive index in order to assess their composition or purity. A refractometry measures the extent to which light is bent (i.e. refracted) when it moves from air into a sample and is typically used to determine the index of refraction of a liquid sample, to find out drug loading has no significant effect on the refractive index of the microemulsion system.
G.Determination of conductivity of microemulsion:To find out
microemulsion type and the effect of the amount of water phase of microemulsions was monitored quantitatively by measuring the electrical conductivity. The water phase was added drop by drop into the mixture of oil phase and surfactant phase.
H.In vitro permeation study:The permeation and the diffusion
of mepivacaine from prepared microemulsions were evaluated using Franz diffusion cells (surface 2 cm2 receiver liquid
volume 7 mL) in a 370C thermostatic bath. The receiver liquid
contains phosphate buffer of pH = 7.4.
I.Stability studies: The physical stability was evaluated by
visual inspection for physical changes such as phase separation and drug precipitation. The physical stability study was also done at 4°C, 25°C and 45°C for 45 days at 75 % RH.
J. Skin irritation studies:Three young rabbits of white strain were taken for skin irritation studies. Hair on the back area (approximately 6 cm2 area) of each rabbit was removed by hair
removing cream. Developed formulations were applied to the shaved area, and then rabbits were secured. On one side of the back, a control microemulsion and aqueous solution (without drug) were applied for each day. The animal were observed and evaluated for any sign of erythema or oedema for a period of 7 days.
Table No. 1: Composition of the Prepared Systems
Sr. No. Microemulsions Oil Surfactant Co surfactant
1. M1 Oleic acid Tween 80 n-butanol 2. M2 Benzylalcohol Tween 80 n-butanol 3. M3 Lemon oil Tween 80 n-butanol 4. M4 Isopropyl myristate Tween 80 n-butanol 5. M5 Isopropyl myristate Cremophor EL n-butanol
Table No. 2: Composition of various SLNs formulations
Sr. No Formulations code Mepivacaine Tristearin Phospslipon 80H Tween 80 Sonication time
1 SLN1 300 mg 50mg 50mg 0.5ml 6 min
2 SLN2 300 mg 50mg 50mg 0.5ml 12 min
3 SLN3 300 mg 50mg 50mg 0.5ml 15min
4 SLN4 300 mg 50mg 50mg 1.0ml 6 min
5 SLN5 300 mg 50mg 50mg 1.0ml 12 min
6 SLN6 300 mg 50mg 50mg 1.0ml 15 min
Solid Lipid Nano particles:
A. Characterization of prepared SLN:
1. Fourier Transform infrared (FTIR):
The FTIR spectra of Mepivacaine, tristearin, phospholipon 80 H, Mepivacaine loaded SLNs and physical mixture of lipids and drug in 1:1 ratio were recorded using FTIR spectrophotometer in the range of 4000- 650cm-1.
2. Measurement of particle size, polydispersity index and zeta
potential:
Particle size distribution of mepivacaine loaded SLNs was determined by laser scanning technique using Malvern instrument after appropriate dilution with distilled water. The mean particle size, polydispersity index and zeta potential were calculated for each formulation maintained at 250 C and polydispersity index will
measure the size distribution of nanoparticles population. Zeta potential is one of the important parameters of the colloidal system which measures the surface charge of the particle based on their electrophoretic mobility and indicates the stability of colloidal particles. The surface charge of the mepivacaine-loaded nanoparticles was determined by Zetasizer-NanoZS, ZEN3600, Malvern Instruments Ltd., UK, and He-Ne laser (633 nm). The measurements were carried out using a suspension of the nanoparticles in deionized and distilled water, at 25°.
3. Scanning Electron Microscopy (SEM):
The SEM analysis of prepared SLN was performed for morphological studies. The formulations are poured in to circular aluminum stubs using double adhesive tape, and coated with gold in HUS -5GB vaccum evaporator , and observed in Hitachi S-3000N SEM at an acceleration voltage of 10 Kv and a magnification of 5000X.
SEM is the most commonly used method because of its simplicity in simple handling and ease of operation.
4. Differential Scanning Calorimetry (DSC):
DSC analysis was performed in order to investigate the melting and recrystallization behavior of crystalline materials like
SLNs. The samples were sealed in aluminium pans and measurements were recorded using DSC instrument. The samples were heated from 25 to 2000 C at a heating rate of 100 C /min under
nitrogen atmosphere.
5. Total drug content:
From the prepared SLN formulation 1ml of suspension is dissolved in the 10 ml of 7.4 Phosphte buffer solution and ethanol mixture. The amount of mepivacaine was determined using HPLC. The placebo formulation prepared similarly to drug loaded SLN is used as blank. The total drug content was calculated.
6. Entrapment efficiency (EE):
The prepared SLN dispersion was centrifuged at 15000 rpm for 30min at 00 C using REMI cooling centrifuges. Then the
supernatant is analysed for the free drug content.
EE= {total drug content-free drug content/ total drug content} X 100
7. In vitro diffusion studies:
This is performed by using a modified franz diffusion cell at 370C which is fitted with a dialysis membrane having a molecular
weight cut off 3500 Da. The membrane was soaked in boiling distilled water for 12 hours before mounting in a franz diffusion cell. SLN dispersion 2 ml is placed in to the donor compartment and the 20ml of PBS is used to fill receptor compartment. With one hour interval 1ml of sample is withdrawn and analyse by HPLC method.
Mepivacaine Gel:
A. In vitro Studies:
D.R. Mundhada et al., J. Sci. Res. Phar. 2014, 3(1), 38-44
Fig. 1: In vitro Per\meation study
B. Pinprick Method:[6]
Topical anesthetic efficacy may be evaluated in guinea pigs using the pinprick method. In the case of contact or touch, the skin of these animals twitches reflexly. To investigate the efficacy of a compound, the local anesthetic formulation is applied to the skin under occlusion for a certain period. The treated skin area is then pricked six times at different places with a pointless cannula under constant pressure, while the presence or absence of the twitching response is noted. This procedure can be repeated at regular intervals, allowing both onset and duration of anesthesia to be measured. Prior to this procedure, the hair of the back of the animal has to be removed by first shaving just above the skin before the remaining hair is removed by means of a depilatory.
C. Skin retention studies:
Skin was obtained from the abdomen of mice weighing 21 ± 2 g. The full-thickness skin was excised after hair was removed with a depilatory. Subcutaneous fat and other extraneous tissues were trimmed; the skin washed with physiological saline followed by phosphate-buffered saline (pH 7.4) and then visually inspected for integrity to ensure the absence of holes or other imperfections. The excised mice skins were stored at −21°C and used within 1 week of skin harvest. Prior to testing, the skin was brought to room temperature then fixed in position to top-cut plastic syringe representing a dialyzing tube of 1.9 cm internal diameter. The skin was placed with its stratum corneum facing upward (inside of the tube) and dermal side downward (to face the medium). The position-fixed skin was made water tight by a rubber band. One gram of the gels and the conventional gel was accurately weighed in the plastic tube, which was then attached through its other end to the shaft of the dissolution tester. The whole assembly was adjusted in the same manner as previously mentioned under the in vitro release study. However, in this study, the skin was touching the surface of a medium composed of only 20 ml Sorenson’s phosphate buffer (pH 7.4) containing 1% SLS at 37°C and stirred at 50 rpm. After 24 h, the effective diffusion area of the skin was separated, washed several times with distilled water, to remove formulation excess, and then cut into small piece. The segments obtained were weighed in capped glass vials, vortexed with 3 ml methanol then left soaking for 24 h, to ensure effective extraction of the retained drug from the skin, before being subjected to three sonication cycles, 30 min each, in an ultrasound bath. The resulting mixture was then filtered using 0.45 μm syringe filter and 1 ml from the filtrate was diluted with 1 ml Sorenson’s phosphate buffer (pH 7.4) containing 1% SLS then refiltered and quantified using HPLC.
RESULTS
Microemulsions:
Determination of Saturation Solubility of Mepivacaine in Different Oils:
Table No. 3: Saturation Solubility of Mepivacaine in Various Oils (n= 3)
Oil Solubility (mg/g oil)
Olive oil 18.50 ± 0.94
Soybean oil 6.37 ± 2.67
Sesame oil 14.35 ± 1.53
Light liquid paraffin 0.31 ± 0.22
IPM 10.11 ± 0.16
Oleic acid 187.14 ± 7.45
Lemon oil 63.9 ± 16.45
Benzyl alcohol Freely soluble
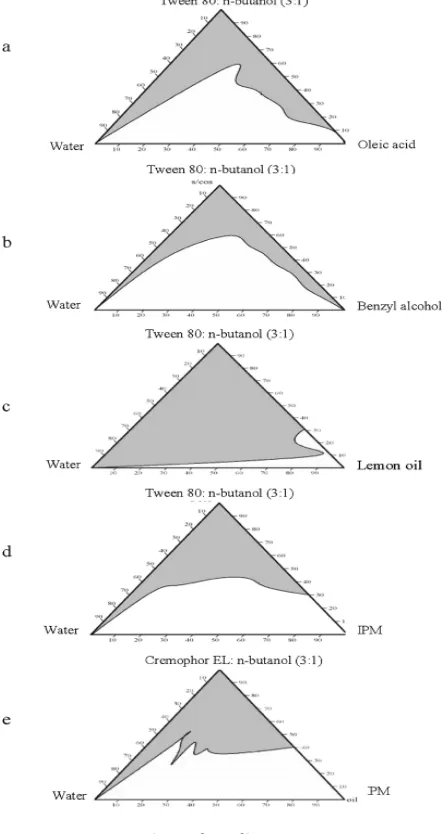
A. Construction of Microemulsion Phase Diagrams:
A phase behaviour investigation to develop microemulsion systems is the suitable approach of determining the water phase, oil phase, surfactant/cosurfactant concentrations. Therefore, pseudoternary phase diagrams of investigated microemulsion systems were constructed to determine compositions of microemulsions. The microemulsion regions in pseudoternary phase diagrams to determine the composition of an oil phase containing oleic acid or isopropyl myristate, an aqueous phase, and a surfactant/cosurfactant (3 : 1) phase containing Tween 80 as surfactant and n butanol as co surfactant (As shown in Fig 2)From the microemulsion regions in the pseudoternary phase diagrams, five formulas were selected for the development of mepivacaine microemulsions (Table 1) It was observed that percentage area of microemulsion region in the majority of phase diagrams was largest at S/CoS weight ratio of 3:1 compared to 1:1 and 2:1 ratios (data not shown). This can be explained on the basis of the enhancement in micelle formation with the increase in S/CoS ratio, which consequently increases the solubilizing capacity of the microemulsion.
Fig. 2: Phase diagrams
B. Thermodynamic Stability of mepivcaine Microemulsions: Visual examination showed that all the mepivacaine microemulsion systems were stable after being subjected to centrifugation or freeze–thaw cycles.
C. Characterization of Mepivacaine Microemulsion Systems:
a. Visual Appearance and Clarity:
D.R. Mundhada et al., J. Sci. Res. Phar. 2014, 3(1), 38-44
Table No. 4: Visual appearance and clarity of various microemulsions
Sr. No. Formulation code Visual Appearance Clarity
1 M1 transparent Clear
2 M2 transparent Clear
3 M3 transparent Clear
4 M4 transparent Clear
5 M5 transparent Clear
b. Measurement of droplet size and zeta potential:
Table No. 5: Droplet size distribution and Zeta potential
Sr. No. Formulation code Average droplet size in mm Zeta potential
1 M1 197.50 ± 18.32 -10.72
2 M2 225.00 ± 28.28 -15.64
3 M3 207.50 ± 23.15 -09.64
4 M4 220.00 ± 66.55 -12.67
5 M5 296.25 ± 77.45 -09.54
c. Drug content:
Table No. 6: Drug content of microemulsions
Sr. No. Formulation code Drug content in percentage
1 M1 95.6
2 M2 97.3
3 M3 98.5
4 M4 94.6
5 M5 95.7
The drug content in each formulation was found to be satisfactory.
d. Determination of pH:
Table No. 7: pH of Various Microemulsion
Sr. No Formulation code pH
1 M1 5.71
2 M2 6.73
3 M3 6.54
4 M4 6.56
5 M5 6.54
e. Rheological studies:
Table No. 8: Viscosity of the formulations at 25ºC
Sr. No. RPM Viscosity in CPS
M1 M2 M3 M4 M5
1 6 42.65 ± 4.46 93.98 ± 10.72 85. ± 5.46 72.45 ± 4.75 124.6 ± 10.72 2 12 42.32 ± 7.46 88.77 ± 9.64 86 ± 8.07 75.32 ± 10.62 103.98 ± 6.42 3 30 60.59 ± 7.27 97.06 ± 6.98 86.9 ± 4.56 69.65 ± 7.43 114.78 ± 8.64 4 60 86.70 ± 7.54 98.60 ± 5.48 89.04 ± 7.64 70.56 ± 3.08 106.56 ± 7.38 5 90 94.80 ± 1.53 99.45 ± 4.02 87.65 ± 7.23 72.34 ± 4.92 120.8 ± 4.36 6 100 104 ± 1.68 102.09 ± 3.76 92.05 ± 4.68 76.34 ± 7.42 123.5 ±7.54
The highest viscosity value of M5 containing Cremophor EL relative to those containing Tween 80 (M1–M4) might be because Cremophor EL is semisolid while Tween 80 is liquid at room temperature. Viscosity measures the flow characteristics of
topical formulation. Changes in viscosity of the product are indicative of changes in stability or effectiveness of the product. All the formulations exhibited Newtonian and psudoplastic flow characteristics.
f. Refractive Index Measurements:
Table No. 9: Refractive Index
Sr. No Formulation code Refractive Index
1 M1 1.45
2 M2 1.46
3 M3 1.48
4 M4 1.46
5 M5 1.48
D.R. Mundhada et al., J. Sci. Res. Phar. 2014, 3(1), 38-44
Conductivity studies:
Table No. 10: Conductivity of microemulsion
Sr. No. Formulation code Conductivity σ (μS/cm) Water content Φ (wt %)
1 M1 71.4 10
2 M2 137.4 20
3 M3 127.5 20
4 M4 176.9 30
5 M5 176.4 30
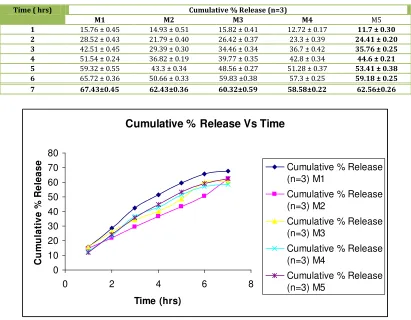
g. In vitro permeation rate:
Table No. 11: Cumulative percentage release rate.
Cumulative % Release Vs Time
0
10
20
30
40
50
60
70
80
0
2
4
6
8
Time (hrs)
C
u
m
u
la
ti
v
e
%
R
e
le
a
s
e
Cumulative % Release
(n=3) M1
Cumulative % Release
(n=3) M2
Cumulative % Release
(n=3) M3
Cumulative % Release
(n=3) M4
Cumulative % Release
(n=3) M5
Fig. 3: Cumulative percentage drug release Vs time
As the droplet size decrease, surface is increased allowing more dissolution and drug release. The formulations M1 shows more drug release as compared to other microemulsion formulations. The lower cumulative percent release observed for M5 than M4 might be due to the larger droplet size and higher viscosity created by Cremophor EL, the surfactant used in M5, compared to Tween 80 in M4 The weaker interaction, indicated by the lower solubility, between the drug and the oil for the former oils might have been the driving force for a faster drug release from their respective microemulsions (M3 and M4) compared with those containing the latter oils (M1 and M2). The lower viscosity of M3 than M4, reflecting the higher fluidity for lemon oil compared to Isopropyl myristate, provided better mobility for the drug molecules, and consequently a faster release with a diffusion-controlled release mechanism.
h. Stability studies:
The pH, drug content and viscosity of the microemulsion shows no any significant change at the end of stability study, and no significant change of phase separation was observed during two months.
Solid Lipid Nano Particles:
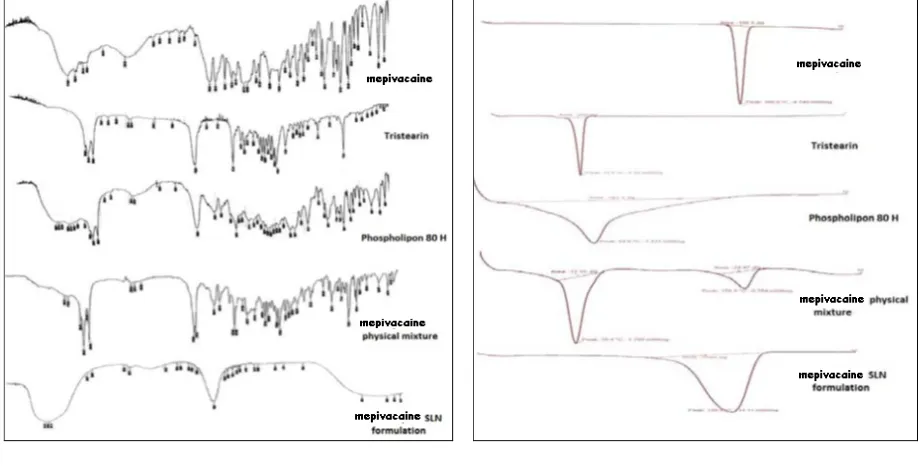
A. FTIR spectroscopy:
FTIR spectroscopy was used to investigate the
interactions between lipid, drug and other excipients. From the FTIR graphs of pure drug, optimized formulation and physical mixture it is confirmed that there are no particular interactions between the lipids and drug.
B. Differential Scanning Calorimetry (DSC):
In the development of SLNs the confirmation of desired physical state of matrix lipid is of crucial importance which can be determined by the DSC. When the DSC thermograms of the bulk lipids and corresponding SLNs are compared the difference in the position and shape of the signals are usually observed. The DSC curve of the pure drug shows that it is in crystalline anhydrous state, exhibiting a sharp exothermic peak at 263°C (∆H-214.9J/ g), corresponding to its melting point 263 ◦C 20), and for the formulation peak is at 228.1°C (∆H-1750j/g), for physical mixture two peaks are observed at 176.9 C 75.98j/g) and 262.6°C (∆H-45.99j/g).
Time ( hrs) Cumulative % Release (n=3)
M1 M2 M3 M4 M5
1 15.76 ± 0.45 14.93 ± 0.51 15.82 ± 0.41 12.72 ± 0.17 11.7 ± 0.30 2 28.52 ± 0.43 21.79 ± 0.40 26.42 ± 0.37 23.3 ± 0.39 24.41 ± 0.20 3 42.51 ± 0.45 29.39 ± 0.30 34.46 ± 0.34 36.7 ± 0.42 35.76 ± 0.25 4 51.54 ± 0.24 36.82 ± 0.19 39.77 ± 0.35 42.8 ± 0.34 44.6 ± 0.21 5 59.32 ± 0.55 43.3 ± 0.34 48.56 ± 0.27 51.28 ± 0.37 53.41 ± 0.38 6 65.72 ± 0.36 50.66 ± 0.33 59.83 ±0.38 57.3 ± 0.25 59.18 ± 0.25
D.R. Mundhada et al., J. Sci. Res. Phar. 2014, 3(1), 38-44
Fig. 4: FTIR Fig. 5: Overlaid DSC thermograms
Table No. 12: DSC data of pure components, physical mixture and SLN formulation
C. SEM:
The SEM photograph of optimised formulation reveals that particles are roughly spherical and somewhat uniformity is
observed. Figure 6 shows the SEM photographs of mepivacaine loaded SLN. The surface of the particle showed a characteristic smoothness, and that the particle size was in the nanometric range.
Figure 6: SEM
D. Particle size determination:
Table No. 13: Average particle size, zeta potential and PDI of mepivacaine loaded SLN formulations
Sr. No. Sample Melting peak
1 Mepivacaine 263
2 Phospholipon 80 H 83
3 Tristearin 77.5
4 Physical mixture 176.9
5 SLN formulation 228.1
Sr. No. Formulation code Average particle size Zeta potential Polidispersity index
1 SLN1 185.7 -2.3 0.348
2 SLN2 185.7 -2.3 0.348
3 SLN3 161.1 -4.28 0.309
4 SLN4 168.7 -5.56 0.250
5 SLN5 168.7 -5.56 0.250
D.R. Mundhada et al., J. Sci. Res. Phar. 2014, 3(1), 38-44
Mepivacaine Gel:
A. HPLC determination of mepivacaine:
Mepivacaine was assayed by HPLC method. The HPLC system consisted of a pump (Knauer, DE/K-120, USA.), ultraviolet detector (Waters 484, USA), C18 column (250 x 4.6 mm, 5 um), degasser, and integrator (D520A, Youngin Scientific Co., Ltd., Korea). The mobile phase was composed of acetnitrile, methanol, and water (70:20:20, v/v/v). A flow rate of 1.0 mL/min yielded an operation pressure of ~1000 psi. The UV detector was operated at a wavelength of 214 nm. Under these conditions, the mepivacaine peak appeared at a retention time of 7.4.
B. In vitro release of mepivacaine from the HPMC gel through
the cellulose membrane:
The in vitro release of mepivacaine from the HPMC gels was determined using phosphate buffer solution (pH 7.4) as a receptor in the modified Keshary-Chien cell. The diameter of the cell was 2 cm, providing an effective constant area of 3.14 cm2 between
the cellulose membrane and the 20-ml bulk solution.
REFERENCES:
1. Tofoli GR, Cereda CM, De Araujo DR, De Paula E, Brito RB Jr, Pedrazzoli J Jr, Meurer E, et al J. Pharmacokinetic and local toxicity studies of liposome-encapsulated and plain mepivacaine solutions in rats. Drug Deliv., 2010; 17(2): 68-76.
2. Payness-Janes JJ, Bray MJ, Kapadia S. Topical non steroidalanti-inflammatory gel for the prevention of perifereal vein thrombophebitis, Anesthesia, 1992; 47: 324-326.
3. Singh.P, Robert.M.S. Skin permeability and local tissue concentrations of non steroidal and anti-iflammatory drugs after topical application, J. Pharm. Exp. Ther., 1994; 262: 144-51.
4. Kumari P., Shankar C. and Mishra B., “The Indian Pharmacist”, 2004; 3(24): 7-16.
5. Safal Jain, Sanjay Jain, Piush Khare, Arvind Gulbake, Divya Bansal, Sanjay K. Jain. “Design and development of solid lipid nanoparticles for topical delivery of an anti-fungal agent”, Drug Delivery, 2010; 1-9.
6. Bülbrin, E. Wajda, I. Biological comparison of local anaesthetics. J. Pharmacol Exp. Ther., 1945; 85: 78-84.