& Reeves, Marina (2013)
Active adults recall their physical activity differently to less active adults: Test-retest reliability and validity of a physical activity survey.
Health Promotion Journal of Australia,24(1), pp. 26-31.
This file was downloaded from: https://eprints.qut.edu.au/77119/
c
Consult author(s) regarding copyright matters
This work is covered by copyright. Unless the document is being made available under a
Creative Commons Licence, you must assume that re-use is limited to personal use and that permission from the copyright owner must be obtained for all other uses. If the docu-ment is available under a Creative Commons License (or other specified license) then refer
to the Licence for details of permitted re-use. It is a condition of access that users recog-nise and abide by the legal requirements associated with these rights. If you believe that this work infringes copyright please provide details by email to [email protected]
Notice:Please note that this document may not be the Version of Record (i.e. published version) of the work. Author manuscript versions (as Sub-mitted for peer review or as Accepted for publication after peer review) can be identified by an absence of publisher branding and/or typeset appear-ance. If there is any doubt, please refer to the published source.
For Review Only
Active adults recall their physical activity differently to less active adults: test-retest
reliability and validity of a physical activity survey
Abstract
Issue Addressed: This paper determined the test-retest reliability and criterion validity of a modified version of the Active Australia Survey (AAS) and whether these properties varied across participants’
activity levels.
Methods: Participants (n=63) responded to repeat administrations of the AAS and wore an accelerometer for seven days. Analyses used Spearman’s Rho (rs,) or weighted kappa (κ) and Bland-Altman methods.
Variation in mean difference and 95% limits of agreement (LOA) across average levels of activity were
tested by linear regression.
Results: Reliability correlations (rs [95% CI]) for minutes/week ranged from 0.40 (0.16, 0.59) to 0.80
(0.68, 0.87). For days/week, the agreement (κ [95% CI]) between administrations ranged from 0.43 (0.34,
0.73) to 0.83 (0.61, 0.93). There was a small mean difference between administrations (-8.46
moderate-vigorous minutes/week); 95% LOA widened as participants’ average activity levels increased. Validity
correlations (rs [95% CI]) for minutes/week ranged from 0.50 (0.28, 0.66) to 0.61 (0.43, 0.75). For
days/week, the agreement (κ [95% CI]) ranged from 0.35 (0.10, 0.50) to 0.61 (0.29, 0.87). Mean
difference between the AAS and accelerometer and 95% LOA both varied with participants’ activity
levels.
Conclusions: The reliability and validity of the modified AAS were better than previously published versions, but varied according to participants’ activity levels.
So what?In this study, participants who engaged in more activity had more measurement error than less active participants. This proportionality will have important implications for cross-sectional and
For Review Only
intervention studies. This phenomenon needs to be examined for other self-reported physical activity
measures.
Keywords: measurement, exercise, accelerometer, questionnaires, surveillance
For Review Only
Introduction
The benefits of regular physical activity are well-known.1 Most developed countries regularly
monitor population physical activity levels and fund initiatives to increase participation.2-4 The quality of
this monitoring relies on accurate methods of measuring physical activity in large populations. Although
the disadvantages of self-report measurement are well known,5 and the use of accelerometry for
population surveillance is becoming increasingly feasible,6-8 self-report measurement still represents an
efficient way to collect data on physical activity in population health research.
The Active Australia Survey (AAS)9 was designed as a telephone-administered instrument for
population surveillance of physical activity in Australian adults,10-12 but has also been used to evaluate
interventions.13-15 The AAS assesses frequency (sessions) and duration (minutes) of past week physical
activity. The test-retest reliability of the AAS has been established in Australian12, 16, 17 and United States
(US) adults,18 and has been validated against accelerometers among: Australian men and women;16, 19
Australian women;12 and, US women.18 The concurrent validity of the AAS has been assessed against the
Australian National Health Survey (NHS), International Physical Activity Questionnaire (IPAQ) and the
US Behavioral Risk Factors Surveillance System (BRFSS).20 These evaluations revealed that the AAS
has modest reliability and validity, similar to other physical activity surveillance tools (e.g. IPAQ).
Aside from modest reliability and validity results, other limitations of the body of evidence
regarding the validity and reliability of the AAS include the untested assumption of whether or not
measurement properties are constant across activity levels, and the mismatch in the definition of
frequency between the tool and physical activity guidelines (which refer to days/week, not sessions). The
only existing study to assess variation across average values found that the concurrent validity of the AAS
(against NHS, IPAQ and BRFSS) worsened with increasing levels of activity.20 There is need for
consistency in definitions of physical activity frequency between guidelines and assessment tools.
Mismatch between the definitions of physical activity frequency in guidelines and tools, over-reporting
and limitations of accelerometry may all contribute to the recent findings that population rates of
For Review Only
guideline compliance are dramatically higher in the US7 and England8 when assessed by self-report than
by accelerometry.
Accordingly, we modified the AAS to assess the “number of days” activity was undertaken instead
of “sessions of activity”. This study aimed to determine the test-retest reliability and criterion validity of
the adapted version the AAS. In view of previous findings,20 we also examined whether reliability and/or
validity varied according to participants’ levels of physical activity. Test-retest reliability was established
through repeat administrations of the AAS. Criterion validity was established by comparing AAS data to
data from an accelerometer. While the accelerometer does not provide a gold-standard measure, it
provides a useful criterion as it has good reliability and validity21 and, importantly, it is not subject to the
same sources of error as self-report.
Methods
The study was advertised within an Australian university via email to staff and students. The email
outlined the eligibility criteria (30-70 years, able to read English, no experience in administering the AAS).
Interested participants, were emailed an information sheet, and then telephoned to confirm eligibility and
gain verbal informed consent. This study was approved by The University of Queensland Human Research
Ethics committee, Brisbane (#2009001169).
Participants were each posted an Actigraph GT1M accelerometer, a daily log (to record
accelerometer removals, water, cycling and strength activities) and a reply-paid envelope (Day 1). Two
days later, participants were telephoned to prompt them to wear their accelerometer and to complete a
demographic survey (Day 3). The AAS was administered via telephone and participants were prompted to
mail back their accelerometer and daily log after seven days of accelerometer data collection (Day 10).
The second administration of the AAS occurred 3-5 days after the first (Day 13-15), with both AAS
administrations assessing the previous seven days of activity.
For Review Only
Trained staff administered the AAS using a standard script (Supplementary File 1). The adapted
version of the AAS required participants to recall the number of days/week and minutes/week that they
engaged in: walking (in at least 10-minute bouts); vigorous gardening; vigorous activity; and, other
moderate activity over the past week. The days reported in each category in the adapted AAS are not
mutually exclusive and therefore the sum of days/week across categories may equal more than seven. As
per the AAS protocol,9 the minutes/week data were truncated at 840 minutes (necessary for an item in
three participants at Time 1 and two participants at Time 2). Total moderate-vigorous activity was
calculated for minutes/week and days/week data based on the sum of walking, moderate and vigorous
activities (vigorous activity was not weighted in order to compare it to accelerometer-recorded
minutes/week).
The accelerometers were set to collect data in one minute epochs. Participants were asked to wear
the accelerometer around their waist for seven consecutive days, and to only remove it when sleeping or
in contact with water. Participants also recorded the timing and duration of activities that the
accelerometer may not correctly detect (i.e., water-based activities, cycling and strength training).
Accelerometer data were downloaded using the Actigraph software and processed using an adapted SAS
program from the National Cancer Institute.22 Data included all monitored time except bouts of an hour or
longer of zero counts, with allowance for up to two counts that were <50 counts/minute. As per common
practice, days were considered valid if there were at least 10 hours of wear. Participants were included in
the analysis if they had at least five valid wear days. As five days of monitoring is sufficient to reflect
habitual activity, 21 weekly values were taken as 7 times the average value for valid days for participants
with less than seven days of valid accelerometer data (n=13). Additionally, to be included in the analysis
participants needed to have recorded no water, cycling or strength activities in their wear log. This was
done to exclude participants who could have reported activity in the AAS that was not detectable by the
accelerometer. The data were analysed using established cut-points for moderate (≥1952 cpm) and
vigorous (≥5725 cpm) activity.23 Minutes/week were based on the number of one minute epochs
For Review Only
accumulated in ten minute bouts within a given intensity range (allowing for a maximum of two epochs
outside of the cut-point range). Days/week data identified the number of days that had at least one ten
minute bout of activity within the specified intensity range (allowing for a maximum of two epochs
outside of the cut-point range).
Analyses were conducted in SPSS version 17.0 (SPSS, Inc. Chicago IL) and STATA version 11
(StataCorp LP, College Station, TX, USA) with significance set at p<0.05. AAS and accelerometer data
were skewed, thus medians (25-75th percentiles) were used to describe the distributions of the data and
tests assuming normal distributions (i.e., intra-class correlations) were not used. Test-retest reliability was
assessed for all AAS categories separately (walking, moderate and vigorous), and for the
moderate-vigorous activity total, for minutes/week and days/week data. Criterion validity was assessed for
moderate (moderate + walking), vigorous, and total moderate-vigorous categories, for minutes/week and
days/week data. For the continuous minutes/week data, Spearman’s correlation coefficients (rs) with 95%
confidence intervals (based on Fisher’s transformation) were calculated to examine the relationship
between the two AAS administrations (test-retest reliability) and between the AAS data (at Time 1) and
accelerometer data (criterion validity). Difference was calculated for minutes/week data between AAS
administrations (Time 2 – Time 1) and between AAS and accelerometer data (AAS Time 1-
accelerometer), and both difference variables were normally distributed. Bland-Altman plots were created
to assess agreement between AAS Time 1 and 2 and between AAS Time 1 and accelerometer data for
minutes/week data.24 Linear regression was used to assess whether the mean difference and/or variability
in difference varied across average values for each plot.25 If average values were associated with mean
difference and/or variability in mean difference, data were log-transformed. If this did not resolve the
problem, then the mean difference and 95% limits of agreement were reported based on the linear
regression analyses.25 For the categorical days/week data, kappa statistics (κ) with exponential weighting
for disagreement (95% confidence intervals), were calculated to assess absolute agreement between
repeat AAS administrations and between AAS Time 1 and accelerometer data.
For Review Only
Participants were classified as meeting the physical activity guidelines based on AAS data if they
reported five or more days/week and a total of at least 150 minutes/week of moderate-vigorous activity.
Guideline compliance based on accelerometer data was classified as at least 150 minutes of
moderate-vigorous activity (accumulated in at least 10-minute bouts) and five or more days of monitoring with at
least one ten minute bout of moderate-vigorous activity. Weighted kappa statistics (95% confidence
intervals) were calculated to assess agreement between classification of guideline compliance between the
AAS and accelerometer data.
Results
One hundred and sixteen participants provided verbal consent, and 103 completed the study
protocol. All 103 participants had five or more valid days of accelerometer data and 63 of those did not
record water, strength or cycling activities in their log. The participants included in the analysis (n=63)
had a mean (± standard deviation) age of 49.5 years (± 12.5), a mean body mass index (BMI) of 26.1 (±
5.6) kg/m2, and the majority (60.3%) had university level education (Table 1). There were no significant
differences between participants who were (n=63) and were not (n=40) included in the study sample for
any demographic characteristic or physical activity (data not shown).
Insert Table 1 here
The median amount of moderate-vigorous minutes/week reported in the AAS was the same at Time
1 and 2 (180 minutes/week; Table 2). The correlation between minutes/week data reported at Time 1 and
2 was lowest for moderate activity (rs = 0.40); and highest for total moderate-vigorous activity (rs = 0.80;
Table 2). The absolute agreement between days/week reported at Time 1 and 2 was weakest for moderate
activity (κ =0.43); and strongest for vigorous activity (κ =0.83; Table 2). The Bland-Altman plot for
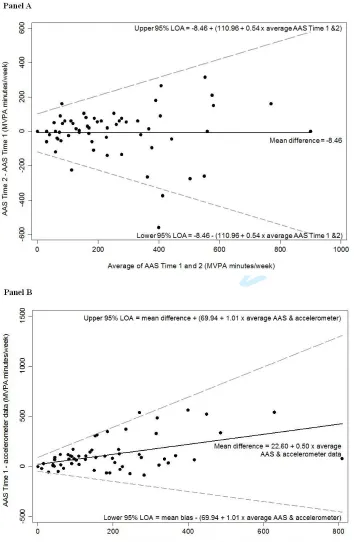
agreement between AAS Time 1 and 2 for total moderate-vigorous minutes/week is shown in Figure 1
For Review Only
(Panel A). The mean difference between AAS administrations was constant across average levels of
activity (-8.46 minutes/week). The variability in mean difference between AAS administrations was
significantly associated with the average amount of activity (β=0.22, SE 0.06, p<0.001, intercept=45.17).
Log-transformation did not resolve the heteroscedasticity; thus, the limits of agreement were estimated as
(-8.46 +/- (110.96 + 0.54 x average of AAS administrations)).
Insert Table 2 here
Insert Figure 1 here
The median amount of moderate-vigorous accelerometer-recorded activity was 75 minutes/week
(Table 2). The correlations (rs) between the AAS and accelerometer data ranged from 0.50 (moderate) to
0.61 (moderate-vigorous total) for minutes/week (Table 2). The absolute agreement (κ) between AAS and
accelerometer days/week data ranged from 0.35 (moderate) to 0.61 (vigorous; Table 2). The
Bland-Altman plot of agreement between AAS and accelerometer moderate-vigorous minutes/week is shown in
Figure 1 (Panel B). Linear regression showed a significant positive association between the mean
difference in AAS and accelerometer data and the average of these two measures (β=0.50, SE 0.11,
p<0.001; intercept=22.60). Thus, the mean difference was estimated based on the regression equation
(22.60 + 0.50 x average of AAS and accelerometer data). The variance also increased significantly with
the average of the two measures (β=0.41, SE 0.06, p<0.001; intercept=28.47). Log-transformation did not
resolve the problems, thus, the limits of agreement were estimated as the mean difference +/- (69.94 +
1.01 x average of AAS and accelerometer data).
Based on data from the AAS at Time 1, 30 (48%) participants met the physical activity guidelines,
whereas data from the accelerometers suggest that only 17 (27%) participants met the guidelines. Sixteen
participants (25%) were classified as meeting the guidelines by both the AAS and accelerometer data, 32
(51%) were consistently classified as not meeting the guidelines, 14 (22%) met the guidelines based on
AAS but not accelerometer data, and 1 (2%) participant met the guidelines according to accelerometer data
For Review Only
but not AAS data. The agreement between guideline compliance categories based on the AAS and
accelerometer data was good (κ=0.51, 95% CI 0.32, 0.71).
Discussion
The version of the AAS used in this study had better test-retest reliability and criterion validity than
previous versions12, 16-19 and compared to other brief self-report instruments (e.g. IPAQ, BRFSS).26, 27 This
study also showed that the AAS had poorer test-retest reliability and more error compared to an
accelerometer as the amount of physical activity increased. This suggests that studies using the AAS may
have more random measurement error and more bias relative to an accelerometer in more active
participants than in less active participants.
The test-retest reliability for moderate-vigorous minutes/week in our adapted AAS was stronger
than what has been shown previously for other versions, in which the intraclass correlations for test-retest
reliability ranged from 0.32 (95% CI 0.09, 0.52) for moderate-vigorous minutes/day,18 to 0.64 (95% CI
0.57, 0.70) for moderate-vigorous minutes/week.17 The absolute agreement for test-retest reliability of
days/week data in this study was also stronger than previous studies that examined the relative agreement
between repeat AAS administrations for sessions/week data (rs=0.58).12 For both minutes/week and
days/week, our version of the AAS showed stronger validity compared to an accelerometer than in
previous studies, which have shown correlations ranging from 0.29 (95% CI 0.16, 0.41) for
moderate-vigorous minutes/day,19 to 0.52 (95% CI not reported) for moderate-vigorous minutes/week,12 and 0.48
(95% CI not reported) for sessions/week.12
A number of issues may contribute to the observed differences in reliability and validity results
between studies, including the: version of the AAS (our version, the original version or other
modifications, such as inclusion of specific domains for transport and leisure walking19 and sitting
questions18); study populations; statistics reported; and, mode of administration
For Review Only
administration19 or self-completion12, 18). The reliability results might also be affected by the time period
between repeat administrations, which for previous studies was 14 days,12 7 days,18 and 1 day.17 The
validity results may also be affected by varying protocols for treating accelerometer data and the weight
status of the samples, as weight has previously been shown to impact on AAS validity estimates.16
Most previous studies have treated reliability and validity as constant across participants’ activity
levels, but our examination revealed this assumption to be incorrect. Our results showed that the
performance of the AAS was proportional to the amount of physical activity that occurs, which is
consistent with previous findings that the concurrent validity of the AAS with other self-reported tools
worsens with increasing activity levels.20 There are a number of plausible reasons why reliability and
validity might vary across physical activity levels. Reporting of behaviour may be better when there is
less activity to recall; further, variation in actual behaviour (not just recalling the behaviour) may be
greater among more active, compared with less active, participants. In terms of validity, the
accelerometer is not a gold-standard criterion, and its performance as a criterion might depend on
people’s physical activity level. The approach of using a threshold (even one with adequate sensitivity
and specificity) means that each minute identified as moderate-vigorous physical activity is identified
with some error, and consequently, the total amount of error increases proportionally as the underlying
amount of activity increases. Further, higher levels of physical activity may be indicative of a wider range
of types of physical activities performed, and the accelerometer is known to capture some types of
activities better than others.21 Finally, the different variability of accelerometer and self-report measures
may have led to artefactual bias.28
There are a number of limitations in this study. Previous research has shown that completing a log
may improve subsequent recall of vigorous activity19 and/or walking activity12 in the AAS. Thus,
participants may have experienced a learning effect when completing the AAS at Time 2, which may
have potentially biased reliability estimates, but would not have affected the validity estimates. Our AAS
modifications did not include a question about days on which either moderate or vigorous activity
For Review Only
occurred, which means a total moderate-vigorous days/week cannot be calculated by summing moderate
and vigorous days (similar to IPAQ). Future AAS versions should consider this to obtain congruence with
Australian physical activity guidelines. Finally, generalisability of the findings may be limited as this
study, like most validity studies, used a small convenience sample recruited through a university setting.
A strength of this study was that our treatment of the accelerometer data ensured that it was as
useful as possible as a criterion measure for AAS-reported moderate-vigorous activity. We excluded
participants who reported doing activity that may not be detected by the accelerometer and processed the
data to only recognise bouts of at least 10-minutes, in order to replicate how participants were instructed
to recall their activity (in the case of the walking category), and likely how they are able to remember
their activity (in the case of the other categories). The seven day recall period of the AAS completely
overlapped with the accelerometer wear period. Previous validations of the AAS have used overlapping
assessment periods, however only one previous study processed accelerometer data based on 10-minute
bouts,12 and none excluded participants who reported activities not detected by the accelerometer.
Conclusion
This study has found an adapted version of the AAS, had better test-retest reliability and criterion
validity compared with previous versions of the AAS, but that these properties varied with participants’
activity levels. Future reliability and validity studies should not assume performance to be constant across
activity levels, but rather test whether this is the case.24, 28 A greater amount of measurement error at
higher levels of activity may affect epidemiological studies of physical activity and health outcomes
because there may be more attenuation due to misclassification in more active, compared with less active
populations. Intervention studies may also be affected by a widening in measurement error and bias as
participants’ activity levels increase. The impact of these issues is not clear and needs to be empirically
examined, by including both objective and self-report measures in future epidemiological and
For Review Only
References
1. Haskell WL, Lee IM, Pate RR, Powell KE, Blair SN, Franklin BA, et al. Physical activity and
public health: Updated recommendation for adults from the American College of Sports Medicine and the
American Heart Association. Medicine and Science in Sports and Exercise 2007;39(8):1423-34.
2. Australian Institute of Health and Welfare. Australia’s health 2010. Australia’s health series no.
12. Cat. No. Aus 122. Canberra: AIHW 2010.
3. US DoHaHS. 2008 physical activity guidelines for Americans. Washington, DC: US Government
Printing Office; 2008. p. 76.
4. World Health Organisation. Global strategy on diet, physical activity and health: Report by the
secretariat. Geneva: WHO; 2004.
5. Sallis JF, Saelens BE. Assessment of physical activity by self-report: Status, limitations and
future directions. Research Quarterly for Exercise and Sport 2000;71(2):1-14.
6. Hagstromer M, Troiano RP, Sjostrom M, Berrigan D. Levels and patterns of objectively assessed
physical activity- a comparison between Sweden and the United States. American Journal of
Epidemiology 2010;171(10):1055-64.
7. Troiano RP, Berrigan D, Dodd KW, Masse LC, Tilert T, McDowell M. Physical activity in the
United States measured by accelerometer. Medicine and Science in Sports and Exercise
2008;40(1):181-8.
8. Craig R, Mindell J, Hirani V. Health survey for England 2008: Physical activity and fitness.
London: The NHS Information Centre for health and social care; 2009. p. 395.
For Review Only
9. Australian Institute of Health and Welfare. The Active Australia survey: A guide and manual for
implementation, analysis and reporting. Canberra: AIHW; 2003.
10. Bauman A, Ford I, Armstrong T. Trends in population levels of reported physical activity in
Australia 1997, 1999 and 2000. Canberra: Australian Sports Commission; 2001.
11. Queensland Health and Australian Institute of Health and Welfare. Physical activity patterns of
Queensland adults. Brisbane: AGPS; 2003.
12. Brown WJ, Burton NW, Marshall AL, Miller YD. Reliability and validity of a modified
self-administered version of the Active Australia physical activity survey in a sample of mid-age women.
Australia and New Zealand Journal of Public Health 2008;32(6):535-41.
13. Reeves MM, Marshall AL, Owen N, Winkler EA, Eakin EG. Measuring physical activity change
in broad-reach intervention trials. Journal of Physical Activity and Health 2010;7(2):194-202.
14. Eakin E, Reeves M, Lawler S, Graves N, Oldenburg B, Del Mar C, et al. Telephone counseling
for physical activity and diet in primary care patients. American Journal of Preventive Medicine
2009;36(2):142-9.
15. Hawkes AL, Atherton J, Taylor CB, Scuffham P, Eadie K, Miller NH, et al. Randomised
controlled trial of a secondary prevention program for myocardial infarction patients ('Proactive Heart'):
Study protocol. BMC Cardiovascular Disorders 2009;9:16.
16. Timperio A, Salmon J, Crawford D. Validity and reliability of a physical activity recall
instrument among overweight and non-overweight men and women. Journal of Science and Medicine in
Sport 2003;6(4):477-91.
For Review Only
17. Brown W, Trost S, Bauman A, Mummery K, Owen N. Test-retest reliability of four physical
activity measures used in population surveys. Journal of Science and Medicine in Sport
2004;7(2):205-15.
18. Pettee Gabriel K, McClain JJ, Lee CD, Swan PD, Alvar BA, Mitros MR, et al. Evaluation of
physical activity measures used in middle-aged women. Medicine and Science in Sports and Exercise
2009;41(7):1403-12.
19. Timperio A, Salmon J, Rosenberg M, Bull F. Do logbooks influence recall of physical activity in
validation studies? Medicine and Science in Sports and Exercise 2004;36(7):1181-6.
20. Brown W, Bauman A, Chey T, Trost S, Mummery K. Comparison of surveys used to measure
physical activity. Australia and New Zealand Journal of Public Health 2004;28(2):128-34.
21. Trost SG, Mciver KL, Pate RR. Conducting accelerometer-based activity assessments in
field-based research. Medicine and Science in Sports and Exercise 2005;37(11):s531-43.
22. US DoHaHS. Nhanes 2003-2004 data documentation exam component: Physical activity monitor
(paxraw_c). Hyattsville, MD: Centres for Disease Control and Prevention; 2006 [cited 2009 October];
Available from: <http://www.cdc.gov/nchs/data/nhanes/nhanes_03_04/paxraw_c.pdf>.
23. Freedson P, Melanson E, Sirard J. Calibration of the computer science and applications, inc.
accelerometer. Medicine and Science in Sports and Exercise 1998;30(5):777-81.
24. Bland JM, Altman DG. Measuring agreement in method comparison studies. Statistical Methods
in Medical Research 1999;8(2):135-60.
25. Brown R, Richmond S. An update on the analysis of agreement for orthodontic indices. European
Journal of Orthodontics 2005;27(3):286-91.
For Review Only
26. Yore MM, Ham SA, Ainsworth B, Kruger J, Reis J, Kohl HW, et al. Reliability and validity of
the instrument used in BRFSS to assess physical activity. Medicine and Science in Sport and Exercise
2007;39(8):1267-74.
27. Craig CL, Marshall AL, Sjostrom M, Bauman A, Booth M, Ainsworth BE, et al. International
physical activity questionnaire: 12-country reliability and validity. Medicine and Science in Sports and
Exercise 2003;35(8):1381-95.
28. Bland JM, Altman DG. Applying the right statistics: Analyses of measurement studies.
Ultrasound in Obstetrics & Gynecology 2003;22(1):85-93.
For Review Only
Tables
Table 1:Demographic characteristics of convenience sample used to evaluate test-retest reliability and criterion
validity of the adapted Active Australia Survey (AAS) (n=63)
mean ± SD
Age, yrs 49.5 ± 12.5
Height, cm 169.6 ± 9.3
Weight, kg 75.9 ± 19.0
Body mass index, kg/m2 26.1 ± 5.6
n (%)
Gender, male 23 (36.5)
Ethnicity, Caucasian 63 (100.0)
Marital status, married or living together 50 (79.4)
Highest level of education, university or college 38 (60.3)
Employment, full-time paid work 45 (71.4)
Weekly household income, AUD <$1000/wk 11 (17.5)
For Review Only
17
Table 2: Test-retest reliability and criterion validity against accelerometer data of the adapted Active Australia Survey (AAS) in a convenience sample of
Australian adults (n=63)
Test-retest Reliability Outcomes Criterion Validity Outcomes
Time 1 AAS
median (25-75th %ile)
Time 2 AAS
median (25-75th %ile)
rs(95%CI)
AAS Time 1
median (25-75th %ile)
Accelerometer
median (25-75th %ile)
rs (95%CI)
Minutes per week
walking 135 (45-225) 120 (60-240) 0.76 (0.63, 0.85) - - -
moderate 0 (0-0) 0 (0-0) 0.40 (0.16, 0.59) 140 (50-280) † 56 (10-118) † 0.50 (0.28, 0.66)
vigorous 0 (0-40) 0 (0-60) 0.64 (0.47, 0.77) 0 (0-40) 0 (0-0) 0.60 (0.41, 0.74)
moderate-vigorous total 180 (90-330) 180 (95-350) 0.80 (0.68,0.87) 180 (90-330) 75 (21-209) 0.61 (0.43, 0.75)
Time 1 AAS
median (25-75th %ile)
Time 2 AAS
median (25-75th %ile)
κ(95%CI)
AAS Time 1
median (25-75th %ile)
Accelerometer
median (25-75th %ile)
κ (95%CI)
Days per week
walking 4 (2-6) 4 (2-6) 0.64 (0.45, 0.81) - - -
moderate 0 (0-0) 0 (0-0) 0.43 (0.34, 0.73) 4 (3-7) † 2 (1-4) † 0.35 (0.10, 0.50)
http://mc.manuscriptcentral.com/hpja
For Review Only
18
vigorous 0 (0-1) 0 (0-1) 0.83 (0.61, 0.93) 0 (0-1) 0 (0-0) 0.61 (0.29, 0.87)
moderate-vigorous total 5 (3-7) 6 (3-7) 0.63 (0.36, 0.76) 5 (3-7) 3 (1-5) 0.45 (0.34, 0.66)
†
moderate total for criterion validity includes both walking and moderate items from AAS at Time 1
http://mc.manuscriptcentral.com/hpja
For Review Only
Figure 1:Bland-Altman plots of agreement between moderate-vigorous minutes/week (MVPA) reported in the adapted Active Australia Survey (AAS) at Time 1 and 2 (Panel A) and between Time 1
and accelerometer data (Panel B) (n=63)
For Review Only
Supplementary File 1: Adapted Active Australia Survey Interview Script
I would like to ask you some brief questions about the activity you did IN THE LAST WEEK.
1.a In the last week, how many dayshave you walked continuously, for at least 10 minutes, for
recreation, exercise or to get to or from places? (Only count the days you walked for at least 10 minutes without stopping.)
_____ DAYS [If answer is 0, then skip to 2.a]
1.b What do you estimate was the total time that you spent walking in this way in the last week?
MINUTES
2.a In the last week, how many days did you do any vigorous gardening or heavy work around
the yard which made you breathe harder or puff and pant? (e.g. things like heavy digging, pushing a lawn mower)
_____ DAYS [If answer is 0, then skip to 3.a]
2.b What do you estimate was the total time that you spent doing vigorous gardening or heavy work
around the yard in the last week?
MINUTES
The next questions EXCLUDE household chores, gardening or yard work:
3.a In the last week, how many days did you do any vigorous physical activity which made you
breathe harder or puff and pant? (e.g. jogging, cycling, aerobics, competitive tennis).
_____ DAYS [If answer is 0, then skip to 4.a]
[Interviewer clarification: The types of activities which might be reported here, in addition to the above examples, include team games such as football, hockey, basketball, netball, squash, cross-country skiing, cross-country hiking (i.e. rough or steep terrain), weight lifting, boxing, rock climbing, gymnastics, using a rowing machine, certain martial arts, high-impact and step aerobics. It is important to remember that the activity must make the participant breathe much harder and have a large effect on heart rate AND make them unable to talk while doing the activity.]
3.b What do you estimate was the total time that you spent doing this vigorous physical activity in
the last week?
MINUTES
For Review Only
4.a In the last week, how many days did you do any other more moderate physical activities that
you have not already mentioned? (e.g. swimming, social tennis, golf, etc) (Not walking; covered earlier)
_____ DAYS [If answer is 0, then skip to 5.a]
[Interviewer clarification: The types of activities which might be expected, in addition to the above examples, include dancing, badminton, table tennis, horseback riding, canoeing, kayaking, volleyball, cricket, baseball or softball, downhill skiing, cross-training, surfing and windsurfing. The activity must make the participant breathe harder and increase the heart rate but still allow them to talk, but not sing, while doing the activity]
4.b What do you estimate was the total time that you spent doing these activities in the last week?
MINUTES