University of New Hampshire
University of New Hampshire Scholars' Repository
New Hampshire Agricultural Experiment Station
Research Institutes, Centers and Programs
8-21-2015
An index to characterize the spatial distribution of
land use within watersheds and implications for
river network nutrient removal and export
Madeleine M. Mineau
University of New Hampshire, Durham
, [email protected]
Wilfred M. Wollheim
University of New Hampshire, Durham
, [email protected]
Robert J. Stewart
University of New Hampshire, Durham
, [email protected]
Follow this and additional works at:
https://scholars.unh.edu/nhaes
This Article is brought to you for free and open access by the Research Institutes, Centers and Programs at University of New Hampshire Scholars' Repository. It has been accepted for inclusion in New Hampshire Agricultural Experiment Station by an authorized administrator of University of New Hampshire Scholars' Repository. For more information, please [email protected].
Recommended Citation
An index to characterize the spatial distribution of land use
within watersheds and implications for river network
nutrient removal and export
Madeleine M. Mineau1, Wilfred M. Wollheim1,2, and Robert J. Stewart1
1
Earth Systems Research Center, University of New Hampshire, Durham, New Hampshire, USA,2Department of Natural Resources and the Environment, University of New Hampshire, Durham, New Hampshire, USA
Abstract
The spatial distribution of land use and associated nutrient inputs may influence the efficacy of in-stream nutrient removal; however, the effect of source location on N removal and watershed N export has not been quantified. We present the skewness index, a metric to quantify the spatial distribution of land use within watersheds. Using this index and a river network nitrogen removal model, we quantified the effect of varying the location of developed land use within two watersheds on nutrient removal and export. The quantity and location of developed land use as well as runoff affected nitrogen removal and export. Because river network nitrogen removal is bypassed when sources are skewed toward the watershed mouth, varying the location of land use alone can double aquatic nitrogen removal. Nutrient sources skewed toward the distant headwaters maximized in-stream removal which in turn can reduce watershed export.1. Introduction
Human activity has accelerated the nitrogen (N) cycle and enriched the landscape with reactive N [Galloway et al., 2008]. As a consequence, most coastal rivers and bays in the U.S. are degraded by nutrient pollution [Howarth et al., 2002], resulting in eutrophication [Cloern, 2001] which has negative ecological effects, such as algal blooms, anoxic zones, and loss of habitat, as well as associated economic impacts like declining prop-erty value and tourism [Pretty et al., 2003;Dodds et al., 2009]. The effect of human land use on water quality, nutrient enrichment, and export from watersheds is well established [Beaulac and Reckhow, 1982;Carpenter et al., 1998;Foley et al., 2005]. Of particular concern are nonpoint nutrient sources associated with human land uses such as urban/suburban and agricultural areas that are a major source of nutrients contributing to eutro-phication [Carpenter et al., 1998].
Studies considering the effects of land use on watershed nutrient export typically consider the aggregate measure of total area in a watershed and pay little attention to the spatial distribution of this land use [.e.g. Cronan et al., 1999,Goodridge and Melack, 2012]. Percent watershed impervious cover is also commonly used as an indicator of environmental degradation from urbanization [Arnold and Gibbons, 1996]. However, the spatial distribution of landscape patches and the spatial scale at which land use is considered can be important [Strayer et al., 2003;King et al., 2005]. Some studies have shown that land use in the riparian corridor [Sponseller et al., 2001;Strayer et al., 2003;Van Sickle and Johnson, 2008] or subcatchment [Allan et al., 1997] can better predict in-stream conditions.King et al. [2005] found that the Euclidean distance of land use to a sampling point improved predictions of nitrate concentration in some streams. Though some have found that land use at the whole watershed scale may best predict nitrateflux [Strayer et al., 2003], the distribution of land use patches within the watershed and watershed size may affect nutrient export due to cumulative in-stream processes.
Nfluxes to coastal zones are a function of N inputs to the watershed, terrestrial retention, and N removal in transit through the river network. In-stream processing in river networks can remove substantial proportion of Nflux controlling the magnitude and timing of N export [Bernhardt et al., 2005,Mulholland et al., 2008, Wollheim et al., 2008a,Lin et al., 2015]. Model simulations suggest that water residence time affects nutrient removal [Wollheim et al., 2006]; therefore, landscape position of nutrient sources and their associatedflow path distance may affect the potential for nutrient processing before reaching the ocean [Seitzinger et al., 2002;Alexander et al., 2002]. However, it is challenging to summarize complex spatial information regarding the distribution of nutrient sources within watersheds. Perhaps, because of this, the potential effect of source location on N removal and watershed N export has not been quantified.
Geophysical Research Letters
RESEARCH LETTER
10.1002/2015GL064965
Key Points:
•The spatial distribution of land use affects watershed nitrogen export
•Skewness index quantifies spatial distribution within watersheds
Supporting Information: •Figure S1
Correspondence to:
M. M. Mineau, [email protected]
Citation:
Mineau, M. M., W. M. Wollheim, and R. J. Stewart (2015), An index to characterize the spatial distribution of land use within watersheds and implications for river network nutrient removal and export,Geophys. Res. Lett.,
42, 6688–6695, doi:10.1002/ 2015GL064965.
Received 19 JUN 2015 Accepted 28 JUL 2015
Accepted article online 4 AUG 2015 Published online 21 AUG 2015
©2015. The Authors.
Our goal for this study is to evaluate the sensitivity of N processing and export in river networks to watershed land use distribution. Wefirst propose a metric to summarize the distribution of land use within watersheds in a river network context that may help to better understand N removal potential. We then evaluate the export and aquatic processing of N for two coastal watersheds in New England under current and scenarios of land use distribution patterns. We hypothesized that the location of land use within watersheds would control the opportunity for in-stream N removal, as denitrification, by regulating the time N inputs spent in the river network and therefore have a large effect on N removal and, to a lesser extent, N export.
2. Methods
We quantified land use distribution within watersheds in terms of skewness toward or away from the river mouth. Because there was no established metric, we developed an index to summarize the spatial distribu-tion of land uses within watersheds considering the surface waterflow path distance from potential sources to the watershed mouth. This skewness index (SI) is
SIlu¼
lu weighted mean flow path distance
unweighted mean flow path distance (1)
The unweighted meanflow path distance is the average distance traveled by water through the hydrologic network. We calculated land use weighted meanflow path distance for grid cellito grid cellnas
Xn i¼llu * FD
Xn i¼llu
(2)
whereluis the proportion of each grid cell in the watershed occupied by a given land use type and FD is the
flow path distance from that grid cell along the river network to the watershed mouth. To calculate SI values, we used land use data from the 2006 National Land Cover Database (NLCD) [Fry et al., 2011]. A SI value of 1 represents no skewness in the distribution of land use within the watershed while SI<1 represents skewness of land use and associated N sources toward the river mouth, and SI>1 represents skewness toward the most distant headwaters.
We modeled export and in-stream processing of dissolved inorganic N (DIN) using the N removal model within the Framework for Aquatic Modeling in the Earth System (FrAMES) [Wollheim et al., 2008a,Wollheim et al., 2008b,Stewart et al., 2011]. FrAMES is a spatially distributed, grid-based model of river network hydrol-ogy and biogeochemical processes that operates on a daily time step. Modeled N removal, as denitrification, is based on measured denitrification rates from the Lotic Intersite Nitrogen eXperiments 2 [Mulholland et al., 2008] and varies with water temperature and ambient DIN concentrations in each grid cell (equations (3)–(5)) [Wollheim et al., 2008b].
Denitrification uptake velocity (m d1) at the reference temperature of 20°C (Vfden-Ref) was calculated for every grid cell
VfdenRef¼ 10ðden_intþlog10 DINconcð Þ*den_slopeÞ* 864 (3)
where denit_int and denit_slope are2.975 and0.493, respectively [Mulholland et al., 2008], DINconcis the
concentration of DIN in microgram per liter, and 864 is a conversion factor. Denitrification uptake velocity in the grid cell is then calculated as
Vfden¼ VfdenRef*Q10ððwaterT–20Þ=10Þ (4)
where waterTis the water temperature (°C) in the grid cell andQ10 = 2. Total DIN removal (mass/mass) in each grid cell is calculated as
R¼1:0eð1:0*Vfden=HLÞ (5)
where HL = discharge/(width * length). Simulated discharge (m3s1), width (m), and length and water temperature (m) for each grid cell are provided by FrAMES and are described inStewart et al. [2013].
We used the DIN loading function developed for the Ipswich watershed [Wollheim et al., 2008b] in both water-sheds. This loading function uses grid cell percent human land use, defined as the sum of residential, industrial, and agricultural, to predict runoff DIN concentration as a function of runoff quantity [Wollheim et al., 2008b].
Therefore, we aggregated the developed (residential and industrial) and agricultural (crop and hay/pasture) land use categories from the NLCD data to quantify human land use for each grid cell. Though lumping agricul-ture with urban/suburban land uses would not be appropriate in areas where agriculagricul-ture is intensive, it is an acceptable simplification where agricultural land represents a relatively small contribution to nutrient loading compared to developed land use and agriculture primarily represents low-intensity uses such as pastures and hayfields. In addition, in the Lamprey watershed, we added a waste water treatment facility to DIN loading. The waste water facility is a point source input to the grid cell where it is located. We assumed that daily DIN input from this facility to the river is the annual DIN mass/365 (Annual data:Piscataqua Region Estuaries Partnership[2012]).
We calculatedflow path distances and the skewness index using RiverGIS (version 2.1), a river network based geographic information system developed at University of New Hampshire which allows forflow path ana-lysis of hydrological data sets [Vorosmarty et al., 1998]. We used a stream topological network of gridded river channels with a spatial resolution of 15 s latitude by 15 s longitude (approximately 500 m) for the Ipswich and Lamprey river networks. To calculate the skewness index in large Northeast U.S. watersheds, we used a river network with spatial resolution of 3 min latitude by 3 min longitude (approximately 4.75 km) [Stewart et al., 2013]. Both networks were derived from Hydrological data and maps based on SHuttle Elevation Derivatives at multiple Scales (http://hydrosheds.cr.usgs.gov) using the regridding algorithm described in Fekete et al. [2001] and verified against the National Hydrography Dataset (nhd.usgs.gov).
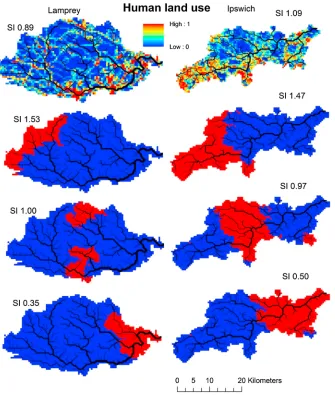
We assessed the potential effect of land use distribution on watershed export and river network removal of dissolved inorganic N (DIN) by varying the location of land use within two watersheds to generate a range of SI. We used two watersheds of similar size with differing amounts of developed land use (Figure 1). The Lamprey River watershed is located in southeast New Hampshire draining to the Great Bay estuary with 9% and 5% of the area developed and agricultural, respectively (Table 1). The Ipswich River watershed located in northeast Massachusetts has much more developed land use due to its proximity to the city of Boston with 32% of the watershed area and developed and also 5% of the area classified as agricultural (Table 1).
To quantify the effect on river network DIN removal and watershed export of one aspect of land use distribu-tion within watersheds, the skewness toward or away from watershed outlet, we aggregated human land use in the two test watersheds and varied the location of developed grid cells to generate contrasting SI values (Figure 1). We aimed to produce a SI of 1 (land use centered within the watershed) and the largest and smal-lest SI values possible given watershed template and human land use area. To accentuate skewness and generate a wider range of SI values, we aggregated human land use into the least possible number of grid cells while maintain the same total area of human land use. Though this aggregation allows to best test the effect of varying SI, this aggregation also makes the results of these scenarios not realistic and not com-parable to model output using actual land use distribution because land use intensity affects DIN loading. So that DIN input is equal for each scenario, we used evenly distributed runoff set to generate annual average discharge (from 2000 to 2010). To illustrate variability of effect of land use skewness on river network DIN removal with changing discharge, we also reran the model for double and half the annual discharge.
To gain a broader understanding of how land use distribution varies in the Northeast U.S., we conducted a regional analysis of the distribution of land use within large watersheds. We considered the James, Susquehanna, Delaware, Hudson, Connecticut, Merrimack, and Penobscot watersheds which cover a large area of the region, encompass several urban centers, and represent a range of land use intensity (Table 2). We calculated SI for developed and agricultural land use in each watershed.
3. Results and Discussion
Actual land use distribution in the Lamprey has a SI of 0.89 indicating that human land use is skewed toward the watershed outlet while the SI of 1.09 in the Ipswich indicates skewness toward the headwaters (Figure 1). Even though a SI greater than 1 in the Ipswich watersheds indicates more potential for in-stream DIN removal than in the Lamprey, increased DIN loading from the greater amount of developed land use still results in larger DIN export from the Ipswich watershed compared to the Lamprey (Table 1).
In the Lamprey watershed, we generated SI values ranging between 0.35 and 1.53, but in the Ipswich the range was more constrained between 0.50 and 1.47 due to a larger area of the watershed being developed
Table 1. Characteristics of the Study Watershedsa
Watershed Area (km2) Population Density (km2) Area Developed (%) Skewness
Measured DIN Export (kg km2yr1)
Modeled DIN Export (kg km2yr1)
Lamprey 474 72 14 089 77 71
Ipswich 400 310 37 1.09 171 185
a
Area developed and land use skewness represent both developed and agricultural land use categories (5% of each watershed is agricultural land with the remaining developed area being residential/commercial). Population density is calculated from 2010 census data. Both measured and modeled DIN export values are median for 2009–2009. Lamprey-measured DIN export fromDaley et al. [2010] and Ipswich-measured DIN export fromMorse and Wollheim[2014].
Figure 1.The (left) Lamprey and (right) Ipswich watersheds showing actual distribution of human land use (proportion developed + agricultural) and the three scenarios for which human land use was concentrated and located to generate a range of skewness indices from skewed toward the headwaters, centered, and skewed toward the watershed outlet.
(Figure 1). Land use skewed toward the headwaters resulted in the highest local DIN concentration due to lower dilution capacity (data not shown), but twofold greater in-stream DIN removal at the network scale compared to land use skewed toward the watershed outlet (Figure 3). Land use skewed toward the head-waters results in higher DINflux (H mix line) throughout the river network (Figure 2). Because land use area is the same across scenarios regardless of SI, DIN export without in-stream removal processing (conservative mixing,“mix”solid lines) is identical (Figure 2). However, the location of land use, as well as the amount of
Figure 2.Modeled DIN flux watershed profiles with land use skewed toward the headwaters (H, red), centered (C, purple), and toward the watershed mouth (M, blue) for the (a) Ipswich and (b) Lamprey watersheds. Solid lines represent modeled conservative mixing of DIN (mix), and the dashed line shows modeled DIN concentration with in-stream processing (removal).
Table 2. Land Use Skewness in Large Northeast U.S. Watersheds
% Land Use Skewness Index
Watershed Developed Agriculture Developed Agriculture
Connecticut 10 7 0.67 0.93
Delaware 20 19 0.61 0.86
Hudson 11 15 0.64 0.98
James 10 14 0.75 0.99
Merrimack 17 5 0.69 0.86
Penobscot 2 2 0.56 0.60
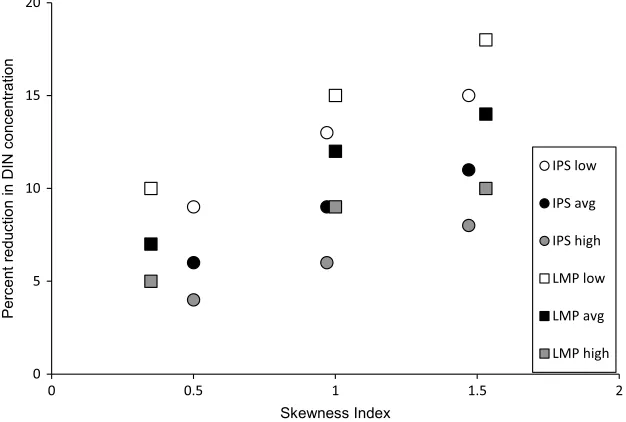
land use, and discharge affected in-stream removal of DIN (Figure 3). For the Lamprey watershed, at average annual discharge, in-stream processes reduced DIN concentration by 7, 12, and 14% when SI was 0.35, 1.00, and 1.53, respectively (Figure 3). In the Ipswich watershed, in-stream removal of DIN reduced concentrations by 6, 9, and 11% when SI was 0.50, 0.97, and 1.47, respectively (Figure 3). Increasing discharge reduced in-stream DIN removal (Figure 3). For similar SI, DIN removal was greater in the Lamprey compared to the Ipswich (Figure 3) due to lower DIN concentrations resulting from less DIN input from a smaller area of human land use (Figure 1 and Table 1). Nutrient uptake becomes less efficient as ambient nutrient concentrations increase [Mulholland et al., 2008]; therefore, increased loading can reduce the efficiency of in-stream nutrient removal. At average annual discharge, land use skewed toward the headwaters results in a reduction in DIN export of 8 and 9 kg d1in the Lamprey and Ipswich, respectively, compared to the same land use skewed toward the watershed outlet (Figure 2).
Though it is well established that human population is concentrated in coastal areas [Crowell et al., 2007], the distribution of land use within smaller coastal watersheds can vary as illustrated by the patterns in the Lamprey and Ipswich watersheds. To place the land use distribution of the Ipswich and Lamprey as well as the scenarios we generated in a regional context, we also calculated SI for developed and agricultural land use in large watersheds of the Northeastern US. In these watersheds, agricultural and developed land uses were strongly skewed toward the watershed mouth as indicated by SI<1, though in some cases, such as the Hudson and the James, agriculture was minimally skewed (Table 2). SI for developed land use ranged from 0.81 in the Susquehanna to 0.56 in the Penobscot and SI for agricultural land use ranged from 0.99 in the James to 0.60 in the Penobscot (Table 2). In each case, the distribution of developed land use was more skewed toward the watershed mouth than was agricultural land use indicating that farmland is located in the hinterlands beyond cities (Table 2).
The SI characterizes the spatial distribution of land use within watersheds in a manner that indicates the average residence time of developed land use runoff in the river network and the potential for N removal. On average, developed land use had a SI of 0.68, indicating thatflow path distances to the watershed mouth, and therefore residence times, of runoff from developed land is less than that of average runoff for each watershed. The average SI for agricultural land use was 0.88, suggesting that N inputs from agricultural land use have a greater opportunity to be processed within the river network compared to inputs from urban/suburban land use. Furthermore, the spatial distribution of human land use may help to explain
Figure 3.The percent of dissolved inorganic nitrogen (DIN) concentration that is removed by in-stream processing with varying location of human land use within the Ipswich and Lamprey watersheds. The skewness index on thexaxis indicates if land use is skewed toward the headwaters (>1), centered (1), or skewed toward the watershed outlet (<1). Black symbols represent results of simulations at annual average discharge, open symbols half of annual average discharge (low), and gray circles double annual average discharge (high) in each watershed.
why some watersheds are more retentive of N inputs than others. For example, in the James River watershed, both developed and agricultural land are less skewed toward the watershed outlet than other watersheds (Table 2) and have lower proportions of riverine N export [Boyer et al., 2002, Figure 6].
When there is a mismatch between the location of ecosystem services supply and demand, the utility of the ecosystem service can be limited [Bagstad et al., 2013,Wollheim et al., 2013]. The ecosystem service of N removal occurs throughout the river network [Hale et al., 2014]. Headwater streams play an important role in controlling nitrogen export from watersheds [Peterson et al., 2001]. However, larger rivers may also be important in processing N and regulating watershed N export [Wollheim et al., 2006; Tank et al., 2008; Stewart et al., 2011;Hall et al., 2013]. When sources of N are skewed toward the watershed mouth, potential N processing in the headwaters and midorder streams is bypassed, therefore limiting the utility of the eco-system service. Nutrient processing in streams is strongly controlled by hydrology with in-stream nutrient processing declining as discharge increases and water residence time decreases [Royer et al., 2004]. The spa-tial distribution of land use and discharge both affect river network N removal so that more DIN is removed when land use is skewed toward the distant headwaters, but the proportion of DIN removed is less with increasing discharge for all SI values (Figure 3). Thus, coastal watersheds where human land use is clustered near river mouths may be more vulnerable to eutrophication from land use change, especially during high
flow periods.
Maximizing in-stream DIN removal by exploiting surface waterflow path length and water residence time between DIN sources and watershed mouth may lead to reduced DIN export [Behrendt and Opitz, 2000, Alexander et al., 2008;Green et al., 2009] but would produce trade-offs in water quality within the river net-work. Concentrating N sources in the headwaters would result in higher nutrient concentrations throughout the river network (Figure 2). This would shift the impact from the coastal zone to degrading water quality throughout the river network. Reduced water quality would limit ecosystem services of the river systems such as providing drinking water. Elevated levels of nitrate in drinking water are a health hazard [Terblanche, 1991], and 66% of public water supply in the U.S. is withdrawn from surface waters [Kenny et al., 2005]. Using eco-system services should be done in a manner to maximize the utility of the environment without damaging the resource and considering trade-offs.
Ourfindings highlight that this ecosystem service of in-stream N removal is maximized when N sources are skewed toward the distant headwaters, especially during low flow periods, which in turn can reduce watershed N export. Therefore, the spatial distribution of land use rather than simply the total land use amount can influence ecosystem health, function, and services. Analytical approaches to evaluate and quan-tify the spatial distribution of land use, such as the SI, can be used to understand ecosystem current condition and future risk as well as inform management and development planning. We found that the skewness of N sources likely influences N processing and export on an annual scale, and it is likely to have the largest effect on DINfluxes during warm lowflow periods when the potential for in-stream processing is greatest. The SI could be used to prioritize subwatersheds and areas for nutrient runoff management.
References
Alexander, R. B., P. J. Johnes, E. W. Boyer, and R. A. Smith (2002), A comparison of models for estimating the riverine transport of nitrogen from large watersheds,Biogeochemistry,57(58), 295–339.
Alexander, R. B., R. A. Smith, G. E. Schwartz, E. W. Boyer, J. V. Nolan, and J. W. Brakebill (2008), Differences in phosphorus and nitrogen delivery to the Gulf of Mexico from the Mississippi River basin,Environ. Sci. Technol.,42, 822–830.
Allan, J. D., D. L. Erickson, and J. Fay (1997), The influence of catchment land use on stream integrity across multiple spatial scales,Freshwater Biol.,37, 149–161.
Arnold, C. L., Jr., and C. J. Gibbons (1996), Impervious surface coverage: The emergence of a key environmental indicator,J. Am. Plann. Assoc.,
62, 243–258.
Bagstad, K. J., G. W. Johnson, B. Voigt, and F. Villa (2013), Spatial dynamics of ecosystem serviceflow: A comprehensive approach to quantifying actual services,Ecosyst. Serv.,4, 117–125.
Beaulac, M. N., and K. H. Reckhow (1982), An examination of land use-nutrient export relationships,Water Res. Bull.,18, 1013–1024. Behrendt, H., and D. Opitz (2000), Retention of nutrients in rive systems: Dependence on specific runoff and hydraulic load,Hydrobiologia,
410, 111–122.
Bernhardt, E. S., et al. (2005), Can’t see the forest for the streams? In-stream processing and terrestrial nitrogen exports,BioScience,55, 219–230.
Boyer, E. W., C. L. Goodale, N. A. Jaworski, and R. W. Howarth (2002), Anthropogenic nitrogen sources and relationships to riverine export in the Northeastern U.S.A.,Biogeochemistry,57(58), 137–169.
Carpenter, S. R., N. F. Caraco, D. L. Corell, R. W. Howarth, A. N. Sharpley, and V. H. Smith (1998), Nonpoint pollution of surface waters with phosphorus and nitrogen,Ecol. Appl.,8, 559–568.
Acknowledgments
Cloern, J. E. (2001), Our evolving conceptual model of the coastal eutrophication problem,Mar. Ecol. Prog. Ser.,210, 223–253.
Cronan, C. S., J. T. Piampiano, and H. H. Patterson (1999), Influence of land use and hydrology on exports of carbon and nitrogen in a Maine River basin,J. Environ. Qual.,28, 953–961.
Crowell, M., S. Edelman, K. Coulton, and S. McAfee (2007), How many people live in coastal areas?,J. Coastal Res.,23, 3–6.
Daley, M., J. Potter, E. Difranco, and W. H. McDowell (2010), Nitrogen assessment for the Lamprey River Watershed, Report for the New Hampshire Department of Environmental Services. [Available at http://des.nh.gov/organization/divisions/water/wmb/coastal/documents/ unh_nitrogenassessment.pdf.]
Dodds, W. K., W. W. Bouska, J. L. Eitzman, T. J. Pilger, K. L. Pitts, A. J. Riley, J. T. Schlosser, and D. J. Thornbrugh (2009), Eutrophication of U.S. freshwaters: Analysis of potential economic damages,Environ. Sci. Technol.,43, 12–19.
Fekete, B. M., C. J. Vörösmarty, and R. B. Lammers (2001), Scaling gridded river networks for macroscale hydrology: Development, analysis, and control of error,Water Resour. Res.,37, 1955–1967, doi:10.1029/2001WR900024.
Foley, J. A., et al. (2005), Global consequences of land use,Science,309, 570–574.
Fry, J., G. Xian, S. Jin, J. Dewitz, C. Homer, L. Yang, C. Barnes, N. Herold, and J. Wickham (2011), Completion of the 2006 National Land Cover Database for the Conterminous United States,Photogramm. Eng. Remote Sens.,77, 858–864.
Galloway, J. N., A. R. Townsend, J. W. Erisman, M. Bekunda, Z. Cai, J. R. Freney, L. A. Martinelli, S. P. Steizinger, and M. A. Sutton (2008), Transformations of the nitrogen cycle: Recent trends, questions, and potential solutions,Science,320, 889–892.
Goodridge, B. M., and J. M. Melack (2012), Land use control of stream nitrate concentrations in mountainous coastal California watersheds,
J. Geophys. Res.,117, G02005, doi:10.1029/2011JG001833.
Green, M., W. Wollheim, N. Basu, G. Gettel, P. S. Rao, N. Morse, and R. Stewart (2009), Effective denitrification scales predictably with water residence time across diverse systems. [Available from Nature Precedings http://hdl.handle.net/10101/npre.2009.3520.1.]
Hale, I. L., W. M. Wollheim, R. G. Smith, H. Asbjornsen, A. F. Brito, K. D. Broders, A. S. Grandy, and R. J. Rowe (2014), Pushing the boundaries: A conceptual framework for assessing the environmental impacts of expanding local agriculture,Sustainability,6, 8432–8451, doi:10.3390/ su6128432.
Hall, R. O., Jr., M. A. Baker, E. J. Rosi-Marshall, and J. L. Tank (2013), Solute specific scaling of inorganic nitrogen and phosphorus uptake in streams,Biogeosciences,10, 6671–6693.
Howarth, R. W., A. Sharpley, and D. Walker (2002), Sources of nutrient pollution to coastal waters in the United States: Implications of achieving coastal water quality goals,Estuaries,25, 656–676.
Kenny, J. F., N. L. Barber, S. S. Hutson, K. S. Linsey, J. K. Lovelace, and M. A. Maupin (2005), Estimated use of water in the United States in 2005, USGS Circular 1344.
King, R. S., M. E. Baker, D. F. Whigam, D. E. Weller, T. E. Jordan, P. F. Kazyak, and M. K. Hurd (2005), Spatial considerations for linking watershed land cover to ecological indicators in streams,Ecol. Appl.,15, 137–153.
Lin, L., J. R. Webster, T. Hwang, and L. E. Band (2015), Effects of lateral nitrateflux and instream processes on dissolved inorganic nitrogen export in a forested catchment: A model sensitivity analysis,Water Resour. Res.,51, 2680–2695, doi:10.1002/2014WR015962. Morse, N. B., and W. M. Wollheim (2014), Climate variability masks the impacts of land use change on nutrient export in a suburbanizing
watershed,Biogeochemistry,121, 45–59, doi:10.1007/s10533-014-9998-6.
Mulholland, P. J., et al. (2008), Stream denitrification across biomes and its response to anthropogenic nitrate loading,Nature,452, 202–206. Peterson, B. J., et al. (2001), Control of nitrogen export from watersheds by headwater streams,Science,292, 86–90.
Piscataqua Region Estuaries Partnership (2012), Environmental data report. [Available at http://prep.unh.edu/resources/pdf/2013%20SOOE/ 2012%20PREP%20Env%20Data%20Report%20FINAL%20Compressed%20Adobe6.pdf.]
Pretty, J. N., C. F. Mason, D. B. Nedwell, R. E. Hine, S. Leaf, and R. Dils (2003), Environmental costs of freshwater eutrophication in England and Wales,Environ. Sci. Technol.,37, 201–208.
Royer, T. V., J. L. Tank, and M. B. David (2004), Transport and fate of nitrate in headwater agricultural streams in Illinois,J. Environ. Qual.,33, 1296–1304.
Seitzinger, S. P., R. V. Styles, E. W. Boyer, R. B. Alexander, G. Billen, R. W. Howarth, B. Mayer, and N. Van Breemen (2002), Nitrogen retention in rivers: Model development and application to watersheds in the Northeastern U.S.A.,Biogeochemistry,57(58), 199–237.
Sponseller, R. A., E. F. Benfield, and H. M. Valett (2001), Relationships between land use, spatial scale and stream macroinvertebrate communities,Freshwater Biol.,46, 1409–1424.
Stewart, R. J., W. M. Wollheim, M. Gooseff, M. A. Briggs, J. M. Jacobs, B. J. Peterson, and C. S. Hopkinson (2011), Separation of river network scale nitrogen removal among main channel and two transient storage compartments,Water Resour. Res.,47, W00J10, doi:10.1029/ 2010WR009896.
Stewart, R. J., W. M. Wollheim, A. Miara, C. J. Vorosmarty, B. Fekete, R. Lammers, and B. Rosenzweig (2013), Horizontal cooling towers: Riverine ecosystem services and the fate of thermoelectric heat in the contemporary Northeast,Environ. Res. Lett.,8, 025010, doi:10.1088/ 1748-9326/8/2/025010.
Strayer, D. L., R. E. Beighley, L. C. Thompson, S. Brooks, C. Nilsson, G. Pinay, and R. J. Naiman (2003), Effect of land cover on stream ecosystems: Roles of empirical models and scaling issues,Ecosystems,6, 407–423.
Tank, J. L., E. J. Rosi-Marshall, M. A. Baker, and R. O. Hall Jr. (2008), Are rivers just big streams? A pulse method to quantify nitrogen demand in a large river,Ecology,89, 2935–2945.
Terblanche, A. P. S. (1991), Health hazards of nitrate in drinking water,Water SA,17, 77–82.
Van Sickle, J., and C. B. Johnson (2008), Parametric distance weighting of landscape influence on streams,Landscape Ecol.,23, 427–438. Vorosmarty, C. J., C. A. Federer, and A. L. Schloss (1998), Evaporation functions compared on US watersheds: Possible implications for
global-scale water balance and terrestrial ecosystem modeling,J. Hydrol.,207, 147–169.
Wollheim, W. M., C. J. Vörösmarty, B. J. Perterson, S. P. Seitzinger, and C. S. Hopkinson (2006), Relationship between river size and nutrient removal,Geophys. Res. Lett.,33, L06410, doi:10.1029/2006GL025845.
Wollheim, W. M., C. J. Vorosmarty, A. F. Bouwman, P. A. Green, J. Harrison, E. Linder, B. J. Peterson, S. Seitzinger, and J. P. M. Syvitski (2008a), Global N removal by freshwater aquatic systems: A spatially distributed, within-basin approach,Global Biogeochem. Cycles,22, GB2026, doi:10.1029/2007GB002963.
Wollheim, W. M., B. J. Peterson, C. J. Vorosmarty, C. Hopkinson, and S. A. Thomas (2008b), Dynamics of N removal over annual time scales in a suburban river network,J. Geophys. Res.,113, G03038, doi:10.1029/2007JG000660.
Wollheim, W. M., M. B. Green, B. A. Pellerin, N. B. Morse, and C. S. Hopkinson (2013), Causes and consequences of ecosystem regionalization in a coastal suburban watershed,Estuaries Coasts,38, 19–34, doi:10.1007/s12237-013-9646-8.