R E S E A R C H
Open Access
Quality control material for the detection of
somatic mutations in fixed clinical
specimens by next-generation sequencing
Catherine I. Dumur
*, Jorge A. Almenara, Celeste N. Powers and Andrea Ferreira-Gonzalez
Abstract
Background:Targeted next generation sequencing (NGS) technology to assess the mutational status of multiple
genes on formalin-fixed, paraffin embedded (FFPE) tumors is rapidly being adopted in clinical settings, where quality control (QC) practices are required. Establishing reliable FFPE QC materials for NGS can be challenging and/or expensive. Here, we established a reliable and cost-effective FFPE QC material for routine utilization in the Ion AmpliSeq™Cancer Hotspot Panel v2 (CHP2) assay.
Methods:The performance characteristics of the CHP2 assay were determined by sequencing various cell line
mixtures and 55 different FFPE tumors on the Ion Torrent PGM platform. A FFPE QC material was prepared from a mixture of cell lines derived from different cancers, comprising single nucleotide variants and small deletions on actionable genes at different allelic frequencies.
Results:The CHP2 assay performed with high precision and sensitivity when custom variant calling pipeline
parameters where established. In addition, all expected somatic variants in the QC material were consistently called at variant frequencies ranging from 9.1 % (CV = 11.1 %) to 37.9 % (CV = 2.8 %).
Conclusions:The availability of a reliable and cost-effective QC material is instrumental in assessing the performance of this or any targeted NGS assay that detects somatic variants in fixed solid tumor specimens.
Background
The numerous cancer genome characterization efforts that have emerged in the past years [1–3] have promoted the development of targeted cancer therapeutics [4], in-cluding single or combined inhibitory agents [5], which reportedly are beneficial to individuals who have tumors harboring specific somatic mutations in genes encoding for proteins involved in cell growth, proliferation, and survival signaling pathways [6–9]. Thus, molecular testing to identify such mutations in clinical specimens to assess patient eligibility for targeted therapies has become stand-ard practice in the management of oncology patients.
The recent technological advances in next-generation sequencing (NGS) and the applications in the field of oncology are revolutionizing clinical testing for person-alized treatment decisions for oncology patients [10]; as well as the translational research field, where somatic
variant findings may enhance the development of novel targeted cancer therapeutics, which could benefit individ-uals with tumors harboring such mutations. A variety of different NGS-based assays have been developed for mutation identification that have the ability to detect all mutation types, including single nucleotide variants (SNVs), copy number variants (CNVs), insertion/deletions (Indels) and translocations, in many samples and many genomic regions simultaneously, while providing a digital readout of mutation frequencies.
The advent of NGS benchtop sequencers has allowed the rapid adoption of molecular testing for somatic mu-tations in clinical settings [11–13]. Thus, amplifying discrete or targeted regions of the genome has allowed for the development of panels of “amplicon sequen-cing.” As an example, the Ion AmpliSeq™ Cancer Hot-spot Panel v2 (Life Technologies, Carlsbad, CA), which targets 207 exonic regions across 50 cancer-relevant genes, is producing robust results starting from 1 to 10 ng of DNA isolated from formalin-fixed, paraffin * Correspondence:[email protected]
Department of Pathology, Virginia Commonwealth University, Clinical Support Center, Room 247, 403 North 13th Street, Richmond, VA 23298, USA
© 2015 Dumur et al.Open AccessThis article is distributed under the terms of the Creative Commons Attribution 4.0 International License (http://creativecommons.org/licenses/by/4.0/), which permits unrestricted use, distribution, and reproduction in any medium, provided you give appropriate credit to the original author(s) and the source, provide a link to the Creative Commons license, and indicate if changes were made. The Creative Commons Public Domain Dedication waiver (http://creativecommons.org/publicdomain/zero/1.0/) applies to the data made available in this article, unless otherwise stated. Dumuret al. Diagnostic Pathology (2015) 10:169
embedded (FFPE) specimens [14]. Such an assay can yield up to 1 gigabyte (Gb) of DNA sequence in the Ion Torrent Personal Genome Machine™(PGM), depending on the chip used to run the sequencing reaction, in short DNA fragments. Similarly, the TruSeq Amplicon - Cancer Panel (Illumina, Inc., San Diego, CA), assay allows the sequencing of mutational hotspots located in 212 exonic regions corresponding to 48 cancer-related genes on the Illumina MiSeq, from 250 ng of DNA sample. These NGS platforms provide the benefit of targeting multiple genomic regions in a single reaction, thus lowering the cost of the assay and allowing for testing multiple genes in small samples.
However, the performance characteristics of NGS-based clinical assays needs to be assessed during the assay validation process, and ensured during routine clinical runs [15]. One of the remaining challenges for NGS-based clinical assays is the availability of robust, cost effective, reference or quality control (QC) material. Access to such material is crucial to be able to generate confident NGS results, while managing potential workflow variability from sample extraction to sequencing, data ana-lysis pipeline and variant calling.
In this study we describe the analytical and clinical validation of a 50-gene NGS assay, the Ion AmpliSeq™ Cancer Hotspot Panel v2 (CHP2), performed on the Ion Torrent PGM, for clinical testing, as well as the develop-ment of a robust, and relatively low cost, QC material to assess performance characteristics during routine clinical runs.
Materials and methods Cell lines
DNA isolated from fresh-frozen, as well as from formalin-fixed, paraffin-embedded (FFPE) cell pellets from mel-anoma (SK-MEL28), pancreatic (MIA-PaCa-2), colon (HCT116), and lung (H1975) cancer cell lines was used. All the cell lines were obtained from American Type Culture Collection (ATCC-http://www.atcc.org, Manassas, VA). Each individual cell line DNA sample was sequenced alone or combined with others in different proportions, resulting in various sample mixes harboring different mu-tations, at different frequencies.
Tissue specimens
Fifty five de-identified archival DNA samples isolated from FFPE tissue blocks containing greater than 40 % neo-plastic cells (43 non-small cell lung carcinoma (NSCLC), 4 colorectal cancer, and 8 melanoma cases) with known mutational status for the KRAS, EGFR and BRAF (in-cluding 25 Negative and 30 Positive for mutations in at least one of these three genes) were used for the clinical validation of the CHP2 assay. These DNA samples had
previously been isolated from tumor-enriched samples by manual Microdissection, when indicated by a pathologist.
Single gene mutation assays
KRAS mutations in codons 12 and 13 were detected by Sanger sequencing, preceded by a Co-amplification at Lower Denaturation-temperature PCR (COLD-PCR) [16] step for allele enrichment, whereasEGFRmutations in exons 18 to 21 were detected by Scorpion primer-probes and Amplification Refractory Mutation Screening (ARMS®) [17] technology using the real-time PCR-based EGFR RGQ PCR assay (Qiagen, Valencia, CA) according to the manufacturer’s recommendations. BRAF muta-tions in the V600 codon, as well as specificSMAD4and
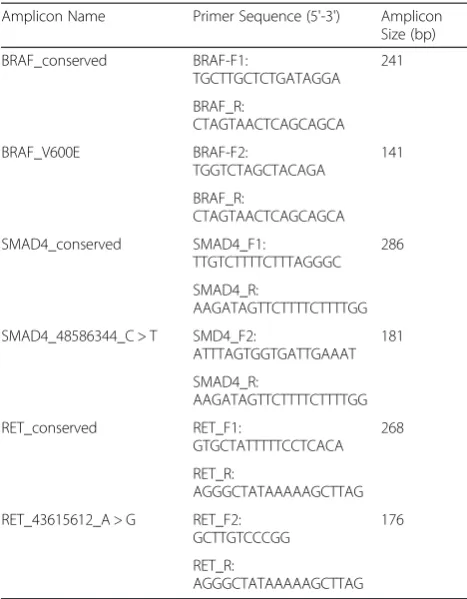
RET variants, were detected by multiplex allele-specific PCR (AS-PCR) reactions that co-amplify the variant sequence and an upstream conserved sequence, where amplicons were detected by capillary electrophoresis using Lab-on-a-Chip technology. The primers used for the multiplex AS-PCR amplification for BRAF, SMAD4 and
RETspecific variants are listed in Table 1, along with the resulting amplicon sizes.
DNA isolation
All tissue H&E stained slides were reviewed by a patholo-gist who assessed percent tumor content and delineated the tumor area for manual microdissection, if needed. Ten-micron unstained FFPE slides were then manually dissected, when indicated, and DNA was extracted using the DNA mini kit as described by the manufacturer (Qiagen, Germantown, MD). The same DNA extraction method was used for the fresh-frozen and FFPE cell line pellets and from specimens subjected to laser capture microdissection (LCM). Double-stranded DNA (dsDNA) yield and concentration was assessed by fluor-ometry on the Qubit® 2.0 instrument (Life Technologies, Carlsbad, CA)
Library preparation
The Ion AmpliSeq™ Cancer Hotspot Panel v2 (CHP2) was used to generate 207 amplicons covering over 2,800 hotspots, indexed in the COSMIC database, in 50 cancer-related genes, from 1 to 10 ng of dsDNA for each sample, using additional PCR cycles for the lowest dsDNA concentrations. The multiplexed amplicons were then used to generate barcoded libraries using the Ion AmpliSeq™ Library Kit 2.0 and the Ion Xpress™ barcoded adapters (Life Technologies, Carlsbad, CA). Amplified libraries were quantitated following the manu-facturer's recommendations. Barcoded libraries were com-bined to a final concentration of 7 pM, to achieve optimal yield of clonal templated Ion Sphere™Particles (ISPs), for emulsion PCR (emPCR) and further ISP enrichment fol-lowing the manufacturer's recommendations. Sequencing
was performed on 316™ chips run on the Ion Torrent PGM and analyzed with the Torrent Suite v4.0.2 Software. The February 2009 assembly of the human genome (hg19, GRCh37 Genome Reference Consortium Human Refer-ence 37) was used as a referRefer-ence.
Determining the Limit of Detection (LoD)
DNA mixes from the four fresh-frozen cell line pellets used in this study were further diluted in DNA isolated from a de-identified normal snap-frozen human pla-centa to achieve several different variants at different frequencies 39 variants in 24 genes. In addition, DNA isolated from FFPE cell line pellets was combined in different proportions to achieve 37 variants at different frequencies in 23 genes.
Analytical performance evaluation
Robustness, repeatability and reproducibility were assessed by preparing multiple libraries from the LoD sample mix-tures and running them in different 316™chips. Accuracy was evaluated by comparing variant frequencies obtained from individual cell lines with the results obtained by the Genomics and Bioinformatics Group (GBG) from NCI, by querying the CellMiner database [18]. In addition, libraries from the 55 patient samples and from the well-characterized reference DNA sample NA12878 from the HapMap project [19] were sequenced and
compared to single gene mutation assay results to fur-ther assess the accuracy of the CHP2 assay.
Data analysis pipeline
The sequencing data generated by the Ion Torrent PGM was stored and analyzed in the Linux-based Ser-ver, based on Ubuntu operating system, connected to the instrument. The file types created during sequen-cing included: raw image acquisition . DAT files; base-calling, resulting in an unmapped BAM format file; and alignment to the reference genome using the TMAP aligner algorithm, with the output being a BAM file. Out-put BAM files, along with target regions BED files, were used for variant identification by theVariantCallerplugin. Visualization of the raw alignments was assessed using the Broad's Integrative Genomics Viewer (IGV 2.3.11) [20].
Variant calling
The Torrent VariantCaller (TVC) plugin was used to identify and evaluate variants. The CHP2 assay was vali-dated with the TVC 4.0 version of the plugin. The TVC 4.0 is designed to call SNVs, multi-nucleotide variants (MNVs), insertions (INS), and deletions (DEL). The ana-lysis pipeline uses FreeBayes, based on user-modifiable parameters, such as coverage, quality, strand bias, and ho-mopolymer length, among others, to discover candidate variant locations, which are subsequently scored using adaptive signal model and filtered. FreeBayes [21] is a haplotype-based variant detector that runs in a Bayesian statistical framework, which is capable of modeling multi-allelic loci in sets of individuals with non-uniform copy number. Afterwards, a second module performs assembly of reads to detect long INS and/or DEL (Indels). A set of seven barcoded FFPE cell line mix samples with known variant frequencies were used to establish cutoff values for critical TVC parameters to achieve enough stringency (fewer false positives), while maintaining high sensitivity (fewer false negatives) in the variant calling process. For each critical parameter, z-scores of normally distributed data were calculated to establish cutoff values to be used the custom TVC plugin parameters, which were recorded in a JSON text format. We used the Shapiro-Wilk normal-ity test [22] to assess the normalnormal-ity of the critical parame-ters distribution.
Quality Control (QC) material
QC material was prepared by growing the four cell lines in individual T-75 flasks up to right before they reach confluence. Then, cells were scrapped off each flask and pooled together in PBS. This cell mixture was centrifuged for 10 min at 1800 rpm and the supernatant was decanted. The cell pellet was then resuspended in 500μL of normal human plasma. Fifty μL of thrombin solution (Siemens Healthcare Diagnostics Inc., Tarrytown, NY) were added Table 1ASPCR Primers
Amplicon Name Primer Sequence (5'-3') Amplicon
Size (bp) BRAF_conserved BRAF-F1: TGCTTGCTCTGATAGGA 241 BRAF_R: CTAGTAACTCAGCAGCA BRAF_V600E BRAF-F2: TGGTCTAGCTACAGA 141 BRAF_R: CTAGTAACTCAGCAGCA SMAD4_conserved SMAD4_F1: TTGTCTTTTCTTTAGGGC 286 SMAD4_R: AAGATAGTTCTTTTCTTTTGG
SMAD4_48586344_C > T SMD4_F2:
ATTTAGTGGTGATTGAAAT 181 SMAD4_R: AAGATAGTTCTTTTCTTTTGG RET_conserved RET_F1: GTGCTATTTTTCCTCACA 268 RET_R: AGGGCTATAAAAAGCTTAG
RET_43615612_A > G RET_F2:
GCTTGTCCCGG
176
RET_R:
AGGGCTATAAAAAGCTTAG
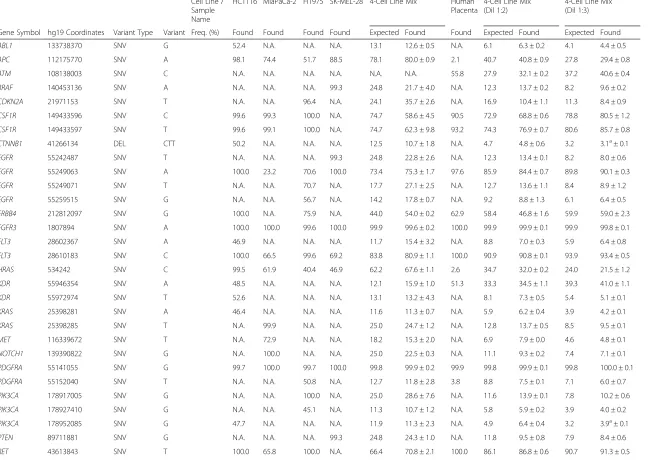
Table 2Variants identified in DNA isolated from frozen cell line mixes
Cell Line / Sample Name
HCT116 MiaPaCa-2 H1975 SK-MEL-28 4-Cell Line Mix Human Placenta
4-Cell Line Mix (Dil 1:2)
4-Cell Line Mix (Dil 1:3)
Gene Symbol hg19 Coordinates Variant Type Variant Freq. (%) Found Found Found Found Expected Found Found Expected Found Expected Found
ABL1 133738370 SNV G 52.4 N.A. N.A. N.A. 13.1 12.6 ± 0.5 N.A. 6.1 6.3 ± 0.2 4.1 4.4 ± 0.5
APC 112175770 SNV A 98.1 74.4 51.7 88.5 78.1 80.0 ± 0.9 2.1 40.7 40.8 ± 0.9 27.8 29.4 ± 0.8
ATM 108138003 SNV C N.A. N.A. N.A. N.A. N.A. N.A. 55.8 27.9 32.1 ± 0.2 37.2 40.6 ± 0.4
BRAF 140453136 SNV A N.A. N.A. N.A. 99.3 24.8 21.7 ± 4.0 N.A. 12.3 13.7 ± 0.2 8.2 9.6 ± 0.2
CDKN2A 21971153 SNV T N.A. N.A. 96.4 N.A. 24.1 35.7 ± 2.6 N.A. 16.9 10.4 ± 1.1 11.3 8.4 ± 0.9
CSF1R 149433596 SNV C 99.6 99.3 100.0 N.A. 74.7 58.6 ± 4.5 90.5 72.9 68.8 ± 0.6 78.8 80.5 ± 1.2
CSF1R 149433597 SNV T 99.6 99.1 100.0 N.A. 74.7 62.3 ± 9.8 93.2 74.3 76.9 ± 0.7 80.6 85.7 ± 0.8
CTNNB1 41266134 DEL CTT 50.2 N.A. N.A. N.A. 12.5 10.7 ± 1.8 N.A. 4.7 4.8 ± 0.6 3.2 3.1a± 0.1
EGFR 55242487 SNV T N.A. N.A. N.A. 99.3 24.8 22.8 ± 2.6 N.A. 12.3 13.4 ± 0.1 8.2 8.0 ± 0.6
EGFR 55249063 SNV A 100.0 23.2 70.6 100.0 73.4 75.3 ± 1.7 97.6 85.9 84.4 ± 0.7 89.8 90.1 ± 0.3
EGFR 55249071 SNV T N.A. N.A. 70.7 N.A. 17.7 27.1 ± 2.5 N.A. 12.7 13.6 ± 1.1 8.4 8.9 ± 1.2
EGFR 55259515 SNV G N.A. N.A. 56.7 N.A. 14.2 17.8 ± 0.7 N.A. 9.2 8.8 ± 1.3 6.1 6.4 ± 0.5
ERBB4 212812097 SNV G 100.0 N.A. 75.9 N.A. 44.0 54.0 ± 0.2 62.9 58.4 46.8 ± 1.6 59.9 59.0 ± 2.3
FGFR3 1807894 SNV A 100.0 100.0 99.6 100.0 99.9 99.6 ± 0.2 100.0 99.9 99.9 ± 0.1 99.9 99.8 ± 0.1
FLT3 28602367 SNV A 46.9 N.A. N.A. N.A. 11.7 15.4 ± 3.2 N.A. 8.8 7.0 ± 0.3 5.9 6.4 ± 0.8
FLT3 28610183 SNV C 100.0 66.5 99.6 69.2 83.8 80.9 ± 1.1 100.0 90.9 90.8 ± 0.1 93.9 93.4 ± 0.5
HRAS 534242 SNV C 99.5 61.9 40.4 46.9 62.2 67.6 ± 1.1 2.6 34.7 32.0 ± 0.2 24.0 21.5 ± 1.2
KDR 55946354 SNV A 48.5 N.A. N.A. N.A. 12.1 15.9 ± 1.0 51.3 33.3 34.5 ± 1.1 39.3 41.0 ± 1.1
KDR 55972974 SNV T 52.6 N.A. N.A. N.A. 13.1 13.2 ± 4.3 N.A. 8.1 7.3 ± 0.5 5.4 5.1 ± 0.1
KRAS 25398281 SNV A 46.4 N.A. N.A. N.A. 11.6 11.3 ± 0.7 N.A. 5.9 6.2 ± 0.4 3.9 4.2 ± 0.1
KRAS 25398285 SNV T N.A. 99.9 N.A. N.A. 25.0 24.7 ± 1.2 N.A. 12.8 13.7 ± 0.5 8.5 9.5 ± 0.1
MET 116339672 SNV T N.A. 72.9 N.A. N.A. 18.2 15.3 ± 2.0 N.A. 6.9 7.9 ± 0.0 4.6 4.8 ± 0.1
NOTCH1 139390822 SNV G N.A. 100.0 N.A. N.A. 25.0 22.5 ± 0.3 N.A. 11.1 9.3 ± 0.2 7.4 7.1 ± 0.1
PDGFRA 55141055 SNV G 99.7 100.0 99.7 100.0 99.8 99.9 ± 0.2 99.9 99.8 99.9 ± 0.1 99.8 100.0 ± 0.1
PDGFRA 55152040 SNV T N.A. N.A. 50.8 N.A. 12.7 11.8 ± 2.8 3.8 8.8 7.5 ± 0.1 7.1 6.0 ± 0.7
PIK3CA 178917005 SNV G N.A. N.A. 100.0 N.A. 25.0 28.6 ± 7.6 N.A. 11.6 13.9 ± 0.1 7.8 10.2 ± 0.6
PIK3CA 178927410 SNV G N.A. N.A. 45.1 N.A. 11.3 10.7 ± 1.2 N.A. 5.8 5.9 ± 0.2 3.9 4.0 ± 0.2
PIK3CA 178952085 SNV G 47.7 N.A. N.A. N.A. 11.9 11.3 ± 2.3 N.A. 4.9 6.4 ± 0.4 3.2 3.9a± 0.1
PTEN 89711881 SNV G N.A. N.A. N.A. 99.3 24.8 24.3 ± 1.0 N.A. 11.8 9.5 ± 0.8 7.9 8.4 ± 0.6
RET 43613843 SNV T 100.0 65.8 100.0 N.A. 66.4 70.8 ± 2.1 100.0 86.1 86.8 ± 0.6 90.7 91.3 ± 0.5
Dumur
et
al.
Diagnostic
Pathology
(2015) 10:169
Page
4
of
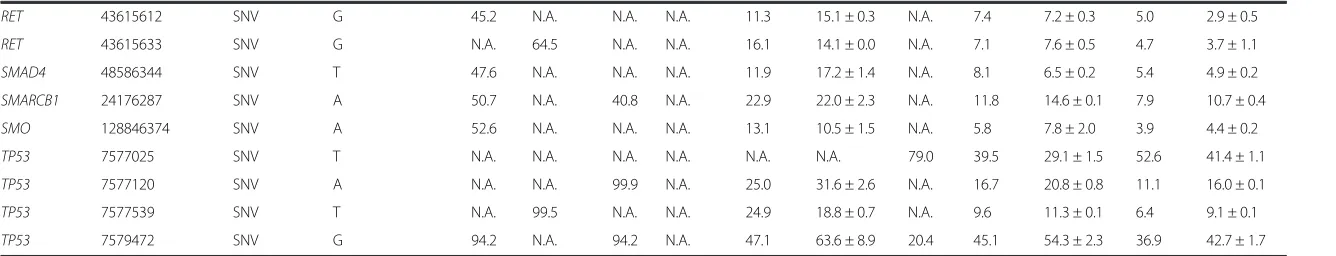
Table 2Variants identified in DNA isolated from frozen cell line mixes(Continued)
RET 43615612 SNV G 45.2 N.A. N.A. N.A. 11.3 15.1 ± 0.3 N.A. 7.4 7.2 ± 0.3 5.0 2.9 ± 0.5
RET 43615633 SNV G N.A. 64.5 N.A. N.A. 16.1 14.1 ± 0.0 N.A. 7.1 7.6 ± 0.5 4.7 3.7 ± 1.1
SMAD4 48586344 SNV T 47.6 N.A. N.A. N.A. 11.9 17.2 ± 1.4 N.A. 8.1 6.5 ± 0.2 5.4 4.9 ± 0.2
SMARCB1 24176287 SNV A 50.7 N.A. 40.8 N.A. 22.9 22.0 ± 2.3 N.A. 11.8 14.6 ± 0.1 7.9 10.7 ± 0.4
SMO 128846374 SNV A 52.6 N.A. N.A. N.A. 13.1 10.5 ± 1.5 N.A. 5.8 7.8 ± 2.0 3.9 4.4 ± 0.2
TP53 7577025 SNV T N.A. N.A. N.A. N.A. N.A. N.A. 79.0 39.5 29.1 ± 1.5 52.6 41.4 ± 1.1
TP53 7577120 SNV A N.A. N.A. 99.9 N.A. 25.0 31.6 ± 2.6 N.A. 16.7 20.8 ± 0.8 11.1 16.0 ± 0.1
TP53 7577539 SNV T N.A. 99.5 N.A. N.A. 24.9 18.8 ± 0.7 N.A. 9.6 11.3 ± 0.1 6.4 9.1 ± 0.1
TP53 7579472 SNV G 94.2 N.A. 94.2 N.A. 47.1 63.6 ± 8.9 20.4 45.1 54.3 ± 2.3 36.9 42.7 ± 1.7
Freq. Frequency; N.A., Not Applicable; a, these variants were called 90 % of the time
Dumur
et
al.
Diagnostic
Pathology
(2015) 10:169
Page
5
of
to the cell pellet/plasma mixture to allow a clot to form. The cell-containing clot was further fixed in formalin for 9 h (typical fixation time for human tissues in our labora-tory), and embedded in paraffin following the routine processing for fine-needle aspiration (FNA) cell pellets. DNA was isolated from a single 10-μm section from the cell mixture block, in parallel with patient samples in each batch of samples, and was sequenced in every run as an individual barcoded library with six more libraries from patient samples in 316™ chips. For the QC material, variants and their frequencies were first assessed by sequencing this material in 10 consecutive
runs on the Ion Torrent PGM to establish the perform-ance characteristics (i.e., Mean, +2SD, +3SD, etc.…) of each variant. After implementing this quality control material in clinical runs, the same variants and their frequencies were monitored over time using Levey-Jennings control charts.
Results
Analytical performance characteristics
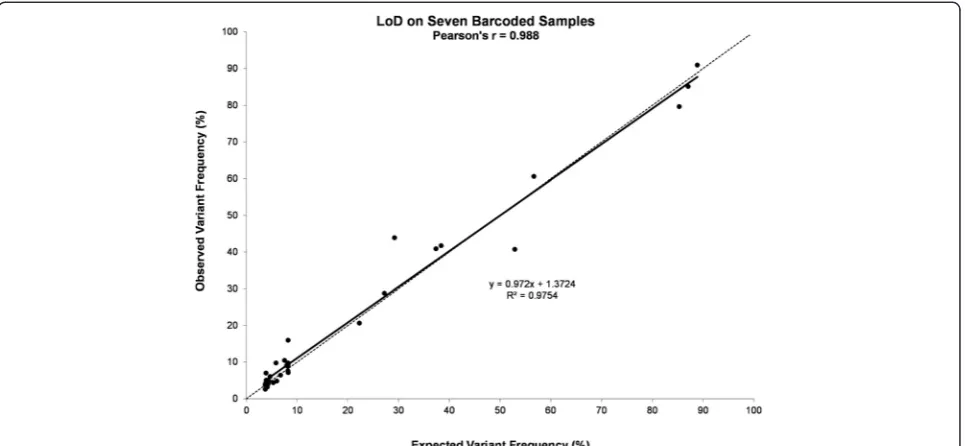
From the DNA dilution experiments, where DNA iso-lated from the four fresh-frozen cell line pellets was further diluted in DNA isolated from a de-identified Fig. 1Limit of Detection (LoD) and linearity of the CHP2 assay. DNA isolated from four fresh-frozen cell line pellets was further diluted in DNA isolated from a de-identified normal human placenta. Variants were identified at the expected frequencies, down to 3 % mutant DNA in the context of normal DNA for fresh-frozen samples, when barcoding up to 7 samples. Pearson correlation is shown. Dotted line denotes the equality line
Fig. 2Precision of the CHP2 assay. A representative sample run using different barcodes on the same chip to assess repeatability (a), or the same barcode on different chips to assess reproducibility (b). Pearson correlation is shown. Dotted line denotes the equality line
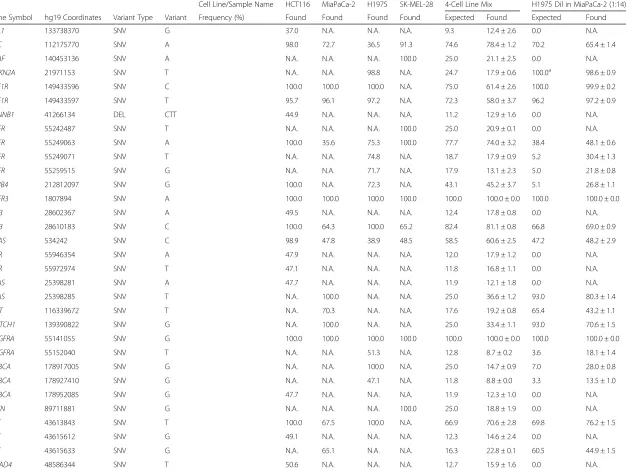
Table 3Variants identified in DNA isolated from FFPE cell line mixes
Cell Line/Sample Name HCT116 MiaPaCa-2 H1975 SK-MEL-28 4-Cell Line Mix H1975 Dil in MiaPaCa-2 (1:14)
Gene Symbol hg19 Coordinates Variant Type Variant Frequency (%) Found Found Found Found Expected Found Expected Found
ABL1 133738370 SNV G 37.0 N.A. N.A. N.A. 9.3 12.4 ± 2.6 0.0 N.A.
APC 112175770 SNV A 98.0 72.7 36.5 91.3 74.6 78.4 ± 1.2 70.2 65.4 ± 1.4
BRAF 140453136 SNV A N.A. N.A. N.A. 100.0 25.0 21.1 ± 2.5 0.0 N.A.
CDKN2A 21971153 SNV T N.A. N.A. 98.8 N.A. 24.7 17.9 ± 0.6 100.0a 98.6 ± 0.9
CSF1R 149433596 SNV C 100.0 100.0 100.0 N.A. 75.0 61.4 ± 2.6 100.0 99.9 ± 0.2
CSF1R 149433597 SNV T 95.7 96.1 97.2 N.A. 72.3 58.0 ± 3.7 96.2 97.2 ± 0.9
CTNNB1 41266134 DEL CTT 44.9 N.A. N.A. N.A. 11.2 12.9 ± 1.6 0.0 N.A.
EGFR 55242487 SNV T N.A. N.A. N.A. 100.0 25.0 20.9 ± 0.1 0.0 N.A.
EGFR 55249063 SNV A 100.0 35.6 75.3 100.0 77.7 74.0 ± 3.2 38.4 48.1 ± 0.6
EGFR 55249071 SNV T N.A. N.A. 74.8 N.A. 18.7 17.9 ± 0.9 5.2 30.4 ± 1.3
EGFR 55259515 SNV G N.A. N.A. 71.7 N.A. 17.9 13.1 ± 2.3 5.0 21.8 ± 0.8
ERBB4 212812097 SNV G 100.0 N.A. 72.3 N.A. 43.1 45.2 ± 3.7 5.1 26.8 ± 1.1
FGFR3 1807894 SNV A 100.0 100.0 100.0 100.0 100.0 100.0 ± 0.0 100.0 100.0 ± 0.0
FLT3 28602367 SNV A 49.5 N.A. N.A. N.A. 12.4 17.8 ± 0.8 0.0 N.A.
FLT3 28610183 SNV C 100.0 64.3 100.0 65.2 82.4 81.1 ± 0.8 66.8 69.0 ± 0.9
HRAS 534242 SNV C 98.9 47.8 38.9 48.5 58.5 60.6 ± 2.5 47.2 48.2 ± 2.9
KDR 55946354 SNV A 47.9 N.A. N.A. N.A. 12.0 17.9 ± 1.2 0.0 N.A.
KDR 55972974 SNV T 47.1 N.A. N.A. N.A. 11.8 16.8 ± 1.1 0.0 N.A.
KRAS 25398281 SNV A 47.7 N.A. N.A. N.A. 11.9 12.1 ± 1.8 0.0 N.A.
KRAS 25398285 SNV T N.A. 100.0 N.A. N.A. 25.0 36.6 ± 1.2 93.0 80.3 ± 1.4
MET 116339672 SNV T N.A. 70.3 N.A. N.A. 17.6 19.2 ± 0.8 65.4 43.2 ± 1.1
NOTCH1 139390822 SNV G N.A. 100.0 N.A. N.A. 25.0 33.4 ± 1.1 93.0 70.6 ± 1.5
PDGFRA 55141055 SNV G 100.0 100.0 100.0 100.0 100.0 100.0 ± 0.0 100.0 100.0 ± 0.0
PDGFRA 55152040 SNV T N.A. N.A. 51.3 N.A. 12.8 8.7 ± 0.2 3.6 18.1 ± 1.4
PIK3CA 178917005 SNV G N.A. N.A. 100.0 N.A. 25.0 14.7 ± 0.9 7.0 28.0 ± 0.8
PIK3CA 178927410 SNV G N.A. N.A. 47.1 N.A. 11.8 8.8 ± 0.0 3.3 13.5 ± 1.0
PIK3CA 178952085 SNV G 47.7 N.A. N.A. N.A. 11.9 12.3 ± 1.0 0.0 N.A.
PTEN 89711881 SNV G N.A. N.A. N.A. 100.0 25.0 18.8 ± 1.9 0.0 N.A.
RET 43613843 SNV T 100.0 67.5 100.0 N.A. 66.9 70.6 ± 2.8 69.8 76.2 ± 1.5
RET 43615612 SNV G 49.1 N.A. N.A. N.A. 12.3 14.6 ± 2.4 0.0 N.A.
RET 43615633 SNV G N.A. 65.1 N.A. N.A. 16.3 22.8 ± 0.1 60.5 44.9 ± 1.5
SMAD4 48586344 SNV T 50.6 N.A. N.A. N.A. 12.7 15.9 ± 1.6 0.0 N.A.
Dumur
et
al.
Diagnostic
Pathology
(2015) 10:169
Page
7
of
Table 3Variants identified in DNA isolated from FFPE cell line mixes(Continued)
SMARCB1 24176287 SNV A 52.1 N.A. 46.3 N.A. 24.6 20.2 ± 0.6 3.2 15.6 ± 1.0
SMO 128846374 SNV A 51.0 N.A. N.A. N.A. 12.8 12.7 ± 1.8 0.0 N.A.
TP53 7577120 SNV A N.A. N.A. 100.0 N.A. 25.0 20.7 ± 0.8 7.0 32.8 ± 1.6
TP53 7577539 SNV T N.A. 99.9 N.A. N.A. 25.0 27.6 ± 1.1 92.9 67.8 ± 1.4
TP53 7579472 SNV G 84.2 N.A. 90.8 N.A. 43.8 57.6 ± 8.3 6.4 37.9 ± 5.2
N.A., Not Applicable; a, the MiaPaCa-2 cell line has a homozygous deletion of theCDKN2Agene
Dumur
et
al.
Diagnostic
Pathology
(2015) 10:169
Page
8
of
normal human placenta, we were able to detect the var-iants, both SNV and DEL, at the frequencies listed in Table 2. Since variants with frequencies near 3 % were called only 90 % of the time, we established the limit of detection (LoD) at 4 % mutant DNA in the context of normal DNA for fresh-frozen samples, which were detected 100 % of the time when barcoding up to seven samples with an average coverage of near 2000X per sample (Fig. 1). In addition, the same samples run using different barcodes within the same chip, or the same barcode on different chips, showed excellent correla-tions indicating high repeatability and reproducibility, respectively (Fig. 2).
From the DNA dilution experiments, where DNA iso-lated from different FFPE cell line pellets was mixed in different proportions, we were able to detect the vari-ants, at different frequencies (Table 3) without affecting the LoD found with DNA isolated from fresh-frozen specimens, when barcoding up to seven samples with an average coverage of near 1300X per sample.
In terms of accuracy, we correlated the variant find-ings for the HCT116 and SK-MEL-28 cell lines analyzed in this study with the results obtained by the Genomics and Bioinformatics Group (GBG) from NCI, by query-ing the CellMiner database [18]. This database contains genomic information on the cell lines from the NCI-60 project. These cell lines have been intensely investigated, and a comprehensive analysis of coding variants in these
cell lines have been identified by whole exome sequencing (WES). Thus, we found that all but two variants had previ-ously been identified by WES. In the HCT116 cell line, two variants were not found on the CellMiner database: SMAD4_48586344_C > T and RET_43615612_A > G.
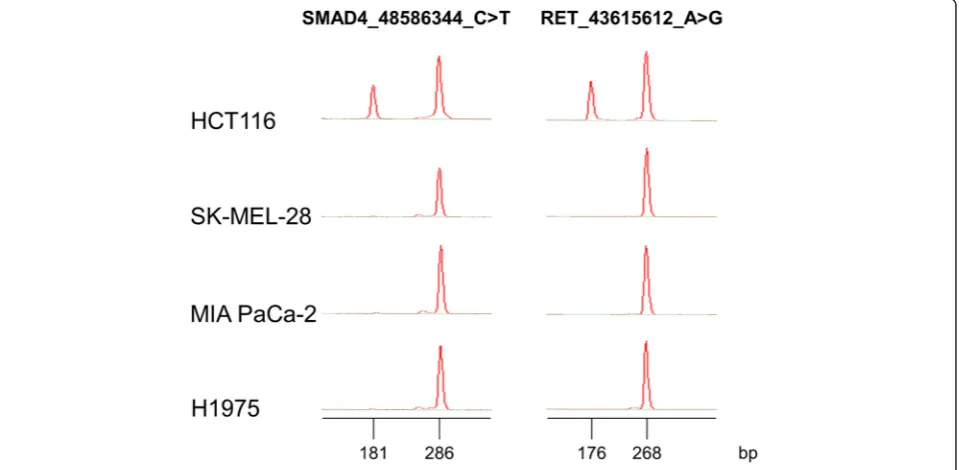
The variant in the SMAD4 gene is located in an in-tronic region; therefore it may not have been detected by WES. In order to validate the presence of this variant in our cell line, we designed a multiplex allele-specific PCR (ASPCR) assay to assess the presence of such variant, which, according to our results, seemed to be found in our clone of HCT116 cells, in a heterozy-gous fashion. Primers were designed to co-amplify a conserved region of theSMAD4 gene (286 bp), encom-passing the C > T variant, and a variant-specific ampli-con (181 bp) in the same reaction tube. Two PCR master-mixes were designed: one that would detect the variant, and another one that would detect the normal sequence in that position. Similarly, primers were de-signed to co-amplify a conserved region of the RET gene (268 bp), encompassing the A > G variant, and a variant-specific amplicon (176 bp) in the same reaction tube. As shown on Fig. 3, HCT116, but not the other cell lines, showed evidence of the variant, confirming our sequencing results.
In addition, we found 100 % agreement with the variants identified by our CHP2 assay in the well-characterized ref-erence DNA sample NA12878 from the HapMap project
Fig. 3Multiplex ASPCR results. Novel variants found in theSMAD4andRETgenes were confirmed by ASPCR and capillary electrophoresis using Lab-on-a-Chip technology performed on the 4 cell lines used in this study. For theSMAD4gene, the 286 bp peak corresponds to a conserved re-gion encompassing the C > T variant at the 48,586,344 position in the hg19 reference genome and the 181 bp peak corresponds to the variant-specific amplicon. For theRETgene, the 268 bp peak corresponds to a conserved region encompassing the A > G variant at the 43,615,612 pos-ition in the hg19 reference genome, and the 176 bp peak corresponds to the variant-specific amplicon
[19] with those reported by others sequencing the same genomic regions (Life Technologies, Carlsbad, CA).
Effect of formalin fixation and Laser Capture Microdissection (LCM)
In order to assess the potential effects of formalin fix-ation on variant identificfix-ation, we sequenced DNA iso-lated from fresh-frozen cell lines and from DNA isolated from FFPE cell pellets prepared from the same cell lines. We then compared the variants identified in the fresh-frozen cell lines and their FFPE counterparts. Excellent Pearson’s correlations were observed for all the
variant frequencies identified in each pair of samples (i.e. MIA-PaCa-2r= 0.989, HCT116r= 0.986, SK-MEL-28r= 0.995, H1975r= 0.992; p < 0.001).
In addition, we assessed the potential effects of Laser Capture Microdissection (LCM) on variant detection by sequencing DNA isolated from a whole tissue section from a NSCLC case, containing near 70 % neoplastic cells, and from DNA isolated from tumor cells enriched by LCM from the same case. We then compared the variants and their frequencies identified in each sample type. An excellent Pearson’s correlation (r= 0.909, p= 7.3 x 10⁻⁸) was observed between the two sample types, while Pathogenic/Likely Pathogenic somatic variants, such as
EGFR NM_005228.3: c.2307_2308insGCCAGCGTG (p.Val769_Asp770insAlaSerVal) and TP53 NM_000546.5: c.659A > G (p.Tyr220Cys) were over-represented (i.e. at higher allelic variant frequencies) in the LCM sample compared to the whole tissue sample, as expected.
VariantCaller plugin parameters
The seven barcoded FFPE cell line mix samples with known variant frequencies were used to establish cutoff values for critical run and TVC parameters to achieve enough stringency (fewer false positives), while main-taining high sensitivity (fewer false negatives) in the Table 4Cutoff values for Ion Torrent PGM sequencing and TVC
parameters
Mean S.D. Confidence
Level
z Cutoff
(at z-score)
Coverage 1231 526 95 % 199 200
Number of
≥Q20 bases
2.5E + 07 2.4E + 06 95 % 2.0E + 07 2.0E + 07
Quality (log10)
3.65 0.45 99 % 2.48 300a
Strand Bias 0.7 0.04 99 % 0.79 0.79
S.D., standard deviation; a, anti-logarithm of the found z value
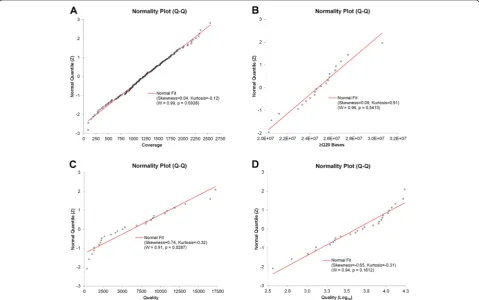
Fig. 4Normal quantile plots. The Shapiro-Wilk test was performed to assess the normality of the distribution of each of the adjustable parameters: coverage (a),≥Q20 Bases (b), TVC Quality (c), and TVC Quality (Log10) (d). The expected quantile line for a normal distribution is shown in red
Table 5Clinical specimen results for knownKRAS,EGFRandBRAFmutations
KRASorEGFRorBRAFMutation Status
Sample_ID Single-Gene Assay CHP2 Assay
DNA_01 EGFRc.2369C > T (p.Thr790Met) EGFRc.2369C > T (p.Thr790Met)
DNA_02 EGFRc.2156G > C p.Gly719Ala EGFRc.2156G > C p.Gly719Ala
DNA_03 Negative Negative
DNA_04 Negative Negative
DNA_05 EGFRExon 20 INS EGFRc.2307_2308ins9 (p.V769_D770insASV)
DNA_06 Negative Negative
DNA_07 Negative Negative
DNA_08 EGFRc.2369C > T (p.Thr790Met) EGFRc.2369C > T (p.Thr790Met)
DNA_09 EGFRc.2369C > T (p.Thr790Met) EGFRc.2369C > T (p.Thr790Met)
DNA_10 EGFRExon 19 DEL EGFRc.2236_2250del15 (p.E746_A750delELREA)
DNA_11 Negative Negative
DNA_12 Negative Negative
DNA_13 Negative Negative
DNA_14 Negative Negative
DNA_15 Negative Negative
DNA_16 Negative Negative
DNA_17 Negative Negative
DNA_18 Negative Negative
DNA_19 Negative Negative
DNA_20 Negative Negative
DNA_21 KRASc.35G > T (p.Gly12Val) KRASc.35G > T (p.Gly12Val)
DNA_22 Negative Negative
DNA_23 EGFRc.2582 T > A (p.Leu861Gln) EGFRc.2582 T > A (p.Leu861Gln)
DNA_24 EGFRc.2582 T > A (p.Leu861Gln) EGFRc.2582 T > A (p.Leu861Gln)
DNA_25 Negative Negative
DNA_26 BRAFc.1799 T > A (p.Val600Glu) BRAFc.1799 T > A (p.Val600Glu)
DNA_27 KRASc.34G > A (p.Gly12Ser) c.34G > A (p.Gly12Ser)
DNA_28 Negative Negative
DNA_29 EGFRc.2155G > A (p.Gly719Ser) EGFRc.2155G > A (p.Gly719Ser)
DNA_30 Negative Negative
DNA_31 Negative Negative
DNA_32 KRASc.34G > T (p.Gly12Cys) c.34G > T (p.Gly12Cys)
DNA_33 BRAFc.1798_1799delGTinsAA (p.Val600Lys) BRAFc.1798_1799delGTinsAA (p.Val600Lys)
DNA_34 BRAFc.1798_1799delGTinsAA (p.Val600Lys) BRAFc.1798_1799delGTinsAA (p.Val600Lys)
DNA_35 EGFRExon 19 DEL EGFRc.2235_2246del12 (p.Glu746_Glu749del)
DNA_36 Negative Negative
DNA_37 EGFRc.2573 T > G (p.Leu858Arg) EGFRc.2573 T > G (p.Leu858Arg)
DNA_38 EGFRc.2573 T > G (p.Leu858Arg) EGFRc.2573 T > G (p.Leu858Arg)
DNA_39 KRASc.34G > T (p.Gly12Cys) c.34G > T (p.Gly12Cys)
DNA_40 Negative Negative
DNA_41 KRASc.38G > A (p.Gly13Asp) c.38G > A (p.Gly13Asp)
DNA_42 KRASc.38G > A (p.Gly13Asp) c.38G > A (p.Gly13Asp)
DNA_43 EGFRc.2573 T > G (p.Leu858Arg) Negative
variant calling process. Critical parameters, including those chosen to customize the TVC plugin, with their z and cutoff values, are listed in Table 4. Graphical repre-sentations of the Shapiro-Wilk normality test for three of the critical parameters are shown in Fig. 4. Thus, based on the normal distribution of the critical parame-ters, the established cutoff values were used as custom TVC plugin parameters, which were recorded in a JSON text format. The TVC Quality parameter failed to show a normal distribution, but the log10-transformed Quality values did. Thus, a log10-transformed cutoff value was calculated, instead.
Clinical specimens
After processing the previously tested 55 clinical speci-mens, we compared the KRAS, BRAF and EGFR vari-ants obtained by NGS with our previous single gene assay results (Table 5). One clinical sample showed a L858R mutation in theEGFRgene using the single gene assay, which has a LoD of 1 % of mutant allelic fre-quency, in the context of normal DNA, but that variant was undetectable in the CHP2 assay. Upon visualizing the BAM file with the IGV tool, we found that the vari-ant was present in < 4 % of the reads (Fig. 5), therefore below the LoD of the NGS-based assay. Thus, we found that the CHP2 assay performs with 96.7 % sensitivity and 100.0 % specificity for these three genes, when compared to single gene assays, which have a LoD of 1 % forBRAFandEGFR, and 5 % forKRAS.
Common variants and artifacts
From the variants found in the 55 archived clinical sam-ples, the four cell lines and the reference DNA sample NA12878, we observed a number of recurrent variants that seem to be detected in the majority of the samples. A list of these common variants is shown in Table 6. Some of the variants correspond to sequencing artifacts, such as
homopolymers [13]. Other variants seem to systematically occur at the end of an amplicon, and others seem to cor-respond to SNPs with a high global minor allele frequency (MAF) (e.g., rs1050171 [A/G], MAF A: 0.4183).
Performance of the Quality Control (QC) Material
We have developed and implemented a high quality and cost-effective control material for routine utilization in the CHP2 assay on FFPE samples. This QC material consists of a FFPE mixture of cell lines derived from pancreatic (MIA-PaCa-2), colon (HCT116), melanoma (SK-MEL28) and lung (H1975) cancer. This cell line mixture was created to assess 8 somatic variants, includ-ing 7 SNVs and 1 small DEL located in five different genes (BRAF, EGFR, KRAS, PIK3CA, and CTNNB1) at different allelic frequencies, and was subjected to formalin fixation and paraffin embedding to mimic routine FFPE clinical specimens. The performance characteristics of the QC material were established over 10 consecutive runs. Average reads on target for the QC material was 95.13 % ± 2.33 % and average uniformity on target areas was 98.26 % ± 0.68 %. During the initial 10 consecutive runs, all expected somatic variants in the QC material were consistently called at variant frequencies ranging from 9.1 % (CV = 11.1 %) to 37.9 % (CV = 2.8 %) (Table 7). Sub-sequently, for every batch/run, DNA isolated from a single 10-μm section of this cell mixture block was barcoded along with other six samples, and the allele frequencies for variants called on the five genes were recorded and plotted in Levey-Jennings charts for every clinical run (Fig. 6).
Discussion
In the recent years, NGS has been mainly used in genomic-based research projects. The advent of cost-effective desktop instruments, such as the Illumina MiSeq and the Ion Torrent PGM, enabled the transition of NGS from genomic research into the clinical arena. In order Table 5Clinical specimen results for knownKRAS,EGFRandBRAFmutations(Continued)
DNA_44 EGFRExon 20 INS c.2312_2314dupACC (p.Pro772delinsHisPro)
DNA_45 Negative Negative
DNA_46 Negative Negative
DNA_47 KRASc.35G > T (p.Gly12Val) c.35G > T (p.Gly12Val)
DNA_48 Negative Negative
DNA_49 Negative Negative
DNA_50 BRAFc.1799 T > A (p.V600Glu) c.1799 T > A (p.V600Glu)
DNA_51 KRASc.35G > A (p.Gly12Asp) c.35G > A (p.Gly12Asp)
DNA_52 BRAFc.1799 T > A (p.Val600Glu) BRAFc.1799 T > A (p.Val600Glu)
DNA_53 KRASc.35G > T (p.Gly12Val) KRASc.35G > T (p.Gly12Val)
DNA_54 EGFRc.2573 T > G (p.Leu858Arg) EGFRc.2573 T > G (p.Leu858Arg)
DNA_55 BRAFc.1799 T > A (p.Val600Glu) BRAFc.1799 T > A (p.Val600Glu)
for NGS technology to translate into clinical testing, it must meet the rigorous quality assurance and quality con-trol protocols used in CLIA-certified laboratories and be used on a routine basis, replacing single-gene assays. This transition has already started, primarily for rare inherited disorders, including prenatal testing, and cancer theragnosis.
In this study, we assessed the performance characteris-tics of the Ion AmpliSeq™ Cancer Hotspot Panel v2 (CHP2) assay by sequencing well-characterized cell lines derived from pancreatic, colorectal, lung cancer, and melanoma, as well as different mixtures of fresh-frozen and FFPE DNA isolated from these cell lines. Thus, we assessed the sensitivity of the CHP2 assay in detecting low frequency somatic variants, or the assay’s limit of detection (LoD), as well as the assay’s precision and Fig. 5Visualization of the L858REGFRmutation. TheEGFRT > G variant indicated by the black arrow at the 55,259,515 position in the hg19 reference genome was present in a small number of reads and, therefore, was not called by the TVC
Table 6List of common variants
Gene_Position_Variant Class
EGFR_55249063_G > A High Allele Frequency SNP
FGFR3_1807894_G > A High Allele Frequency SNP
FLT3_28610183_T > C High Allele Frequency SNP
PDGFRA_55141055_A > G High Allele Frequency SNP
CSF1R_149433596_A > C End of Amplicon
CSF1R_149433597_C > T End of Amplicon
STK11_1220321_T > C Homopolymer
PTEN_89711834_INS > T Homopolymer
RB1_48953805_DEL > A Homopolymer
accuracy. In addition we evaluated the effects of sample barcoding, formalin fixation and paraffin embedding, as well as the impact of performing laser capture microdis-section, on variant calling for these samples.
By establishing sequencing run quality control and variantCaller (TVC) cutoff parameters, we were able to customize the analysis pipeline for the CHP2 assay. Thus, we assessed the accuracy of the assay by sequen-cing 55 archival DNA samples, previously tested on single-gene mutational analysis assays, as well as one DNA sample from the HapMap project [19].
Overall, our results show that the CHP2 assay has a LoD of 4 % of allelic frequency when barcoding up to 7 fresh-frozen and FFPE-derived DNA samples in a single Ion 316™ chip, with good precision as shown by excel-lent repeatability (intra-run) and reproducibility (inter-run) metrics. Likewise, the CHP2 assay showed high accuracy when correlating the variants found on DNA isolated from the HCT116 and SK-MEL-28 cell lines, which have been previously analyzed by WES by the Genomics and Bioinformatics Group (GBG) from NCI [18]. Thus, we found that 19 out of the 21 variants had
previously been identified by the NCI’s GBG. The two unconfirmed variants seen in our laboratory were further identified by ASPCR assays, confirming that these two variants might be specific to the cell lines grown in our la-boratory, and not a sequencing artifact. Moreover, we found an excellent correlation with previously reported variants and their frequencies for the well-characterized reference DNA sample NA12878 from the HapMap project [19]. The fact that all-21 variants found in the SK-MEL-28 and HCT116 DNA samples by the CHP2 assay were confirmed by WES by the GBG from NCI, or by ASPCR as presented here, allows us to confi-dently report somatic variants detected in clinical spec-imens, when all the QC criteria presented in this study are met in the clinical run. This is in line with a re-cently published study that concludes that confirmatory analysis by Sanger sequencing of variants detected by NGS testing that meets appropriate quality thresholds is“unnecessarily redundant”[23].
Furthermore, when sequencing previously tested 55 clinical specimens, we found that the CHP2 assay per-forms with 96.7 % sensitivity and 100.0 % specificity for the KRAS, BRAF and EGFR genes, when compared to single gene assays results, using as little as 1–10 ng of FFPE DNA as template. In addition, we have identified common variants that were called in the majority of the samples, and we were able to ascertain that they corres-pond to either sequencing artifacts or to SNPs with a high global MAF. Thus, we were able to flag these com-mon variant in our analysis pipeline, to not include them in the final report.
It has been recommended that, in order to assure the quality of this, or any NGS-based assay in routine clin-ical laboratory practice, efforts should be made to estab-lish a suitable and robust reference or control material, and the sequence of such control material could be used to monitor quality as the technology and/or the analysis Table 7Performance characteristics of the QC material
Gene Symbol
hg19 Coordinates
Variant Type
Variant Mean Frequency (%)
Standard Deviation
%CV
BRAF 140453136 SNV A 18.5 1.5 7.9 %
EGFR 55242487 SNV T 17.1 1.4 7.9 %
EGFR 55249071 SNV T 28.6 1.7 6.1 %
EGFR 55259515 SNV G 23.4 1.5 6.5 %
KRAS 25398281 SNV A 9.6 0.7 7.0 %
KRAS 25398285 SNV T 37.9 1.1 2.8 %
PIK3CA 178952085 SNV G 9.1 1.0 11.1 %
CTNNB1 41266134 DEL CTT 11.5 2.0 17.8 %
Fig. 6Continuous monitoring of the QC material using Levey-Jennings plots. The lowest frequency of a SNV (a) and of a small DEL (b) from the 8 variants detected in the QC material listed in Table 7 were monitored on each run over a period of 6 months using Levey-Jennings plots. The plots show the expected mean value, previously assessed by 10 independent runs, as well as expected limits: two standard deviations (SD) (hatched lines), and three SD (solid lines). All variants frequencies are within three standard deviations of the mean expected value
pipeline evolve. Such a control material should be well characterized and have similar variants as those targeted by the assay, and should include SNVs and Indels. These variants may be pathogenic or not, and should be located in genomic regions targeted by the assay [24].
Therefore, we developed and tested a quality control (QC) material by mixing, fixing and embedding the four cell lines used in the assay validation process. The per-formance characteristics of this control were assessed during 10 independent consecutive runs and mean and ranges were established to monitor each clinical run thereafter. The fact that the QC material was created on a patient-like matrix (i.e., FFPE cell block) makes it an excellent quality control material to monitor every step of the assay, from DNA extraction to data analysis pipeline and variant calling. Also, since a single 10-μm section is used in each batch of samples for a run, the costs of running this QC material are dramatically lower than those of running some commercially available ma-terials. Moreover, the robust performance characteristics of such QC material ensures the generation of high quality sequence data from NGS testing of FFPE speci-mens, even close to the limit of detection of the assay. It is worth noting that, even though we have shown that we are able to consistently call variants at low frequen-cies, near 9 %, in the QC material presented here, this alone does not ensure that variants at lower frequencies (i.e. <9 %) will be confidently called by the assay in every run. A thorough analytical validation, specifically well-designed experiments to assess the LoD of the assay, is required to ensure that low frequency variants are reliably called by targeted NGS assays for somatic testing of FFPE specimens.
Conclusions
In summary, during the validation process of the CHP2 assay, we have been able to customize the analysis pipe-line, including the variant calling process, resulting in a highly sensitive, precise and accurate clinical assay. More-over, we successfully developed a robust QC material that ensures consistent patient results in every clinical run. Even more importantly, this QC material, with a relative low manufacturing cost, has been instrumental to assess the performance of the CHP2 assay after each instrument preventive maintenance service, as well as minor software upgrades, which are prone to occur frequently in this rap-idly evolving field.
Competing interests
The authors declare that they have no competing interests.
Authors’contributions
CID, CNP and AFG conceived the study. CID and JAA designed the quality control material; JAA prepared the quality control material; CID analyzed the data and drafted the manuscript. All authors read and approved the final manuscript.
Acknowledgements
We would like to thank Mark Voelkner, Paula Anderson, Guoyan Gao and Pamela Morris for technical assistance in the cell line culture and processing, and in running the CHP2 assay for this study.
Received: 20 July 2015 Accepted: 28 August 2015
References
1. Bass AJ, Thorsson V, Shmulevich I, Reynolds SM. Comprehensive molecular characterization of gastric adenocarcinoma. Nature. 2014;513:202–9. 2. Celiku O, Johnson S, Zhao S, Camphausen K, Shankavaram U. Visualizing
molecular profiles of glioblastoma with GBM-BioDP. PLoS One. 2014;9:e101239.
3. Chen Y, McGee J, Chen X, Doman TN, Gong X, Zhang Y, et al. Identification of druggable cancer driver genes amplified across TCGA datasets. PLoS One. 2014;9:e98293.
4. Collins I, Workman P. New approaches to molecular cancer therapeutics. Nat Chem Biol. 2006;2:689–700.
5. Ciombor KK, Wu C, Goldberg RM. Recent therapeutic advances in the treatment of colorectal cancer. Annu Rev Med. 2015;66:83–95.
6. Dumur CI, Idowu MO, Powers CN. Targeting tyrosine kinases in cancer: the converging roles of cytopathology and molecular pathology in the era of genomic medicine. Cancer Cytopathol. 2013;121:61–71.
7. Paez JG, Janne PA, Lee JC, Tracy S, Greulich H, Gabriel S, et al. EGFR mutations in lung cancer: correlation with clinical response to gefitinib therapy. Science. 2004;304:1497–500.
8. Flaherty KT, Puzanov I, Kim KB, Ribas A, McArthur GA, Sosman JA, et al. Inhibition of mutated, activated BRAF in metastatic melanoma. N Engl J Med. 2010;363:809–19.
9. De Roock W, Jonker DJ, Di Nicolantonio F, Sartore-Bianchi A, Tu D, Siena S, et al. Association of KRAS p.G13D mutation with outcome in patients with chemotherapy-refractory metastatic colorectal cancer treated with cetuximab. JAMA. 2010;304:1812–20.
10. Dumur CI. Available resources and challenges for the clinical annotation of somatic variations. Cancer Cytopathol. 2014;122:730–6.
11. Kanagal-Shamanna R, Portier BP, Singh RR, Routbort MJ, Aldape KD, Handal BA, et al. Next-generation sequencing-based multi-gene mutation profiling of solid tumors using fine needle aspiration samples: promises and challenges for routine clinical diagnostics. Mod Pathol. 2014;27:314–27. 12. Luthra R, Patel KP, Reddy NG, Haghshenas V, Routbort MJ, Harmon MA,
et al. Next-generation sequencing-based multigene mutational screening for acute myeloid leukemia using MiSeq: applicability for diagnostics and disease monitoring. Haematologica. 2014;99:465–73.
13. Singh RR, Patel KP, Routbort MJ, Reddy NG, Barkoh BA, Handal B, et al. Clinical validation of a next-generation sequencing screen for mutational hotspots in 46 cancer-related genes. J Mol Diagn. 2013;15:607–22. 14. Tsongalis GJ, Peterson JD, de Abreu FB, Tunkey CD, Gallagher TL,
Strausbaugh LD, et al. Routine use of the Ion Torrent AmpliSeq Cancer Hotspot Panel for identification of clinically actionable somatic mutations. Clin Chem Lab Med. 2014;52:707–14.
15. Clinical and Laboratory Standards Institute. Molecular Methods for Clinical Genetics and Oncology Testing; Approved Guideline; Third Edition. CLSI document MM01-A3. Wayne, PA:CLSI. 2012.
16. Li J, Wang L, Mamon H, Kulke MH, Berbeco R, Makrigiorgos GM. Replacing PCR with COLD-PCR enriches variant DNA sequences and redefines the sensitivity of genetic testing. Nat Med. 2008;14:579–84.
17. Newton CR, Graham A, Heptinstall LE, Powell SJ, Summers C, Kalsheker N, et al. Analysis of any point mutation in DNA. The amplification refractory mutation system (ARMS). Nucleic Acids Res. 1989;17:2503–16. 18. Reinhold WC, Varma S, Sousa F, Sunshine M, Abaan OD, Davis SR, et al.
NCI-60 whole exome sequencing and pharmacological Cell Miner analyses. PLoS One. 2014;9:e101670.
19. Duitama J, McEwen GK, Huebsch T, Palczewski S, Schulz S, Verstrepen K, et al. Fosmid-based whole genome haplotyping of a HapMap trio child: evaluation of Single Individual Haplotyping techniques. Nucleic Acids Res. 2012;40:2041–53.
20. Robinson JT, Thorvaldsdottir H, Winckler W, Guttman M, Lander ES, Getz G, et al. Integrative genomics viewer. Nat Biotechnol. 2011;29:24–6. 21. Garrison E, Marth G. Haplotype-based variant detection from short-read
sequencing. arXiv preprint arXiv. 2012;1207:3907.
22. Shapiro SS, Wilk MB. An analysis of variance test for normality (complete samples). Biometrika. 1965;52:591–611.
23. Baudhuin LM, Lagerstedt SA, Klee EW, Fadra N, Oglesbee D, Ferber MJ. Confirming variants in next-generation sequencing panel testing by Sanger sequencing. J Mol Diagn. 2015;17:456–61.
24. Gargis AS, Kalman L, Berry MW, Bick DP, Dimmock DP, Hambuch T, et al. Assuring the quality of next-generation sequencing in clinical laboratory practice. Nat Biotechnol. 2012;30:1033–6.
Submit your next manuscript to BioMed Central and take full advantage of:
• Convenient online submission
• Thorough peer review
• No space constraints or color figure charges
• Immediate publication on acceptance
• Inclusion in PubMed, CAS, Scopus and Google Scholar
• Research which is freely available for redistribution
Submit your manuscript at www.biomedcentral.com/submit