INTRODUCTION
Currently, materials technology have been steadily growing, particularly in biomaterial. Biomaterials is compounds with bioinnert, bioresorbable and bioactive properties and can be implanted into living tissue system or as a substitute for the damaged tissue. 1There materials are biocampatible in human body and do not have any side effect on human body .
www.orientjchem.org
An International Open Free Access, Peer Reviewed Research Journal CODEN: OJCHEG
2014, Vol. 30, No. (4): Pg.1799-1804
Effect of Mixing Temperature on the Synthesis
of Hydroxyapatite by Sol-gel Method
TIKA PERMATA SARI, NOVESAR JAMARUN*, SYUKRI,
ZEFRI AZHARMAN and ASREGI ASRIL
Department of Chemistry, Andalas University, Padang, West Sumatera *Corresponding author E-mail: [email protected]
http://dx.doi.org/10.13005/ojc/300440
(Received: October 01, 2014; Accepted: November 20, 2014) ABSTRACT
In this work, hydroxyapatite was synthesized from limestone using the sol-gel method. Calcium carbonate (CaCO3) and diammonium hydrogen phosphate ((NH4)2HPO4) were used as calcium and phosphate source. The hydroxyapatite was obtained by mixing the precursors at a variaty of temperature 50, 60, 70, 80 and 90°C. The resulting product were characterized by XRD and SEM-EDX. From the XRD data it can be seen that all of the product produced at different mixing temperature is a family hydroxyapatite. The compound prepared at 70°C showed smaller crystal size compared the one synthesized at 50 and 90°C. It also can be seen for SEM picture that the resulty material was agglomerated and spherical shape.
Key word: Hydroxyapatite, Temperature, Sol-Gel, Limestone.
In this research, starting material used to form hydroxyapatite is limestone because its naturally abundant on earth crust. Synthesis of hydroxyapatite can be achieved by several methods such as sol-gel method4, hidrotermal5, prescipitated6, microwave7, and microemulsi8. Among the various methods, which are used in this study is the sol-gel method with several advantages such as increased homogeneity due to atomic level mixing, finer grain microstructure, lower temperature of crystallization, use of little equitment and cost-effectivenes.9 Precursors used are calcium nitrate (Ca(NO3)) and diammonium hydrogen phosphate ((NH4)2HPO4) using NH4OH as pH regulator.
EXPERIMENTAL Chemicals and Apparatus
Reagents grade chemicals such as limestone, nitiric acid (HNO3), ammonium hydroxide (NH4-OH), diammonium hydrogen phosphate ((NH4)2HPO4). Apparatus used in this study were thermometers, glassware, magnetic stirre and hot plate, analytical balance, Wattmann (42) filter paper, and pH meter.
Procedure
To synthesize hydroxyapatite powders via sol-gel processing, 5.6 grams of CaO were added to 100 ml of 1 M HNO3 and stirred (600 rpm, 1 hours , 65°C). Then, they were filtered and resulted Ca(NO3)2. Stoichiometric ammounts of calcium nitrate (Ca(NO3) and diammonium hydrogen phosphate were dissolved in two seperate aqueous solotions at room temperature. The pH of mixture was adjusted to 9 in ammonia solution then stirred
with temperature variation 50, 60, 70, 80 and 90°C for 5 hour. The formed sol was aging for 1 day to obtain a gel. Then filtered and dried at 105°C for 3 hours and calcined at 600°C for 5 hours. Product were characterized using XRD (Philips X’pert powder) to identify phase composition and crystallinity and SEM for surface morphology and particle size estimation.
RESULTS AND DISCUSSION X-ray diffraction (XRD)
XRD analysis was conducted to determine whether the hydroxyapatite crystals that are formed were amorphous, crystalline or polycrystalline. Analysis with XRD was depicted in Figure 1 showed for hydroxyapatite synthesized at different temperature.
From figure 1 it can be seen that a sharp peak with high intensity was at an angle = 32.0731 ° and 25.9168 ° in accordance with the standards of the ICSD no.26205 at 50 ° C were confirmed that compound product it was hydroxyapatite with miller indices hkl values (211) and (002). The the highest intensity at 70 °C was 25.8728 ° and 32.2243 ° with miller indices hkl values (211) and (002). It was confirmed that product was hydroxyapatite. XRD was also showed that the obtained hydroxyapatite was formed at 50, 70 and 90°C (amorf phase).
From the XRD spectrum, we knowed the size of crystal by using Scherrer equation, where a sharp peak with narrow peak width indicated that the large crystal size, whereas the width of the peak indicated a small crystal size. By measuring the
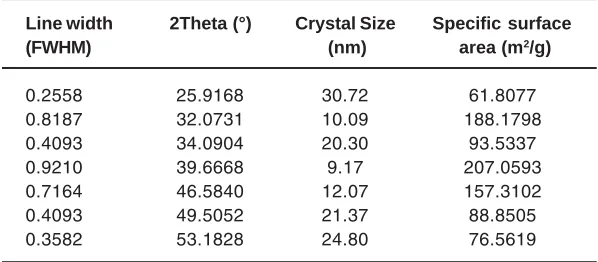
Table 1 : Crystal size of hydroxyapatite at 50° C
Line width 2Theta (°) Crystal Size Specific surface
(FWHM) (nm) area (m2/g)
0.2558 25.9168 30.72 61.8077
0.8187 32.0731 10.09 188.1798
0.4093 34.0904 20.30 93.5337
0.9210 39.6668 9.17 207.0593
0.7164 46.5840 12.07 157.3102
0.4093 49.5052 21.37 88.8505
Table 2 : Crystal size of hydroxyapatite at 70° C
Line width 2Theta (°) Ukuran kristal Specific surface
(FWHM) (nm) area (m2/g)
0.9446 25.8728 8.63 220.0155
0.9446 28.7647 8.68 220.7830
0.0900 32.2243 91.89 20.6631
0.9446 39.6516 8.94 212.3863
0.9446 44.0755 9.07 209.3422
0.8659 46.6432 9.99 190.0635
0.9446 49.5696 9.26 205.0468
0.8659 53.3282 11.49 165.2510
0.7872 63.8248 11.89 159.6917
0.8659 72.0091 11.34 167.4368
0.9446 77.8030 10.81 175.6461
0.9446 87.8018 11.67 162.7022
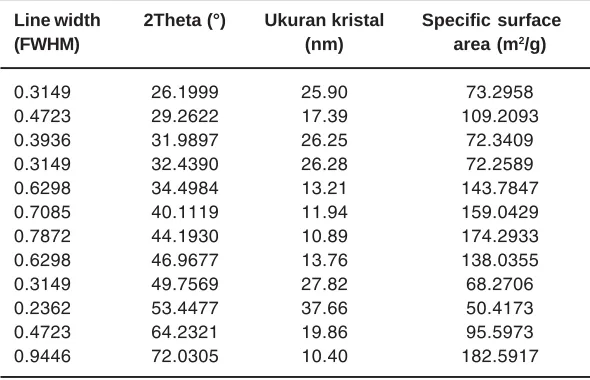
Table 3: Crystal size of hydroxyapatite at 90° C
Line width 2Theta (°) Ukuran kristal Specific surface
(FWHM) (nm) area (m2/g)
0.3149 26.1999 25.90 73.2958
0.4723 29.2622 17.39 109.2093
0.3936 31.9897 26.25 72.3409
0.3149 32.4390 26.28 72.2589
0.6298 34.4984 13.21 143.7847
0.7085 40.1119 11.94 159.0429
0.7872 44.1930 10.89 174.2933
0.6298 46.9677 13.76 138.0355
0.3149 49.7569 27.82 68.2706
0.2362 53.4477 37.66 50.4173
0.4723 64.2321 19.86 95.5973
0.9446 72.0305 10.40 182.5917
FWHM (Full Width at Maximum Hall) and the Scherrer equation, we can estimate the size of hydroxyapatite crystals. The following table 1 was the size of hydroxyapatite crystal data at temperature 50°C.
From table 1, we know the size of hydroxyapatite crystals were in range 9-30 nm with specific surface area produced ± 61-208 m2/g. XRD spectrum on hydroxyapatite at 50°C showed the highest intensity were at 2¸ = 25-32 ° angle.
The size of crystals at a temperature 70°C can be seen in the table 2. From the table 2 it could be seen that size of hydroxyapatite crystals were in range 8-11 nm and 91,89 nm at 32.2243°. The specific surface that was produced ± 162-220 m2/g. XRD spectrum hydroxyapatite at 70°C showed the highest intensity was 25-32°. For the size of the crystals formed was at a temperature of 90°C can be seen in table 3.
0 20 40 60 80 100
In
ten
s
it
as
a b c
2 theta
Fig. 1: X-ray diffraction pattern of hydroxyapatite were performed at a temperature of mixing (a).
50 ° C, (b) .70 ° C and (c) .90 ° C
Fig. 2: SEM hydroxyapatite at mixing temperature 50°C (a) 15000x, (b) 5000x. nm. The specific surface area are ± 50-182 m2/g.
XRD spectrum of hydroxyapatite at 90°C showed the hightest intensity at 2¸ = 26°-32° but, at 90°C, the peak shifted and based on ICSD 26205 standart XRD hydroxyapatite obtained at temperature mixing 50, 70 dan 90° C showed the compound was truly hydroxyapatite. Interestingly , at 70°C of temperature preparation, the size of the crystals were smaller than that the one and as the result is prepared at 50°C and 90°C, they were 8-11 nm.
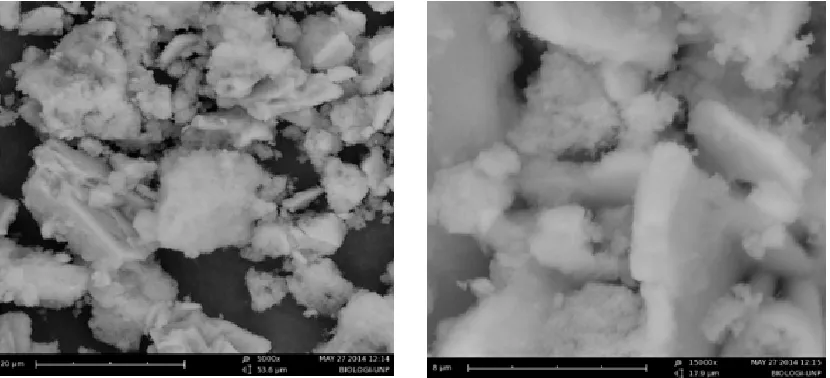
Scanning Electron Microscopy (SEM)
SEM analysis was performed to characterize the surface morphology of the sample. In principle, surface analysis involving surface radiation with enough energy to penetrate and caused some transitions that resulted the emission from beam energy surface.
For SEM characterization, we carried out the formation of hydroxyapatite at 50°C and 70° C. Figure 2 is SEM analysis results for the mixing temperature of 50°C.
From figure 2 it can be seen that for the formation of hydroxyapatite at 50°C, the formed particles are not distributed and homogeneous. In addition, the form of hydroxyapatite compound was less clear.
For SEM results at 70°C was showed in figure 3. From figure 3, can we know that formed hydroxyapatite particle consists of large particles and small particles. The particles that formed were spherical and have aglomeration. There is particles distribution on hydroxyapatite compound. By using SEM-EDS, we could see composition of hydroxyapatite compound. Figure 4 was SEM-EDS analysis result at 70°C.
Fig. 3: SEM of hydroxyapatite at the mixing temperature 70°C (a)5000x, (b) 15000x.
analysis result, we can conclude that the shape of hydroxyapatite prepared at 50°C was not clear, but at 70°C the hydroxyapatite that formed was spherical shape.
Unsur Persen Komposisi
O 65.2 %
Ca 21.6%
P 13.2%
ACKNOWLEDGMENTS
The authour would like to thank the analyst who has help in this research, friends in the Laboratory of Material Science Faculty of Andalas University for advice and another who helped this research.
REFERENCES 1. Sooksaen,P. Jumpanol,N. Crystallization of
Nano-Sized Hydroxyapatite via Wet Chemical Process Under Strong Alkaline Conditions. Science Journal. 2010. 1, 1, 20-27
2. N Montazeri, R Jahandideh, Esmaeil Biazar. Synthesis and characterization of hydroxyapatite calcium hydroxide for dental composite. Ceramic-silikaty. 2011. 55,.2,
123-126.
3. Prakash,O,; Iqbal,SA.; Jacob, G.; Orient. J. Chem. 2013, 29(3), 1079-1084.
Hoyos, Milton. An Unvestigation of the Synthesis Parameters of the Reaction of Hydroxyapatite Precipitation in Aqueous Media. International Journal of Chemical Reactor Engineerin. 2008
6. Shirley J.M. Duarte, Roseli M. Balestro, Solange F.Nascimento, Marize V.de, Oliveira, Magna M. Monteiro . Different routes for obtaining hydroxyapatite by sol-gel.
Congresso lationo americano de orgaaos artificials e biomaterials. 2012
7. Onur Rauf Bingol, Caner Durucan. Hydrothermal synthesis of hydroxyapatite from calcium sulfate hemihydrate. American Journal of Biomedical Sciences. 2011. 4, 50-59
8. S.N. Danilchenko, O. V. K., M.V. Pogorelov, A.N. Kalinkevich, A.M. Sklyar, T.G. Kalinichenko,, V.Y. Ilyashenko, V. V. S., V.I.
Bumeyster, V.Z. Sikora, L.F. Sukhodub, A.G. Mamalis,, & S.N. Lavrynenko, a. J. J. R. Chitosan–hydroxyapatite composite biomaterials made by a one step co-precipitation method: preparation, characterization and in vivo tests. Journal of bilogical physics and chemistry. 2009. 9, 119-126.
9. Samar J. Kalita, Saurabh Verma, Mate. Sci. and Eng. C, 2010, 30; 295-303
10. Palanivelu. R, A. Rubankumar. Synthesis and Spectroscopic Characterization of Hydroxyapatite by Sol-Gel Method.
International Journal of ChemTech Research. 2013. 5, 6, 2965-2969