Food Crops Planting Recommendation Using
Analytic Hierarchy Process (AHP) And Simple
Additive Weighting (SAW) Methods
Fiftin Noviyanto, Ali Tarmuji, Hendika HardiantoAbstract: Indonesia is known as an agrarian country because it has abundant natural wealth in the agricultural sector, and most of the population earns a living in agriculture. One type of plant that is available is one of the crops. Some food crops are rice, corn, soybeans, peanuts, cassava. To get quality crop yields, according to the environmental requirements, each type of food plant grows. This problem can solve by using two methods that support the decision of the Analytic Hierarchy Process (AHP) for the process of weighting criteria and Simple Additive Weighting (SAW) to rank each alternative. Based on the results of the experiment, the criteria used for the analysis of the priority level of consistency find consistent results that are sufficient to determine the best available value. Alternative ranking results can be used to help decision making.
Keywords: Agriculture, Food Crops, Planting Recommendation, Analytical Hierarchy Process (AHP), Simple Additive Weighting (SAW). —————————— ——————————
1
INTRODUCTION
Indonesia is known as an agricultural country because it has abundant natural resources in the agricultural sector plus most of the population earns a living in agriculture. However, there are many obstacles experienced by farmers, one of which is the decline in decent agricultural land as a result of growing urban and industrial growth [1]. In agriculture, there are many types of plants, one of which is food. Some food crops are rice, corn, soybeans, peanuts, cassava, wheat, potatoes, and many others. Each type of food plant has its criteria for growth. To get maximum crop yields, the environmental conditions must be by the requirements for growing each type of food crop. One of the conditions is to grow based on climate. Crop productivity depends on the ongoing climate. A common problem faced by most farmers is the lack of knowledge in determining the type of food crops that is appropriate to the climatic conditions. Climate is the state of the average weather in a certain period [2]. Farmers use the Java planting calendar. The determination of types of food plants follows the prey calendar. Not appropriate anymore because the current climate tends to be unpredictable [3]. The climate elements that have an influence on the growth of food crops include temperature (° C), air humidity (%), light intensity (W / m2), and rainfall (mm3) [4]. With its simplicity, ease of application, and high flexibility, the Analytic Hierarchy Process (AHP) has been widely studied and use in almost every application related to Multi-Criteria Decision Making (MCDM) [5]. AHP is a measurement method that is obtained through pairwise comparisons and relies on expert judgment to determine the priority scale of each criterion [6]. To test the quality of expert input a consistency test is needed [7]. The use of AHP in determining automotive accessory suppliers always gets a consistency ratio of less than 10%.
Therefore AHP is more strongly used for decision support systems [7]. The Additive Weighting (SAW) method is often known as the weighted sum method. The basic concept of SAW was first introduced by Fishburn (1967), by finding the weighted sum of the performance ratings for each alternative on all attributes. Evaluation results calculated for each alternative by multiplying the scale value given to the attribute by the weight given by the decision-maker, then adding up the product for all criteria [8]. The ability of SAW to predict floods is very strong, with an AUC score of more than 0.95 [9]. SAW can assist managers in making decisions more quickly and accurately to provide salary increases to employees [10]. Besides the selection of the project manager can also use SAW [11]. Apart from that SAW can also be applied to search for members of a company or group [12] [13]. In this study trying to combine the AHP and SAW methods to provide recommendations for types of food plants to be planted based on weather conditions at the time according to the requirements for growing plants from the Agricultural Research and Development Agency. In the research application, Recommendations on Types of Food Plants Using SAW obtained an accuracy value of 73.3% [14]. The merger of AHP and SAW was carried out by Cahyapratama (2018) for the selection of singers and obtained an accuracy of 83.3% [15]. Febrianti (2018) SPK Recommendations for Granting Credit obtained an accuracy of 89% [16]. Based on previous research AHP and SAW obtained good performance. For this reason, this research tries to provide food crop recommendations based on the average weather per month for the last ten years, namely 2009 to 2018, obtained from the Meteorology, Climatology and Geophysics Agency (BMKG) by the requirements for growing each food crop.
2
RESEARCH
METHOD
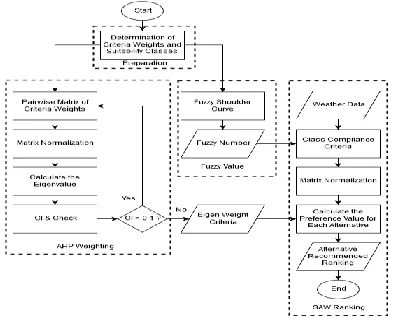
Based on the problem described in the previous paragraph, there are several methods that can be used and combined in solving problems, one of which is the decision-making method that is Multi-Attribute Decision Making (MADM) using. Analytic Hierarchy Process (AHP) and Simple Additive Weighting (SAW). AHP use as a weight counter for each criterion. Whereas SAW use as a ranking process.
————————————————
• Fifitin Noviyanto is a Lecturer in Informatic Engineering in
Universitas Ahmad Dahlan, Indonesia. E-mail:
• Ali Tarmuji is a Lecturer in Informatic Engineering in Universitas Ahmad Dahlan, Indonesia. E-mail: [email protected] (Corresponding Author)
Fig. 1. Research Stages 2.1 Rules Table
Each food crop has different growth requirements. The Agricultural Research and Development Agency published the conditions for growing plants, which became the reference in this study. Plant growth requirements in Table 1 [17].
TABLE1
REQUIREMENT FOR GROWING FOOD CROPS
Corn S1 S2 S3 N
Temperature 20-26 26-30 16-20, 30-32 < 16, > 32
Humidity > 42 36-42 30-36 < 30
Rainfall 900-1200 1200-1600,
500-900
>1600,
300-500 < 300
Soybean S1 S2 S3 N
Temperature 23-25 20-23,
25-28
18-20,
28-32 < 18, > 32
Humidity 24-80 20-24,
80-85 < 20, > 85 -
Rainfall 350-1100 250-350,
1100-1600
180-250, 1600-1900
< 180, > 1900
Peanut S1 S2 S3 N
Temperature 25-27 20-25,27-30 18-20,30-34 < 18, > 34
Humidity 50-80 < 80, < 50 < 80, < 50 -
Rainfall 400-1100 1100-1600, 300-400 1600-1900, 200-300 > 1900, < 200
Cassava S1 S2 S3 N
Temperature 22-28 28-30 18-20,
30-35 < 18, > 35
Humidity < 75 75-85 > 85
Rainfall 1000-2000 600 - 1000,
2000-3000
500 - 600, 3000-4000
< 500, > 4000
2.2 Data Usage
In this study using a combination of AHP and SAW to provide food crops recommendations for farmers. Alternative food crop commodities are rice, corn, soybeans, peanuts, and cassava. There are three criteria on Table 2 that are considered to determine the type of plan.
TABLE2
CRITERIA DETERMINATION TABLE
Criteria Label
Rainfall C1
Temperature C2
Humidity C3
Each criterion has a different weight, and the weight will be calculated using the AHP method to obtain the eigenvalue and consistency which will be the weight in the SAW calculation.
TABLE3
CRITERIA WEIGHTS TABLE
The weight values are given by experts from the Yogyakarta Provincial Agricultural Service. This study tested using Sleman Regency weather data for the past ten years, from 2009 to 2018. The data can be view in Table 4.
TABLE4
RSLEMAN REGENCY WEATHER DATA 2009-2018
Time
Cuaca
Curah Hujan Suhu Kelembapan
Jan-2009 171 26.2 80
Feb-2009 355 25.7 83
Mar-2009 387 26.7 78
Apr-2009 246 27.3 77
May-2009 112 26.8 78
Jun-2009 2 26.6 73
Jul-2009 0 25.2 70
Aug-2009 0 25.4 68
Sep-2009 3 26.8 66
Oct-2009 257 27.8 67
Dec-2018 603 26.5 86.5
To obtain crop yields every month, use the average monthly data for these ten years. Then the calculation is done using the SAW method. While the average data obtained every month for the past ten years.
Paddy S1 S2 S3 N
Temperature 24-29 22-24,
29-32
18-22, 32-35
< 18, > 35
Humidity 33-90 30-33 < 30, > 90 -
Rainfall 1500-2000 - - -
Label Criteria Weight
C1 5
C2 3
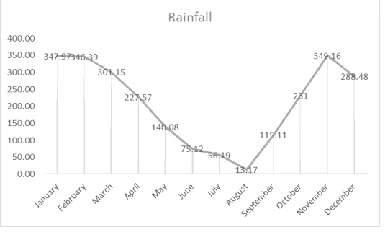
Fig. 2. Average Monthly Rainfall
Figure 2 data on average monthly rainfall for the last ten years, 2009-2018.
Fig. 3. Average Monthly Temperature
Figure 3 data on average monthly temperature for the last ten years, 2009-2018.
Fig. 4. Average Monthly Humidity
Figure 4 data on average humidity for the last ten years, 2009-2018.
2.3 Multi-Atribut Decision Making
In this paper, we define the concept of the ranking range of an alternative in MADM and propose a series of linear 0-1 linear programming models (MLPM) to demonstrate the process of designing the strategic attributes of a weight vector [18]. The determination of fuzzy numbers obtained from the priority value based on a Likert scale whose contents are the level of
importance for each criterion, where the numbers are close to number 1. The higher the level of dependency. Conversely, if
the number approaches 0, the dependency level gets lower. At this weight there are four fuzzy numbers, as in Figure 5.
S1: very suitable S2: suitable S3: suitable limits N: not suitable
Fig. 5. Fuzzy set of conformity values
The area which is located in the middle of a variable which is represented in the form of a triangle, on the right and left side will go up and down. But sometimes one side of the variable will change. Fuzzy shoulder set, to end a variable in a fuzzy region [19].
2.4 Analytic Hierarchy Process
AHP is a multiple objective decision method and multiple criteria, which can further analyze the nature, influencing factors, and internal relations of a confusing decision problem, using a small amount of quantitative information to make the thought process of a mathematical decision, so as to provide a suitable method for the problem complex decisions with several goals, several criteria or no structure [20].
1. Determine the criteria weights by comparing each criteria in pairs. For various problems, a scale of 1 to 9 is the best scale in qualifying criteria [21]. This scale is used to assess the relative importance of the assessment theme, as shown in Table 5 [22].
TABLE5
COMPARASION MATRIX SCALE
Intensity of
Interest Definition Explanation
1 Equally important. Two criteria contribute equally to the goal
3 A little more
important
The assessment is slightly in favor of one element
5 More important Assessment is very favorable for
one element
7 Very important
Evidence that one element is very influential and its dominance is clear
9 Absolute more
important
Evidence that one of the more important elements of her partner is very clear
2, 4, 6, 8
The middle value of the assessment above
Values is given if there is a doubt between the two choices
matrices.
(1)
3. Normalize the pairwise comparison matrix by adding up the values for each column of the same pair of matrices. Then divide each value from the column by the number of columns corresponding to the column
(2)
4. Calculate the normalized Vector Eigen by add up each row then divide by the number of criteria.
(3)
5. Calculate the consistency ratio to find out whether the comparative assessment criteria are consistent.
a. Determine the maximum eigenvalue
(4)
b. Calculates the CI consistency index
(5)
c. Consistency Ratio
(6)
If the results of CI = 0, then A is consistent, if then A is sufficiently consistent and if then A is very inconsistent.
The random index is the mean value of CI chosen randomly in A and given as follows
TABLE6
INDEX RANDOM CONSISTENCY
n 2 3 4 5 6 7
0 0.58 0.9 1.12 1.24 1.32
2.5 Simple Additive Weighting
SAW is one of the techniques most often used to solve the problem of spatial decision analysis. Decision-makers directly give relatively important weights to each attribute. A total score then obtained for each alternative (crop) by multiplying the importance weight assigned to each attribute by the scale value given to the alternatives for that attribute and adding up the product above all the attributes. Normal values for positive criteria calculated as follows [1]:
If j is a benefit attribute
(7)
If j is the cost attribute
(8)
Where r_ij is the normalized performance rating of alternative
A_i on the attribute C_j: i = 1,2, .., n. Preference values for each alternative (V_i) are as follows [19]:
(9)
3
RESULT
AND
DISCUSSIONECTIONS
3.1 Determine Conformity Rating
Determine the suitability rating of weather data every month with the criteria of each food crop in the suitability class obtained from the weighting of fuzzy and produce a value in which will be converted into fuzzy numbers according to the criteria class of each food crop as follows.
1) Data
For example, using weather data in January.
TABLE7
DATA SAMPLE
Month
Weather
Rainfall Humidity Temperature
January 347.97 23.97 76.57
2) Conformance Rating
Obtained from matching the value of the criteria with the value of each suitability class for growing conditions.
TABLE8
CONFORMANCE RATING WITH GROWTH REQUIREMENTS
C1 C2 C3
A1 Not Appropriate Appropriate Very Appropriate
A2 Appropriate
Limits Very Appropriate Very Appropriate
A3 Appropriate
Enough Very Appropriate Very Appropriate
A4 Appropriate Appropriate
Enough Very Appropriate A5 Not Appropriate Very Appropriate Appropriate
TABLE9
TRANSFORMATION OF CONFORMITY RATINGS INTO FUZZY NUMBERS
C1 C2 C3
A1 0.25 0.75 1
A2 0.5 1 1
A3 0.75 1 1
A4 0.75 0.75 1
A5 0.25 1 0.75
3.2 Weighting Criteria with AHP
AHP is used to find the value of criteria weights based on the eigenvalue that has passed the consistency test.
TABLE10 PAIRED MATRIX
Criteria Rainfall Humidity Temperature
Rainfall 1 3 5
Temperature 0,3 1 2
Humidity 0,2 0,5 1
Amount 1,5 4,5 8
2) Normalization of Paired Matrix
Paired matrix normalization is to add each column of criteria to the paired matrix-matrix to then divide each matrix-matrix comparison value by the number of each column of criteria. Based on the pairwise comparison matrix shown in Table 9.
The calculation example above yields a normalized return for the first column of the first row and the first column of the second row of the paired comparison matrix. The following normalization values shown in table 10. make sure the total criteria for the column is 1 according to equation (3).
TABLE11
NORMALIZED RESULT MATRIX
Criteria Rainfall Temperature Humidity
Rainfall 0.67 0.67 0.63
Temperature 0.2 0.22 0.25
Humidity 0.13 0.11 0.12
Amount 1.00 1.00 1.00
3) Calculate the average value of each row from each criterion according to equation (3) to obtain a weight vector that will be use for CI and CR testing.
TABLE6
INDEX RANDOM CONSISTENCY
Criteria C1 C2 C3 Amount Average
C1 0.67 0.67 0.63 1.97 0.66
C2 0.20 0.22 0.25 0.67 0.22
C3 0.13 0.11 0.13 0.37 0.12
4) Calculate consistency ratios to find out whether the comparative assessment criteria are consistent Determine the maximum eigenvalue
Obtained by adding up the product of the number of columns of the Pairwise Comparison matrix
to decimal form with normalized eigenvector vector. Determine the maximum eigenvalue obtained by adding up the product of the number of columns of Pairwise Comparison matrix to decimal form with normalized eigenvector vector.
Calculate the Consistency index of the equation with (5)
• The final process in applying the AHP method is to calculate the CR value using equation (6). The IR value used in this process obtained from the Random Consistency Index. By looking at the number of criteria that there are three criteria, the IR value used is 0.58. The process of calculating CR values is as:
From the results of calculations that have done, obtain a value, or from these results it can be concluded that the pairwise value comparison criteria weights can be use consistently.
3.3 Ranking Recommendations With SAW
1) After passing the class matching stage, a decision matrix obtained as follows
2) Then normalize the X matrix based on the equation (7)
So the R normalized matrix is obtained as follows:
3) The ranking process is obtained based on equation (9) where the weight value (W) obtained from the eigenvalues of the AHP weighting results in the previous stage.
This process is multiplying the criteria weight matrix w with the normalized matrix R.
4 CONCLUSION
Food crop ranking recommendations are obtained based on the conditions of growing plants. Soybeans get the highest weight ranking each month, indicating the weather in Sleman Regency is ideal for planting soybeans. In the dry season, it characterized by low rainfall in Sleman Regency. Rice, corn, and cassava obtain the highest weight values compared to months with high rainfall. Peanuts get a stable weighting value every month. This study uses the SAW method by using Sleman Regency weather data. In the field of agriculture, especially food crops, play an important role in meeting daily food needs in Indonesia. Rice is a staple food for most Indonesian people. Therefore, in providing food crop recommendations for Farmers, it is necessary to pay attention to various aspects. One of the most important aspects is the condition of the soil. The main function of the soil as a medium for plant growth [23], which provides mechanical support for plants to meet the needs of plants to be able to grow, such as water and nutrients [24]. Weather prediction to determine the planting calendar can help in maximizing agricultural yields [25]. In subsequent studies can integrate various aspects to produce a complex system so that the results of the recommendations given.
5
ACKNOWLEDGMENT
The research funded by Institute for Research and Community Service (LPPM) Universitas Ahmad Dahlan Yogyakarta with the Competitive Grant Research scheme (PHB) in 2019.
REFERENCES
[1] J. Seyedmohammadi, F. Sarmadian, A. A. Jafarzadeh, M. A. Ghorbani, and F. Shahbazi, ―Application of SAW, TOPSIS and fuzzy TOPSIS models in cultivation priority planning for maize, rapeseed and soybean crops,‖ Geoderma, vol. 310, no. November 2016, pp. 178–190, 2018.
[2] S. Lovejoy, ―What Is Climate,‖ Am. Geophys. Union, vol. 94, no. 1, pp. 1–16, 2013.
[3] T. Setiadi, A. Tarmuji, B. Suhendra, F. Noviyanto, and S. L. Khasbullah, ―Planting time determination for food crops using decision tree,‖ IOP Conf. Ser. Mater. Sci. Eng., vol. 403, no. 1, 2018.
[4] D. Heksaputra, Y. Azani, Z. Naimah, T. Informatika, and
T. Industri, ―Penentuan Pengaruh Iklim Terhadap Pertumbuhan Tanaman dengan Naïve Bayes Lizda Iswari,‖ Semin. Nas. Apl. Teknol. Inf., pp. 34–36, 2013. [5] W. Ho and X. Ma, ―The state-of-the-art integrations and
applications of the analytic hierarchy process,‖ Eur. J. Oper. Res., vol. 267, no. 2, pp. 399–414, 2018.
[6] T. L. Saaty, ―Decision making with the analytic hierarchy process,‖ Int. J. Serv. Sci., vol. 1, no. 1, pp. 83–98, 2008. [7] V. Jain, A. K. Sangaiah, S. Sakhuja, N. Thoduka, and R.
Aggarwal, ―Supplier selection using fuzzy AHP and TOPSIS: a case study in the Indian automotive industry,‖ Neural Comput. Appl., vol. 29, no. 7, pp. 555–564, 2018. [8] H. R. Pourkhabbaz, S. Javanmardi, and H. A. Faraji
Sabokbar, ―Suitability analysis for determining potential agricultural land use by the multi-criteria decision making models SAW and VIKOR-AHP (case study: Takestan-Qazvin plain),‖ J. Agric. Sci. Technol., vol. 16, no. 5, pp. 1005–1016, 2014.
[9] K. Khosravi et al., ―A comparative assessment of flood susceptibility modeling using Multi-Criteria Decision-Making Analysis and Machine Learning Methods,‖ J. Hydrol., vol. 573, pp. 311–323, 2019.
[10] S. H. Sahir, R. Rosmawati, and K. Minan, ―Simple Additive Weighting Method to Determining Employee Salary Increase Rate,‖ Ijsrst, vol. 3, no. 8, pp. 42–48, 2017.
[11] A. R. Afshari, R. Yusuff, and A. R. Derayatifar, ―Project manager selection by using fuzzy simple additive weighting method,‖ ICIMTR 2012 - 2012 Int. Conf. Innov. Manag. Technol. Res., pp. 412–416, 2012.
[12] H. Adela, K. Azmi Jasmi, B. Basiron, M. Huda, and A. Maseleno, ―Selection of dancer member using simple additive weighting,‖ Int. J. Eng. Technol., vol. 7, no. 3, p. 1096, 2018.
[13] A. Afshari, M. Mojahed, and R. Yusuff, ―Simple additive weighting approach to personnel selection problem,‖ Int. J. Innov. Manag. Technol., vol. 1, no. 5, pp. 511–515, 2010.
[14] Y. Yanuari, M. G. Husada, and D. B. Utami, ―Aplikasi Rekomendasi Jenis Tanaman Pangan Menggunakan Metode Simple Additive Weighting (SAW,‖ JOINTECS (Journal Inf. Technol. Comput. Sci., vol. 3, no. 1, 2018. [15] A. Cahyapratama and R. Sarno, ―Application of Analytic
Hierarchy Process (AHP) and Simple Additive Weighting (SAW) methods in singer selection process,‖ 2018 Int. Conf. Inf. Commun. Technol. ICOIACT 2018, vol. 2018-Janua, no. Mcdm, pp. 234–239, 2018.
[16] S. R. Febrianti, N. Hidayat, and Suprapto, ―Sistem Pendukung Keputusan Rekomendasi Pemberian Usaha Kredit Mikro (UKM) dengan Metode AHP-SAW (Study Kasus: PD. BPR Bojonegoro),‖ J. Pengemb. Teknol. Inf. dan Ilmu Komput. Univ. Brawijaya, vol. 2, no. 8, pp. 2620–2627, 2018.
[17] S. Ritung, K. Nugroho, A. Mulyani, and E. Suryani, Petunjuk Teknis Evaluasi Lahan untuk Komoditas Pertanian (Edisi Revisi). Bogor, 2011.
[18] Y. Dong, Y. Liu, H. Liang, F. Chiclana, and E. Herrera-Viedma, ―Strategic weight manipulation in multiple attribute decision making,‖ Omega (United Kingdom), vol. 75, pp. 1339–1351, 2018.
[20] L. Yu, ―Research on evaluation index of green campus based on AHP method,‖ Proc. - 2016 Int. Conf. Intell. Transp. Big Data Smart City, ICITBS 2016, pp. 249–252, 2017.
[21] T. L. Saaty, ―The analytic hierarchy and analytic network processes for the measurement of intangible criteria and for decision-making,‖ Int. Ser. Oper. Res. Manag. Sci., vol. 233, pp. 363–419, 2016.
[22] S. N. Kamaruzzaman, E. C. W. Lou, P. F. Wong, R. Wood, and A. I. Che-Ani, ―Developing weighting system for refurbishment building assessment scheme in Malaysia through analytic hierarchy process (AHP) approach,‖ Energy Policy, vol. 112, no. October 2017, pp. 280–290, 2018.
[23] J. E. Russell, Soil conditions and plants growth. Daya Books, 2002.
[24] J. Glinski and J. Lipiec, Soil physical conditions and plant roots. 2018.