On the quadrant analysis of the flow in the street canyon
R. Kellnerov´a1,2,a, V. Fuka1, L. Kukaˇcka1,2, V. Uruba2, and Z. Jaˇnour2
1 Charles University in Prague, Faculty of Mathematics and Physics, The Department of Meteorology and Environment
Protection, Czech Republic
2 Institute of Thermomechanics Academy of Sciences of the Czech Republic, v.v.i, Dolejˇskova 1402/5, Prague 182 00,
Czech Republic
Abstract. It is well known that sweep and ejection are major contributors to the momentum flux in the
turbu-lent boundary layer. In order to evaluate the contribution of these events to the total flux, the wind-tunnel data measured by PIV technique were analyzed from spatial point of view. It was revealed that both the sweep and the ejection reach up to 90% of the flux momentum inside the canyon. Moreover, the sweep and ejection pass the street in an alternative fashion. When sweep reaches maximum, the ejection falls down to minimum and vice versa. The TKE energy is also very high in these particular events, reaching 80-90% of total TKE inside the street what makes the sweep and ejection to be the most important features in the flow.
1 Introduction
Research on coherent structures suggests that compact and organized features exist inside the turbulent flow. However, the complexity of the flow makes it difficult to reveal these patterns. In the recent decade, the PIV results substantially have helped to analyze flow dynamics. Unfortunately, there is a number of ways how to detect a coherent structures but there has not been draft a conclusion yet which one is both universal and reliable one. In this paper, the data from experiment are analyzes by Quadrant analysis.
The quadrant analysis deals with instantaneous values of momentum flux. Based on the Reynolds decomposition, the stress is divided into four categories after [1].
Since it is a decomposition from temporal point of view, it can be easily applied to one-point time-series of simul-taneous measurement of two velocity components. From this reason, the method was frequently applied in the past. We applied the Reynolds decomposition to a 2-D ve-locity field inside the street canyon obtained by PIV. The flow generated by street canyon is very turbulent and ac-cording to [2], certain quadrant events called sweep and ejection should be predominant contributors to the momen-tum flux.
2 Experimental set-up
The turbulent boundary layer is generated in the wind-channel with a series of street canyons as a model. The canyons are identical, spanned from wall to wall and per-pendicular to the approach wind (see Figure 1). Channel has 25 cm x 25 cm in cross-section and about 3 m in longi-tudinal direction. The area of interest lies behind the 21th row from the channel entrance, in order to provide a suf-ficient fetch for development of well-established internal
a e-mail:[email protected]
boundary layer. Reference velocity measured on the chan-nel axis at the mouth of the developing section is 5 m.s−1.
Two geometries of roof are used - triangle and flat shape. Scale in which the model is manufactured is 1:400. There-fore, 50 mm high and wide street corresponds to 20 m large street canyon in full scale (Figure 2). The street aspect ra-tio equals to one what determines a skimmingregime of
the flow as concluded [3]. More detailed information about set-up could be found in [4].
Me //
//
2 000 mm
Measuring area
Laser
//
//
3000 mm
250mm
50
50
50
250mm
Fig. 1. Scheme of model of street canyons inside the channel.
Flow is coming from the left side. Green area denotes the sheet light of laser for PIV.
20
50 mm
50mm
50 mm
30
50 mm 50 mm
Fig. 2. Scheme of buildings with flat roof (upper) and pitched
roof (lower).
This is an Open Access article distributed under the terms of the Creative Commons Attribution License 2 0 , which . permits unrestricted use, distributi and reproduction in any medium, provided the original work is properly cited.
on, DOI: 10.1051/
C
Firstly we verified if the measuring position is placed in the proper location. By CTA hot-wire anemometry, we measured a mean velocity and fluctuations. Gold-plated probe (Dantec 55 P01) with dimension of 5µm x 1.25 mm measured vertical profile of longitudinal velocity with tem-poral resolution of 25 kHz. Acquisition time was 30 s. The vertical profiles of mean velocity were taken in four con-secutive canyons, the measurement position was placed in the inner one. The deviation from all four profiles does not exceed the 1.5%. This confirms the boundary layer above the position reaches the equilibrium state with the surface beneath. Also, the lateral symmetry was checked.
Then, particle Image Velocimetry (PIV) with relatively high repetition rate (500 Hz) was installed. As the output from PIV system, we got 2-D vectors of instantaneous ve-locity in vertical plane. One run of PIV measurement con-sists of 1600 snapshots, each of them with more than 4800 velocity vectors. The spatial resolution turns out to be 1.2 mm x 1.2 mm due to 50% of overlap. In following table, the parameters of PIV set-up are published.
Diode pumped Nd:YLF laser
Repetition rate 500 Hz
Repetition rate 1280 x 1024 pxs
Interrogation area 32 x 32 pxs
Overlapping 50% (80 x 64 vectors)
Energy 10 mJ
Area 100 x 100 mm
Acquisition time 3.2 s
Commercial software for PIV (DynamicStudio v3.00) was used to post-process of data. On the very beginning, for each ensemble of snapshots from one run of measure-ment, we subtracted an image mean from each individual images. Then we applied adaptive correlation, what is spa-tial correlation in specific interrogation area, and carried out the vector field. Term ’adaptive’ herein refers to a di-mension of interrogation area, which becomes smaller and smaller step-by-step until its final size is reached.
Several validation schemes filtered out the most strik-ing spurious vectors and Movstrik-ing average validation have replaced them by a reasonable estimation. Flow was filled by oily tracer particle with mean radius of 1µm.
Fortu-nately, due to a high level of turbulence, oil droplets were distributed evenly in the space. This allows the fast CCD camera to shoot a nice quality images with conveniently low number of wrong vectors.
After filtering and interpolating process, the time-series of wind speed in each location are extracted. The time-mean momentum flux from the center of the canyon is plot-ted in Figure 3. For both building arrangements, the peak reaches the maximum approximately at roof-top level. In the pitched case, the peak is localized slightly higher and exhibits double value than in the flat case. Also, the ver-tical layer of enhanced flux is significantly wider in the pitched case. The vertical variation of pitched roofs appar-ently produces a higher level of turbulence intensity and the turbulence occupies a larger area - generates a wider shear layer.
<u’w’>/Uref2
Z
/H
[-]
-0.01 -0.005 0 0.005
0 0.5 1
Channel - Pitched roof Channel - Flat roof
Roof level
Fig. 3. Momentum flux in the center of street canyon with
pitched and flat shape of roofs.
2.1 Quadrant analysis
The analysis is based on Reynolds decomposition, which decomposes the instantaneous velocity value into time-mean value U and fluctuating term u0. The momentum flux u0w0 is then divided into four quadrants according to scheme:
– u0>0, w0>0 1. quadrant - outward interaction
– u0>0, w0<0 2. quadrant - sweep
– u0<0, w0<0 3. quadrant - inward interaction
– u0<0, w0>0 4. quadrant - ejection.
The partial contribution from i-th quadrant to the to-tal momentum flux<u0w0 >is obtained from formula of weighted average:
τi=
<u0w0>i.Ni
Ntotal
where<u0w0>imeans averaged flux within the i-th quad-rant, Niis the number of events belonging to the i-th
quad-rant and Ntotalis the global number of events recorded
dur-ing time period .
Simply said, sweep transports the momentum from the faster free stream downwards. Considering the street canyon with vehicle traffic at the street level, sweep events brings relatively clear air from an up-roof area and then penetrates downwards into canyon. The ejection represents the slow, upward motion. In other words, ejection is responsible for transports of the heat, pollution or other scalar from the lower level upwards. These quadrants events strongly con-tribute to the so-called turbulent scalar fluxes ([5]).
−0.50 −0.4 −0.3 −0.2 −0.1 0 0.1 0.2 0.2
0.4 0.6 0.8 1 1.2 1.4 1.6
<u’w’> [m2/s2]
Z/H [−]
Mometum flux from quadrant events in the street canyon with pitched roof
Sweep Ejection Inward Outward Roof level
Fig. 4. Contribution from the particular quadrants to the
momentum flux for pitched roof case.
Up to a certain elevation, the time-averaged sweep is consistently larger than the time-averaged ejection, how-ever above this level, ejection dominates. We can also de-fine a propertyδS via substraction of the ejection from the
sweep.δS brings an information about prevailing
momen-tum flux in the region.
δS =τsweep−τe jection.
If we evaluate the momentum flux belonging to the each quadrant separately and display its spatial distribu-tion inside the street canyon, we will find out that only the results from sweep and ejection are interesting. The sweep and ejection events often travel in a compact shape across the street canyon. For better demonstration of this phenomena, it is convenient to display the differenceδS .
The following figures show the example of strong sweep (figures 5 - left) and ejection events (figures 6 - right). The negative (orange) values label the region where sweep is stronger than ejection whereas the positive (green) values symbolized the dominance of ejection.
The calculation of the relative spatially cumulative con-tribution from the event to the total momentum flux in ev-ery snapshot reveals, that sweep and ejection occasionally represent up to 80%-90% of the total momentum flux (see Figure 10). The negative value in Figure 10 of percent-age is caused by negative sign of both the sweep and the ejection partial momentum flux. The inward and outward interaction have positive sign (check 4).
The before-mentioned conclusion is valid for both the arrangements - pitched and flat. This is surprising, because pitched roof produce much more violent flow. The ventila-tion inside the canyon is often disturbed, whereas the flat case generates relatively smooth flow where ventilation is much stable.
There is also clear tendency for both events to pass the street canyon in alternating fashion. Indeed, the mu-tual correlation coefficient between relative contributions of sweep and ejection is -0.9. If the sweep comes into canyon, the ejection is suppressed and vice versa.
X/H
Z
/H
-1 -0.5 0 0.5 1
0 0.5 1 1.5
Delta S 0.1 0.08 0.06 0.04 0.02 0 -0.02 -0.04 -0.06 -0.08 -0.1 Sweep Events
Fig. 5. The dominance of sweep fraction of the momentum flux.
X/H
Z
/H
-1 -0.5 0 0.5 1
0 0.5 1 1.5
Delta S 0.1 0.08 0.06 0.04 0.02 0 -0.02 -0.04 -0.06 -0.08 -0.1 Ejection Events
Fig. 6. The dominance of ejection fraction of the momentum
flux.
Notwithstanding, the outward and inward interaction rarely contain 40% of momentum flux and do not exhibit any mutual correlation, their correlation coefficient is only -0.16.
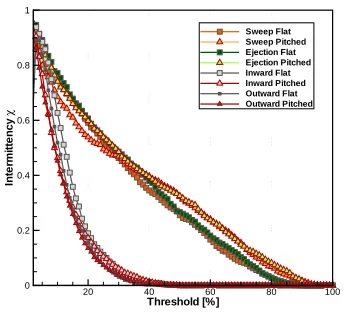
When defining threshold of 40% in relative contribu-tion, which clearly determines the exclusivity of the sweep or ejection presence in the canyon, the intermittency factor, based on the definition in [6], is 0.4 for both the sweep and ejection (see table below). So together they cover 80% of the record time. If the prevailing wind in full scale reaches 5 m.s−1, these events would last typically for about 10 s and their scale would be around 30 m. In the model scale it corresponds to 70-80 mm around 50 mm large buildings.
Threshold 40% Outward Sweep Inward Ejection
Intermittency 0.01 0.40 0.01 0.39
With increasing the threshold, the less and less inter-mittency is obtained. In the flat case, the interinter-mittency falls down a little bit more quickly. So, there is another small distinction between flow generated by flat and pitched roof geometries.
Threshold [%]
In
te
rm
it
te
n
c
y
χ
20 40 60 80 100
0 0.2 0.4 0.6 0.8 1
Sweep Flat Sweep Pitched Ejection Flat Ejection Pitched Inward Flat Inward Pitched Outward Flat Outward Pitched
Fig. 7. Intermittency factor as a function of threshold in
percentage of contribution to the total momentum flux from quadrant events.
From Figure 11 is apparent that most of the sweep and ejection happens above the roof. When returning back to the picture of momentum contribution, we added a thicker line representing the contribution coming from the region above the roof (Figure 11). Thin line stays for the previous total momentum flux in the whole canyon.
We can conclude that majority of these specific fluctu-ating motions, almost 90% of the flux, takes place above roof. The explanation is simple, the longitudinal velocity above the roof is much faster and so the fluctuations vary strongly in magnitude. Deeper, between the building walls, the flow strongly decelerates and velocity of fluctuations decreases as well in term of magnitude. Only the ratio of the fluctuation to the mean velocity significantly increases what causes a high value of turbulence intensity thanks to its definition in [7].
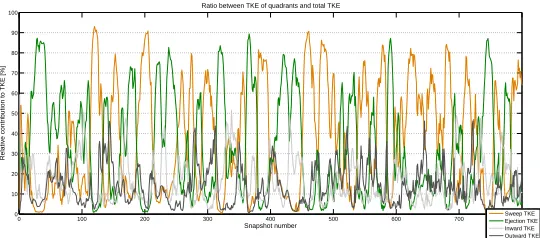
Regarding the turbulent kinetic energy, the sweep and ejection are extremely dominant, they contain 80-90% of total TKE in the canyon (Figure 12). Again, the percentage is the same for flat and pitched case.
However, the inspection of the typical picture of the flow dynamics between the roofs reveals that associating dynamical patterns are completely different. While only a small vortices travel almost exclusively at the roof-top level in the flat case (Figure 8), the deformation of the flow field and scale of the patterns themselves is much larger in the pitched case (Figure 9). We can draft a conclusion that bigger flow structures induce bigger interactions between the free stream and the street canyon. The vertical variabil-ity of the pitched roof acts in the same way as a group of buildings with various heights. Both built-up areas would generate a higher momentum and intensive scalar flux.
3 Conclusions
The Quadrant analysis was applied to the data from very turbulent flow inside the street canyon with two different
X/H
Z
/H
-1 -0.5 0 0.5 1
0 0.5 1 1.5
Delta S 0.1 0.08 0.06 0.04 0.02 0 -0.02 -0.04 -0.06 -0.08 -0.1 Sweep and Ejection events
Fig. 8. Typical pattern in the flow over the flat roofs with
emphasized sweep and ejection features.
X/H
Z
/H
-1 -0.5 0 0.5 1
0 0.5 1 1.5
Delta S 0.1 0.08 0.06 0.04 0.02 0 -0.02 -0.04 -0.06 -0.08 -0.1 Sweep and Ejection Events
Fig. 9. Typical pattern in the flow over the pitched roofs with
emphasized sweep and ejection features.
shapes of roof. It was confirmed that both the sweep and the ejection represent definitively the most important frac-tions of the momentum flux. When considering relative contribution to the total momentum flux inside the street from spatial point of view, both the sweep and ejection contribute by 80-90%. Although, in absolute numbers, the peak of momentum flux localized at the pitched roof-top level is double than the one at flat roof-top level, the rela-tive contribution is the same. The sweep and ejection also contain a majority of TKE - up to 80-90%. However, the spatial extents of shear layers distinguish from each other and the structures of the feature are completely different.
Acknowledgement
References
1. W.W. Willmarth, S.S. Lu, Journal of Fluid Mechanics, 55, 65 (1972)
2. W. Zhu, Ph.D. thesis, The Johns Hopkins University (2006) 3. T.R. Oke, Boundary Layer Climates (Routledge, London,
1987)
4. R. Kellnerova, L. Kukacka, K. Jurcakova, V. Uruba, Z. Janour, Journal of Wind Eengineering and Industrial Aerodynamics
104, 302 (2012)
5. L. Kukacka, S. Nosek, R. Kellnerova, K. Jurcakova, Z. Janour, Scientific World Journal (2012)
6. S. Pope, Turbulent Flows, (Cambridge University Press, New York, 2000)
7. VDI, Physical modelling of flow and dispersion processes in the atmospheric boundary layer - aplication of wind tunnels, Beuth Verlag, Berlin (2000)
0 100 200 300 400 500 600 700 800 −100
−80 −60 −40 −20 0 20 40 60
Snapshot number
Relative contribution [%]
Relative contribution from individual quadrant events to the sum of absolute momentum flux
Sweep Ejection Inward Outward
Fig. 10. The time evolution of the relative contributions to the
absolute total momentum flux - pitched case.
0 100 200 300 400 500 600 700 800 0
10 20 30 40 50 60 70 80 90 100
Snapshot number
Relative contribution [%]
Relative contribution of sweep−ejection events to the sum of absolute momentum flux Sweep − above roof Ejection − above roof Sweep − whole canyon Ejection − whole canyon
Fig. 11. The time evolution of the relative contributions from
sweep and ejection in the region above the roof (thick line) and from the whole street canyon (thin line) - pitched case.
0 100 200 300 400 500 600 700 800
0 10 20 30 40 50 60 70 80 90 100
Snapshot number
Relative contribution to TKE [%]
Ratio between TKE of quadrants and total TKE
Sweep TKE Ejection TKE Inward TKE Outward TKE
Fig. 12. The time evolution of the contributions from sweep and