© 2017 IJSRST | Volume 3 | Issue 4 | Print ISSN: 2395-6011 | Online ISSN: 2395-602X Themed Section: Science and Technology
Prediction of Student performance in Higher Education System using R
Programming
Neha Kawchale
Department of Computer Engineering, Savitribai Phule University, Pune, Maharashtra, India
ABSTRACT
This document Education plays a vital role in nation‘s overall development process. To be effective, analysis related to education sector must be done timely and cope with data scales. Now-a-days the biggest challenges that students face in higher education is predicting the right career paths. Institutions would like to know, which students will be industry ready (get job), who will enroll in which domain and which students will need more assistance in particular subject in terms of job opportunities. Also sometimes, management need more information about student like their result, about the success of new offered courses. Predictive analytics using the R programming language can help and improve the quality of education by analyzing the historical data of the student and allow the decision makers address factors such as unemployment, recommender systems for professional development and curriculum Development to reduce the gap between educational sector and industry requirement. This programming language provides software environment for statistical analysis, graphics representation and finally generates the report. This paper presents an analytical study of student progress report and help to plan accordingly to achieve success using R programming with the help of predictive modelling
.
Keywords: Academic analytics, C5.0 algorithm, Logistics regression model, Predictive analytics, R programming language.
I.
INTRODUCTION
Academic analytics is a new area that was introduced in higher education with quality higher education objective. It is a buzz word often used to describe the application of data mining technique to develop predictive model that can help monitor and anticipate student performance and take action in issues related to student teaching and learning. The results of student‘s academics can be used by various managerial levels of education system. While teachers can also use this information to predict their student‘s subject wise performance. The most striking features of data mining technique are clustering and prediction. The comprehensive characteristics analysis of students is done while clustering, the predicting function estimate the different types of outcomes like transferability persistence, retention and success in study and other extracurricular activities.
Broadly, there are three types of prediction: classification, regression, and density estimation. In classification, the predicted variable is a binary or categorical variable. Some popular classification methods include decision trees, logistic regression (for binary predictions), and support vector machines. In
regression, the output variable is a continuous variable. Some popular regression methods within educational data mining include linear regression, neural networks, and support vector machine regression. In density estimation, the output generated is a probability density function. Density estimators can be based on a variety of kernel functions, including Gaussian functions. For different type of prediction, the input parameters can be either categorical or continuous; different prediction methods are more effective, depending on the type of input variables used.
In process of prediction [1], the goal is to develop a model which will generate a single definite value of the data (predicted variable) from combination of other factors of the data which is given as the input (predictor variables). Prediction requires having labels for the output variable for data set, where a label represents some trusted ―ground truth‖ information about the output variable‘s value in specific cases.
skills, team work, leadership skills, etc. of a model are important for prediction which gives information about the underlying construct. In a second type of usage, prediction methods are used in order to predict what the output value would be when actual values are given such as academic score, IQ score, book critiques, number of International paper published by the students, etc.
The goals of predictive analytics are to produce relevant information, actionable insight, better outcomes, and smarter decisions, and to predict future events by analyzing the volume, veracity, velocity, variety, and value of large amounts of data.
Moreover, quality education [2] will be value-oriented and will provide an understanding of industry needs. Acquiring all these factors in the same place to effectively develop successful and goal-oriented education systems is a difficult task the following factors are considered.
1. Early Alert and Targeted Support Systems to Improve Student Persistence.
A common use of predictive analytics [10] in higher education is in the implementation of early alert systems that rely on data about student behaviour to identify students who will and will not get the job and to target interventions that assist them in completing their course and/or program of study. For example, Purdue University's Course Signals system predicts which students are at risk of performing poorly using data such as student demographics and academic history, engagement with online resources and current performance in a given course. Based on the prediction, students receive an indicator - red, yellow, or green light -that delivers instructor feedback to the students about their performance as well as steps to take next steps. As the report notes, by studying historical data, colleges can build profiles of students who are most at risk of not persisting and develop steps to intervene in a timely manner. However, when historical data are combined with data accessible after a student enrol, even more powerful predictions can be made about a student‘s likelihood of persisting. The following risk factors are most prevalent among at-risk students:
number of logins to the college‘s learning management system;
level of self-confidence (assessed with a diagnostic tool);
level of social integration to campus life (meeting with faculty outside of class,
studying with a mentor or other students;
club or student government membership, learning community participation);
study skills (time management, prioritization).
Identifying students at getting placed in good company with good salary is the first step in the process, but perhaps more important is the use of predictive analytics to identify and communicate the biggest contributors to this; in other words, to tell faculty and administrators why a student may be struggling in a class or program. The use of interactive [3], data visualization tools that identify the reasons why students may be at risk helps colleges develop targeted interventions to minimize that risk.
2. Predicting Student Outcomes.
Predictive analytics can be utilized to project enrolment and to identify who all can get placed in the company, it can also be used to predict student outcomes based on historical rates of student progress and success; the ethnic, socioeconomic, and academic composition of the student body; the availability of transfers lots at nearby four-year institutions and plus Postgraduate; the growth or decline of industries in which students are employed and the relative strength of the economy. Predicting student outcomes can help administrators set realistic, data-driven targets for improved graduation and transfer rates and educate legislators and the public [4] at large about the factors that may affect progress toward those goals.
3. Recommender Systems for Professional Development.
An effective recommender system for professional development would guide employees to skill building opportunities most suited to their needs and interests.
4. Student Placement Prediction.
students most. One of the more interesting potential applications of these findings would be the creation of an advising application that would allow high students, parents and/or counsellors to enter data points for an actual (or theoretical) student and receive a predicted placement and grade, given the data on the student‘s past performance and state of readiness.
5. Recruitment and Enrolment Management.
Predictive analytics can help community colleges and other institutions of higher education to statistically identify likely students based on a variety of factors, including geographic location, anticipated program of study, ethnicity, socio-economic status, grade point average(GPA). Predictive analytics can also help institutions identify and target marketing materials to specific colleges that yield high proportions of students most likely to enrol (or that the college would most like to target for enrolment).
6. Other Opportunities for Predictive Analytics.
Analytics [8] can also be used to assist in the scheduling of courses and classrooms. With the advent of long-term student education plans, a new data source has been created that could be harnessed for scenario planning of course schedules for future terms.
By analyzing current and historical facts to make predictions about the future, decision makers can take action and make decisions today to attain tomorrow‘s goals. Predictive analysis is one way to effectively address these issues. This can be performed using Logistics Regression model. It is a type of statistical classification model which is used to predict binary response. It measures the relationship between categorical dependent variable and one or more predictor variables. Here categorical variable might be binomial or multinomial. In case of binomial categorical variable, we have only two categories (that is ‗‘yes‘‘ and ‗‘no‘‘, ―good‖ and ‗‘bad‖). Where, in case of the multinomial categorical variable, we have more than two categories (that is ―average‖ and ―good‖ and ―best‖). Here, we will only focus on the binomial dependent variable.
II.
LITERATURE SURVEY
Predictive analytics is a valuable tool [2] with which engineer‘s positive change throughout the student life cycle. We did secondary research to find out the nature of companies visiting different educational institutions. We thought the difference in nature of companies visiting the different campuses is due to the different culture. Here, culture is nothing but the different kind of exposure students get which results in different set of capabilities being developed in individuals.
As per survey done for the IIT colleges in India, it has been observed that IIT Delhi attracts more kind of start-ups. IIT Mumbai attracts more of financial and consulting kind of companies while IIT Kharagpur & IIT Kanpur attracts more of R&D jobs. It has been observed that along with the academic performance the student at these institutions are proactive at other events such as sports, research and development, cultural events, technical events etc. But the level of exposure varies.
Predictive Analytics is useful is finding the students with weak performance beforehand and helping them achieve the desired skills and make them industry ready.
Also following are several crucial issues faced in education systems.
1. Drop-out rate [6] – Students now-a-days are unable to meet the scheduled plan for the academics which results in increased dropping out from the current academic years for example unable to clear the exam.
are not placed in company to improve their skills accordingly. This will analysis will definitely help College staff like Principal and teaching Professor as well as students to achieve the target.
III.
SYSTEM ARCHITECTURE
Following are the steps for analysis of the input data:
Step 1: Define Project: It is must and required step where we need to define the project outcomes, deliverables, scoping of the effort, business objectives, identify the data sets which are going to be used.
Project Outcome: To be able to know the capability of a student getting placed or not to as the enhance their skills.
Deliverables: Scorecard along with a categorical outcome.
Scope: Educational institutions.
Step 2: Data Collection: Data collection is the first and foremost step in the predictive analytics process. To plan for quality education, it is necessary that any analysis collect [5] huge amount of educational data and focus on gathering knowledge that can improve future prospects of student. Educational data combine offline data, online interaction data which can be structured and unstructured data. Offline data includes learner/educator information, students‘ attendance records, students‘ progress report. Online and interaction data would be distance and Web-based education, computer-supported collaborative learning, social networking sites and online group forums, email, chat transcripts, and so on. Collected data must be pre-processed—that is, cleaned, transformed and integrated.
We majorly looked at engineering institutions data. We collected the several attributes that decides the capability of a student to get placed. So we collected data related to academic scores, gender, geographic location, social culture, practical skills, industry-exposure, course curricular, leadership qualities, and team player. We plan to focus on such many more attributes in future work.
Step 3: Data Analysis: Data Analysis is the process of inspecting, cleaning, transforming and modelling data
with the objective of discovering useful information arriving at conclusions. After pre-processing the collected data, we used regression models, classification models, CART techniques and other predictive tools. We compared these techniques and observed that logistic regression is most suitable for the work.
Step 4: Statistics: Statistical Analysis enables to validate the assumptions, hypotheses and test them with using standard statistical models.
Step 5: Modelling: Our problem is concerned with how and who a college should focus on to increase the overall performance. We decided to build a scoring model to score each of the student based on different parameters. The credit scoring is based on the behaviour of previously placed students. Mathematically, scorecard can be represented as
p = f(X1, X2, . . . , Xm),
where the probability (score) p is a function of the variables X1, X2, . . . ,Xm. For instance, 10th score, 12th score, BE, IQ score, age, practical exposure, gender etc. are the parameters for predicting scorecard variables.
This minimum score is referred to as a "cut-off", and can be represented as
D(s) = reject, if s ≥ smin,
accept, if s < smin,
where D(s) is a decision function, s is an applicant‘s score and smin is a desired cut-off. We decided to use logistic regression to build the scorecard. Let pi = P(yi = 1) be the probability of yi = 1 and logit(pi) = log(pi / (1 − pi)) be the logit link function for observation i. The logistic regression model has a linear form for the logit:
Step 6: Deployment: We are in the process of improving the model by tuning the parameters. We are gathering primary data using questionnaire and market research. We performed some statistical tests, ROC curve, and accuracy tests to improve the model. We took a sample size of 100 to perform these tests. We have presented the results in form of confusion matrix by using Logistics regression model.
Confusion Matrix (Logistics Regression):
Predicted No Predicted Yes
Actual No 14 16 30
Actual Yes 7 33 40
21 49
Accuracy: Overall, how often is the classifier correct? (TP+TN)/total = (14+33)/100 = 0.47
Misclassification Rate: Overall, how often is it wrong? (FP+FN)/total = (16+7)/100 = 0.23
equivalent to 1 minus Accuracy also known as "Error Rate".
True Positive Rate: When it's actually yes, how often does it predict yes?
TP/actual yes = 33/40 = 0.82
also known as "Sensitivity" or "Recall"
False Positive Rate: When it's actually no, how often does it predict yes?
FP/actual no = 16/30 = 0.53
Specificity: When it's actually no, how often does it predict no?
TN/actual no = 14/30 = 0.47
equivalent to 1 minus False Positive Rate
Precision: When it predicts yes, how often is it correct?
TP/predicted yes = 39/49 = 0.79
Prevalence: How often does the yes condition actually occur in our sample?
actual yes/total = 40/100 = 0.40
C5.0 Algorithm
We tried to compare this logistics regression model with C5.0 algorithm. We implemented this algorithm and produced the following results.
Input Parameter:
Input data which is requisite to classify correctly. Attributes Input to the algorithm consists of a collection of training cases, with a class attribute and a tuple of values for a fixed set of attributes
R = {R1, R2,...., Rn} and a class attribute.
Output: Generate the Decision tree which classifies the training data correctly.
To make the tree Create a root node Check the base case
With the use of Genetic Search Apply Feature Selection technique
bestTree = Construct a decision tree using training data
Apply Cross validation technique
Divide all training data into N disjoint subsets, R = R1, R2, ..., RN
For each j = 1, ..., N do Test set = Rj Training set = R – Rj Using Training set, Compute the decision tree Decide the performance accuracy Xj with the use of Test set
Reckon the N-fold cross-validation
technique to estimate the performance = (X1 + X2 + ... + XN)/N
Figure 1: Tree representation for student database.
Confusion matrix (C5.0 Algorithm):
Predicted No
Predicted
Yes
Actual No 13 0 13
Actual Yes 0 17 17
13 17
It predicts 13 as ―No‖ placed and 17 as ―Yes‖ placed.
This algorithm produced the results in form of tree structure with less or no accuracy in predicting the placement status of the student while prediction done with the help of logistics regression produces the result in probabilistic nature. So we can easily predict the student placement status.
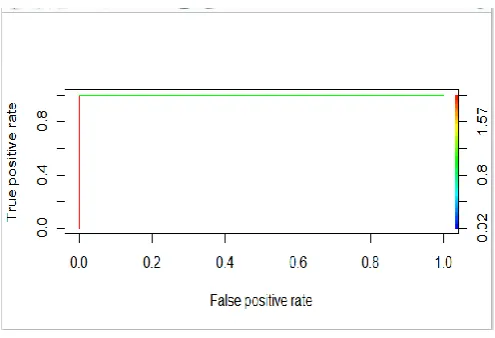
Graph 1: ROC curve for C5.0 algorithm
Graph 2: ROC curve for Logistics regression
IV.CONCLUSION
We have discussed steps that need to be considered for enhancing the quality of education to sustain a nation. We have studied the process to help student to achieve success in academics by understanding the huddles such as critical issues and challenges of education— specifically, technical education and the role that predictive analytics which can play in order to address these issues. Factors such as miniaturization of various sensors, improved logging and tracking of systems and improvements in the quality and capacity of both disk storage and networks should be considered in future.
V. ACKNOWLEDGEMENT
This survey would not have been possible without the kind support and help of many individuals. I would like to extent my sincere thanks to all of them. I am highly indebted to Prof. Rachana Satao, Department of Computer Engineering of Smt. Kashibai Navale College of Engineering affiliated to Savitribai Phule Pune University for her guidance and constant supervision as well as all the other staff members for providing important information regarding the survey.
VI. REFERENCES
Volume: 17, Issue: 4,Pages: 24 - 33, DOI: 10.1109/MITP.2015.68
[2] Shankar M. Patil ―Predictive Analytics in Higher Education‖, International Journal of Advanced Research in Computer and Communication Engineering Vol. 4, Issue 12, December 2015. [3] A.V. Barneveld et al., ―Analytics in Higher
Education: Establishing a Common Language,‖
Educause, Jan.2012;
www.educause.edu/library/resources/analytics-higher-education-stablishing-common-language.
[4] Karthikeyan Natesan Ramamurthy, Moninder
Singh, Michael Davis, J. Alex Kevern, Uri Klein, and Michael Peran,‖ Identifying Employees for Re-Skilling using an Analytics-Based Approach ―,2015 IEEE 15th International Conference on Data Mining Workshops, pp. 345-354, DOI 10.1109/ICDMW.2015.206.
[5] Matthew Malensek; Sangmi Pallickara; Shrideep Pallickara, ―Analytic Queries over Geospatial Time-Series Data Using Distributed Hash Tables ―,2016 IEEE Transactions on Knowledge and
Data Engineering, DOI:
10.1109/TKDE.2016.2520475.
[6] Joseph Berral; Nicolas Poggi; David Carrera; Aaron Call; Rob Reinauer; Daron Green ,―ALOJA: A Framework for Benchmarking and Predictive Analytics in Hadoop Deployments‖ ,Computing Year: 2015, Volume: PP, Issue:
99Pages: 1 - 1, DOI:
10.1109/TETC.2015.2496504.
[7] P. Raj and G.C. Deka, ―Big Data Predictive and Prescriptive Analytics,‖ A Handbook of Research on Cloud Infrastructure for Big Data Analytics, IGI Global, 2014, pp. 370–391; doi:10.4018/978-1-4666-5864-6.ch015.
[8] Predicting the Future of Predictive Analytics, SAP report, Dec. 2013; http://tinyurl.com/ooygmtq. [9] E. Sigel, ―Seven Reasons You Need Predictive
Analytics, ―Prediction Impact, 2010; http://www-
01.ibm.com/common/ssi/cgi-bin/ssialias?infotype=SA&subtype=WH&htmlfid =YTW03080USEN.