www.nat-hazards-earth-syst-sci.net/11/529/2011/ doi:10.5194/nhess-11-529-2011
© Author(s) 2011. CC Attribution 3.0 License.
and Earth
System Sciences
An algorithm for operational flood mapping from Synthetic
Aperture Radar (SAR) data using fuzzy logic
L. Pulvirenti1, N. Pierdicca1, M. Chini2, and L. Guerriero3
1Department of Information Engineering, Electronics and Telecommunications, Sapienza University of Rome,
Via Eudossiana 18, 00184 Rome, Italy
2Istituto Nazionale di Geofisica e Vulcanologia, Via di Vigna Murata 605, 00143 Rome, Italy
3Department of Computer Science, Systems and Production, Tor Vergata University of Rome, Via del Politecnico 1,
00133 Rome, Italy
Received: 13 July 2010 – Revised: 9 December 2010 – Accepted: 4 January 2011 – Published: 18 February 2011
Abstract. An algorithm developed to map flooded areas from synthetic aperture radar imagery is presented in this pa-per. It is conceived to be inserted in the operational flood management system of the Italian Civil Protection and can be used in an almost automatic mode or in an interactive mode, depending on the user’s needs. The approach is based on the fuzzy logic that is used to integrate theoretical knowledge about the radar return from inundated areas taken into ac-count by means of three electromagnetic scattering models, with simple hydraulic considerations and contextual infor-mation. This integration aims at allowing a user to cope with situations, such as the presence of vegetation in the flooded area, in which inundation mapping from satellite radars rep-resents a difficult task. The algorithm is designed to work with radar data at L, C, and X frequency bands and employs also ancillary data, such as a land cover map and a digital el-evation model. The flood mapping procedure is tested on an inundation that occurred in Albania on January 2010 using COSMO-SkyMed very high resolution X-band SAR data.
1 Introduction
Floods are probably the most frequent, disastrous and widespread natural hazards of the world. Mapping their ex-tension is fundamental to assess the damages and for relief organization. The potential of the data provided by satel-lite Synthetic Aperture Radar (SAR) systems for large-scale flood detection has been demonstrated by several previous in-vestigations (e.g., Horritt et al., 2001). The synoptic view and the capability to operate during daytime and nighttime and
Correspondence to: L. Pulvirenti ([email protected])
in almost all weather conditions, contrary to visible/infrared sensors, are the key features that make SAR images useful for inundation mapping (Smith, 1997). In addition, the great sensitivity to water of the microwave band permits SAR to distinguish between land and water.
Several inundation events were profitably analyzed in the past by using SAR imagery. Examples are the Mississippi flood of 1993 (Brakenridge et al., 1994), the 1996 and 1997 inundations in the Red River Valley (Barber et al., 1996; Wil-son and Rashid, 2005), the August 2002 Elbe river flood (Henry et al., 2006), the overflow of the River Thames in 1992 (Horritt et al., 2001), the 2006 event of the River Dee in Wales (Schumann et al., 2009a), the River Mosel flood of 1997 and the 2003 event on the River Alzette floodplain (Schumann et al., 2007). Reviews of the state of the art in flood remote sensing were provided by Smith (1997), Sanyal and Lu (2004) and by Schumann et al. (2009b).
deployed (the fourth satellite was launched on 5 November 2010), the revisit time will be 12 h in the worst case (Covello et al., 2010).
ASI is presently funding some studies on the use of Earth Observation data for managing flood events. Within the framework of one of these investigations (OPERA, civil pro-tection from floods), whose purpose is the evaluation of the usefulness of Earth Observation techniques in operational flood prediction and assessment chains (Boni et al., 2009), we have developed a new algorithm to produce maps of in-undated areas from SAR images. It has been conceived to be used for operational flood management system of the Italian Civil Protection.
The algorithm is based on fuzzy logic that is particularly suitable to deal with the ambiguities in radar images (Kar-makar and Dooley, 2002). Moreover, fuzzy logic has per-mitted us to take into account different information sources, in particular: (i) the outputs of three electromagnetic scatter-ing models used to simulate the SAR observations of flooded areas; (ii) simple hydraulic considerations based on the near-ness to water bodies (rivers, lakes, reservoirs, etc.) and on the height of the analyzed pixels; (iii) contextual conditions relating neighbouring pixels.
The validity of an approach based on fuzzy logic for flood mapping was assessed in Pierdicca et al. (2008), where the parameters of the fuzzy algorithm were selected, taking ad-vantage of the availability of ground truth data concerning the flood extension. Since in operative applications such availability cannot be supposed, in the present work we follow a different method. The theoretical knowledge on the scattering of the electromagnetic radiation from various types of surfaces, that in Pulvirenti et al. (2011) proved to be very useful for flood mapping using SAR, is exploited. In particular, three electromagnetic models predicting the radar return from agricultural, forested and urban areas, have been extended to simulate the backscattering under flooded condi-tions. Note that in Pierdicca et al. (2008), the nearness to wa-ter bodies and the height of the pixels were not considered. Furthermore, here we also account for the homogeneity of the radar return from open water surfaces.
The algorithm allows the user to perform an almost au-tomatic generation of a map of flooded areas. In this case, the default parameters of the algorithm, i.e., those derived from the outputs of the theoretical models (see Sect. 2.1) are retained. Alternatively, expert operators can interactively modify the parameters of the algorithm. For this purpose, they can rely on their visual interpretation of the SAR im-agery (Schumann et al., 2009a), but they can also analyze the statistics of the backscattering from some regions of interest (ROIs) that can be drawn on the images. In other words, both fairly accurate flood boundary delineation, based on a large amount of user interaction, and an automatic rapid mapping are allowed in order to account for the different needs of Civil Protection in the different stages of its operational tasks.
Section 2 introduces the fuzzy approach that we have used to design the algorithm and points out its advantages with re-spect to other image- processing techniques used to separate inundated from non-inundated areas in SAR images. The al-gorithm is described in detail in Sect. 3, while its application to a test case is discussed in Sect. 4. Section 5 draws the main conclusions.
2 The fuzzy approach
Although both coherence change detection methods (e.g., Nico et al., 2000) and active contour models (e.g., Horritt et al., 2001) have been frequently used in literature to de-tect flooded areas in SAR imagery, thresholding represents the most common technique for inundation mapping from radar data. According to this approach, all pixels of an inten-sity image whose backscattering coefficient (σ0)is smaller than a given threshold value (e.g., Hess et al., 1995; Henry et al., 2006) are classified as flooded. Thresholding is com-putationally inexpensive and suitable for rapid mapping pur-poses (Martinis et al., 2009), but is valid only for open water surfaces that behave as specular reflectors, thus scattering a small amount of radiation back to the radar antenna.
are included in the imaged scene. A way to deal with the ambiguity of the radar signature of flooded areas and, at the same time, with the requirement of an objective result has been implemented in our algorithm, based on the fuzzy the-ory. Exploiting prior information on the physics of surface scattering, the algorithm can perform an automatic mapping, but it can also allow a certain degree of user interaction when considered relevant for the specific scenario.
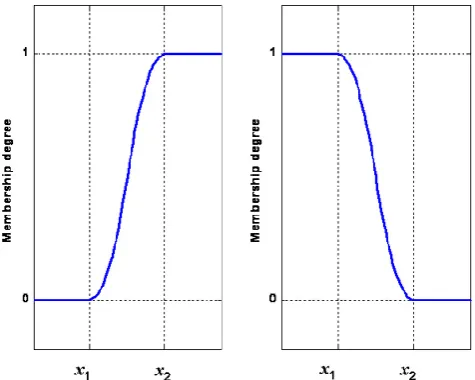
The fuzzy sets basically represent an extension of the clas-sical notion of set. While in clasclas-sical set theory an element either belongs or does not belong to the set, elements of a fuzzy set have degrees of membership. These degrees are defined through membership functions whose values are real numbers in the interval [0, 1]. Examples of simple member-ship functions are the standardSfunction and the standardZ function (Pal and Rosenfeld, 1988) that are shown in Fig. 1, in which the parametersx1andx2denote the fuzzy
thresh-olds. The fuzzy theory is suitable for representing the set of flooded pixels in SAR images for which the definition of a criterion of membership is a difficult task.
2.1 The model-based fuzzy thresholds
In order to avoid resorting to empirical training data sets generally unavailable in operative applications, we have de-termined the default values of the fuzzy thresholds by ana-lyzing the outputs of three well-established electromagnetic scattering models, namely the two models developed at the Tor Vergata University of Rome (Bracaglia et al., 1995; Fer-razzoli and Guerriero, 1995) to simulate the radar return from agricultural and forested areas, and that proposed by Franceschetti et al. (2002) to predict the backscattering from urban areas. They have been run for different system pa-rameters, such as frequency bands (L, C, X), polarizations (horizontal and vertical, i.e. only co-polarized data are con-sidered), and incidence angles (25◦, 35◦for L and C bands; 25◦, 35◦, 45◦, 55◦for X band, accounting for the multi-angle capability of CSK). Sixteen files of default threshold values (2 polarizations times 2 angles for L and C bands; 2 polariza-tions times 4 angles for X band) have been produced. Each file contains the thresholds for four land cover classes: bare soils, urban or built-up areas, agricultural terrains and forests, so that the availability of a land cover map (LCM) is sup-posed.
Geometrical and dielectric properties assumed for mod-elling the scattering of vegetation have been based on the most common species in the Mediterranean environment. As for agricultural areas, we have considered typical charac-teristics (e.g., leaf and stem dimensions, plant height and density) of crops (Ferrazzoli et al., 2000; Della Vecchia et al., 2006), whereas for forests, biomasses of 25 t ha−1 and 50 t ha−1have been considered. Note that a more accurate discrimination of vegetation types than a simple distinction between crops and forests would have required the use of de-tailed maps, generally unavailable in operative applications.
Fig. 1. StandardS(left panel) andZ(right panel) fuzzy member-ship functions. For the S-function, values larger thanx2 belong
definitely to the set (membership degree equal to 1), while values smaller thanx1do not belong to the set (membership degree equal
to 0). For the Z-function, the opposite occurs.
Moreover, dealing with many different vegetation species would have increased the complexity of the models of elec-tromagnetic scattering of vegetated areas considerably. We have therefore made a compromise between the quality of the predictions of the backscattering coefficient and the com-plexity of the designed system, also accounting for the ex-pected quality of the information about land cover.
To run the models, the flood conditions have been sim-ulated by assuming that soil has the same electromagnetic characteristics (i.e., dielectric permittivity) as water and a negligible roughness (Pulvirenti et al., 2011) as well. To predict the radar return under dry conditions, fairly standard values of soil roughness (i.e., height standard deviation in the order of 1 cm) and volumetric moisture (in the range 0.2– 0.3 m3m−3) have been assumed.
Simulated radar returns from agricultural areas have been produced by considering, as crops, wheat and corn at differ-ent stages of growth (from bare soils to well-developed veg-etation). By analyzing the simulations, we have found that, under flooded conditions, plants at an early stage of growth show aσ0similar to that of bare soils (almost specular re-flection of the radar radiation). Also, developed plants sub-merged by water (i.e., water level higher than crop height) tend to specularly reflect an electromagnetic wave.
We have defined the fuzzy set of low backscattering ar-eas, whose degree of membership is evaluated by applying the standard Z-function (Fig. 1, right panel) to image-1. If σ0< x1 the degree of membership to the set of inundated
pixels is 1, while if σ0> x2 it is 0. Note thatσ0 is in dB
units. To determinex1andx2for the set of low
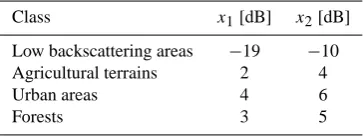
Table 1. Default fuzzy thresholds derived from the electromagnetic
models for X band, incidence angle equal to 35◦, horizontal polar-ization.
Class x1[dB] x2[dB]
Low backscattering areas −19 −10 Agricultural terrains 2 4 Urban areas 4 6
Forests 3 5
agricultural areas obtained for bare soil and for small crops. Furthermore, for some SAR configurations (C band, verti-cal polarization; X band, horizontal polarization) we have also exploited a set of SAR images (in particular, ERS, EN-VISAT/ASAR and COSMO-SkyMed ones) belonging to our archive and including water bodies, easily detectable thanks to the sensitivity of the microwave band to water. The radar observations over water bodies have been used to tune the results of the theoretical model.
For agricultural areas, the simulations have shown that the increase of the double bounce backscattering due to an in-undation can become quite large (at least 2–3 dB) when the crops have reached at least an intermediate stage of growth (i.e., in spring or in summer). This effect is particularly evi-dent for wheat, and for the C and X bands (Pulvirenti et al., 2011). The degree of membership to the class of agricultural flooded areas involved in the enhancement of backscattering is defined by the standard S-function (Fig. 1, left panel). This means that denoting as1σ0the difference (in dB units) be-tween the radar returns of image-1 and image-2, if1σ0< x1
the degree of membership to the set of inundated pixels is 0, while if1σ0> x2the degree is 1. The values ofx1andx2
have been determined through a joint analysis of the results obtained for wheat and corn. The S-function has been also used to define the membership to the sets of flooded forested and urban areas for which a backscattering enhancement may occur as well.
The electromagnetic model for forests has been run for both deciduous and coniferous forests and two biomasses (25 t ha−1 and 50 t ha−1). By analyzing the results of the simulations, we have found that, under flooded conditions, the two kinds of forest show approximately the same electro-magnetic behaviour (i.e., the enhancement of the backscat-tering due to the double bounce is of the same order of mag-nitude). In addition, the increase of the backscattering has proved to be fairly large at horizontal polarization and for small biomasses. It is worth noting that, for some configura-tions of SAR parameters, agricultural and forested areas have not shown any sensitivity to water coverage, according to the model developed at the Tor Vergata University. For instance, at vertical polarization, the detection of flooded forests has turned out to be problematic at any bands. This finding
sup-ports our idea of using fuzzy logic also to integrate hydraulic considerations into the algorithm (see Sect. 3), in order to improve its ability to map an inundation.
As for urban areas, relating the radar response patterns to the characteristics of the man-made structures is a very com-plex problem, whose solution is far to be found. This consid-eration implies that, as stated by Schumann et al. (2009b), SAR is unable to extract flooding from urban areas, even though an attempt has been recently carried out by exploit-ing the high resolution TerraSAR-X instrument (Mason et al., 2010). An analytical evaluation in closed form of the electromagnetic return from a building was accomplished by Franceschetti et al. (2002) for the simplified scenario rep-resented by a building isolated from other man-made struc-tures, i.e., a parallelepiped placed on a rough surface. Our simulations of radar return from urban flooded areas have been performed by applying the model of Franceschetti et al. (2002) substituting the rough surface surrounding the building with water. The results have revealed that the pres-ence of the standing water causes a large increase of the dou-ble bounce backscattering, involving surface and buildings, at all the considered frequencies.
Table 1 reports the values of the default fuzzy thresholds that we have derived for X band, horizontal polarization, at incidence angle θ=35◦. It is worth pointing out that, for agricultural areas and forests, the models provide a range of predicted backscattering coefficients under flooded condi-tions because of the different assumpcondi-tions of the type and of the stage of growth of the crops or of the forest biomass. This range defines the values ofx1andx2. For instance, we have
found that, for the sensor configuration considered in Table 1, the minimum increase (when present) ofσ0due to flood for the class of agricultural areas, considering plants reaching at least an intermediate stage of growth, is 2 dB, while the max-imum increase can reach 4–5 dB. These values correspond to those reported in Table 1. It can be noted that the values of x1andx2for the class of urban environment are larger than
those for agricultural/forested terrains, in agreement with the previous considerations about the strong double bounce oc-curring in urban settlements.
the vegetation parameters (height, biomass, etc.) are similar to those typical of cereals (see for instance Ferrazzoli et al., 2000), and by forests with moderate biomass. Different en-vironmental conditions can be encountered, and in this case, the importance of the user interaction increases. For instance, it is likely the thresholds of the set of low backscattering pix-els need to be modified if the wind speed is high because the wind roughening implies that open water surfaces do not be-have as specular reflectors. Moreover, if different climatic areas are considered, vegetation parameters might be very dissimilar with respect to those assumed to run the electro-magnetic models and the fuzzy thresholds may require an adjustment. User interaction is also important when dealing with urban areas, as stated in the literature (e.g. Mason et al., 2010).
2.2 The fuzzy sets based on texture, context and ancillary data
Fuzzy logic has also allowed us to include additional sources of data in the classification algorithm in order to improve the reliability of its results. Indeed, together with the set of flooded pixels according to SAR data, other fuzzy sets are generated by the algorithm. For each image pixel, the membership to the following fuzzy sets is defined: (A) set of homogeneous areas, i.e., of the areas in which the stan-dard deviation of the backscattering is small; (B) set of pixels close to permanent water bodies; (C) set of pixels located at an altitude not exceeding that of the nearest permanent water body; (D) set of pixels surrounded by a uniform background; (E) set of pixels whose altitude is lower with respect to the elevation of the neighbouring ones that have a large degree of membership to the set of flooded areas; (F) set of pixels whose altitude is higher with respect to the elevation of the neighbouring ones that have a small degree of membership to the set of flooded areas.
Set (A) is built through the application of a 3×3-pixel win-dow scanning image-1 and through the computation of the standard deviation of the radar return in the window. Then, the Z-function is applied to the image formed by the stan-dard deviations withx1=0,x2=0.1. In this way, the degree
of membership is close to 1 if the standard deviation is close to 0, so that we assign a large membership degree to the set of flooded pixels to homogeneous zones. Indeed, in SAR images affected by the speckle noise, the standard deviation of the radar return is proportional to the mean value, so that open water surfaces generally appear as homogeneous areas (except when high winds roughen the surface).
As for sets (B) and (C), the basic idea is that if a river over-flows, the inundation probability is large for pixels close to the river and at an altitude not exceeding the river course, so that these pixels should have a large degree of membership to the set of flooded areas. In this way, we avoid false alarms in areas far from water bodies and in hilly or mountainous regions. For each land pixel, the program can calculate its
distance from the closest water body pixel, as well as the dif-ference between the elevations of the two pixels. To create two fuzzy sets to account for these hydraulic considerations in the algorithm, the Z-function is applied and the parame-tersx1 andx2 are chosen equal to 0 m and 900 m,
respec-tively, for the distance from the water bodies, and to 0 m and 100 m, respectively, for the height difference. Ancillary data are needed to build the sets (B) and (C). In particular, a LCM and a digital elevation model (DEM) are used. LCM should discriminate also water bodies, besides the four classes (ur-ban areas, bare soils, agricultural terrains and forests) listed in Sect. 2.1.
The fuzzy sets (D), (E), (F) are built to account for con-textual information in our algorithm, in order to avoid the presence of either isolated inundated pixels or small holes inside an inundated area, thus producing a final map hav-ing fairly large spatial coherence. In particular, pixels sur-rounded by a uniform background tend to assume the degree of membership of the background, while set (E) has a large degree of membership to the set of flooded areas and the op-posite occurs for set (F). To generate these fuzzy sets, we basically use the same membership functions that we devel-oped in Pierdicca et al. (2008).
It is worth noting that the effect of introducing the afore-mentioned sets may depend on the quality of the ancillary data. For instance, sets (E) and (F) are almost ineffective if a low quality DEM is used. Furthermore, we expect to update the fuzzy thresholds of the sets based on texture, context and ancillary data on the basis of the analysis of other case stud-ies. The thresholds we have used in this work have been also based on past experiences (e.g. Pierdicca et al., 2008).
As will be described hereafter, the various fuzzy sets are combined through the operation of fuzzy union (degree of membership defined as the maximum of the individual de-grees) and through a fuzzy rule that defines the member-ship degree as the weighted average of the individual degrees (Karmakar and Dooley, 2002). The latter rule will be denoted hereafter as the weighted average rule.
3 Algorithm description
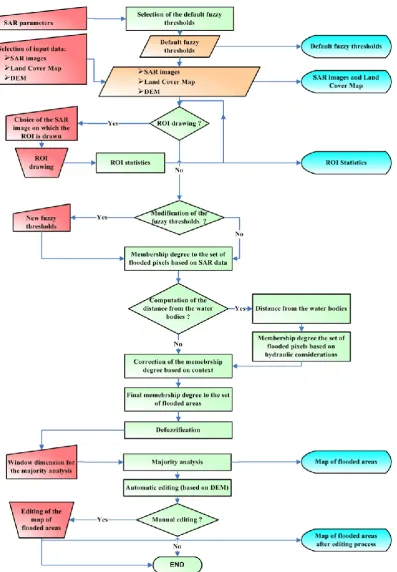
The flow diagram shown in Fig. 2 describes the structure of the algorithm that we have designed. On the left side of the diagram (in red), the operations that the user performs are represented, while on the right side (cyan), we indicate what the program displays during its run.
3.1 The input data
Fig. 2. Flow diagram of the designed algorithm. On the left part of the diagram, the user operations are indicated and represented by red
have been determined for a fixed number of incidence angles, so that, if the incidence angle of the SAR image is different, the program performs an interpolation to compute the default fuzzy threshold values.
Successively, the input data should be selected. The algo-rithm requires as inputs a SAR observation (intensity image) of the flooded area (image-1), a LCM and a DEM. A SAR observation of the same area under dry conditions (image-2), helpful to detect vegetated and urban inundated regions (see Sect. 2), is an optional input, so that the program runs also if only image-1 is available. SAR data, LCM and DEM are supposed to be co-registered on the same reference car-tographic system and must have the same pixel size and the same dimensions (i.e., number of rows and columns). The al-gorithm produces an output consisting of a map of inundated areas represented by a raster image having the same charac-teristics (reference cartographic system, pixel size, number of rows and columns) of the input data.
It must be considered that, if data provided by instruments with multi-incidence angle capability (such as COSMO-SkyMed) are employed it may happen that image-1 and image-2 have different incidence angles. Such a difference must be accounted for when evaluating the possible enhance-ment of the double bounce backscattering due to the inunda-tion. We have assumed a simplified cosine model (Ulaby and Dobson, 1989), supposing that the variation ofσ0with the incidence angleθcan be approximated by cos2(θ). With this hypothesis, ifθxandθyare the incidence angles of image-1
and image-2, respectively, the quantity
D=10log10[cos2(θx)] −10log10[cos2(θy)] [dB] (1)
is added to image-2 and angleθxis considered to select the
fuzzy thresholds.
It is worth noting that, for rapid mapping purposes, the operator could decide to use only the radar observation of the flood, in order to avoid losing time searching through a data archive for a SAR image of the area involved in the flood event under dry conditions (provided by the same radar, preferably with the same observation geometry).
3.2 Region of interest drawing and modification of the fuzzy thresholds
As discussed at the end of Sect. 2.1, the default fuzzy thresh-olds have been established by assuming fairly standard con-ditions of a mid-latitude region, such as the Mediterranean, for the runs of the electromagnetic scattering models. Since different environmental conditions can be encountered, the operator can verify whether the default thresholds are suit-able for the specific case study and, if necessary, interactively change them. For this purpose, the algorithm allows the op-erator to compare the default thresholds with the radar return from one or more ROIs that can be drawn on the SAR im-ages.
Once the input data have been entered, the program dis-plays the default fuzzy thresholds (x1andx2)together with
the SAR images (i.e., image-1 and, in case, image-2 and the pixel by pixel difference, in dB units, between image-1 ad image-2) and the LCM. Then, the user can choose the image on which he/she wishes to create the ROI and, after the ROI has been drawn, the program displays the statistics (mean value and standard deviation) of the radar return inside the ROI for all the available SAR images. To select the ROI on homogeneous regions from a land cover point of view, the operator can help himself/herself by looking at the displayed LCM. The operation of ROI drawing can be repeated as long as the user needs (see Fig. 2). Successively, the operator can update the fuzzy thresholds according to the results of the ROI statistics analysis and/or his/her visual interpretation of the SAR images.
3.3 Computation of the membership degree to the set of flooded areas
Once the set of fuzzy parameters has been selected, the pro-gram begins to compute the degree of membership to the set of flooded pixels based on SAR data (see Fig. 2). For this purpose, the standard Z-function is first applied to image-1 to compute the degree of membership to the set of low backscattering areas (i.e., of dark image pixels, see Fig. 3, left panel). Then, the set of homogenous areas (see Sect. 2.2) is created and the weighted average rule (see Sect. 2.2) is applied to the aforementioned two fuzzy sets to produce the fuzzy set of the dark and homogeneous pixels. On the aver-age, the largest weight is given to the set of dark areas.
To generate the fuzzy set of pixels involved in the dou-ble bounce backscattering enhancement, three applications of the standard S-function to the pixel by pixel difference (in dB units) between image-1 and image-2 are performed. These applications are associated with the three land cover classes potentially involved in the double bounce backscat-tering, i.e., agricultural, urban and forested areas. Note that this part of the algorithm is actually executed only if image-2 is used. In this case, the degree of membership to the set of flooded pixels based on SAR data is determined by the fuzzy union (see Sect. 2.2) of the set of dark and homogeneous pixels and of that of pixels involved in the double bounce backscattering enhancement, otherwise it is equal to the for-mer fuzzy set.
Fig. 3. COSMO-Skymed images of the area of Shkod¨er (Albany).
Left panel: acquisition of 10 January 2010 (the values on the greyscale are in dB units); right panel: RGB true colour composi-tion of the acquisicomposi-tions of 7 July 2009 (red) and 10 January 2010 (green and blue). Green, yellow and orange boxes denote three ROIs drawn on the images. White areas correspond to no-data (re-gions not included in the analysis or areas not imaged by COSMO-SkyMed). The urban area of Shkod¨er is indicated.
fuzzy set of inundated pixels. Also in this case, the largest weight is given to SAR.
The fuzzy set of inundated pixels is further modified in order to account for contextual information through the cre-ation of the sets denoted as (D), (E), (F) in Sect. 2.2. Details on the way we have introduced contextual information in the algorithm can be found in Pierdicca et al. (2008) so that, for the sake of conciseness, we refer the reader to this open ac-cess paper. The degrees of membership to the sets (D), (E), (F) are combined with the degree of membership to the fuzzy set of inundated pixels through the weighted average rule, in which the largest weight is given to the latter degree. The fi-nal degree of membership resulting from this average is used to generate the map of flooded areas.
3.4 Generation of the map of flooded areas
The last part of the program performs the defuzzification of the fuzzy set of flooded areas, followed by a majority anal-ysis and by two editing operations. A simple defuzzifica-tion scheme, in which all pixels having a membership de-gree larger than a threshold value are assigned to the class of flooded areas, is applied. The threshold is determined by means of the Otsu method (Otsu, 1979) that automat-ically performs histogram shape-based image thresholding, creating the hypothesis that the image to be thresholded (that formed by the degrees of membership of each image pixel, in this case) contains two classes (flooded and non-flooded
pixels, in this case). It computes the optimum threshold sep-arating the two classes so that their within-class variances are minimal.
As for the majority analysis, it has the objective of remov-ing residual spurious pixels, thus producremov-ing a final map in which flooded and non-flooded areas are homogeneous. It is simply carried out by means of a mobile window, whose dimensions can be selected by the operator (see Fig. 2). The central pixel of the window is classified as flooded if the ma-jority of the pixels belong to this class.
The final step of the program consists of the final editing of the map. Firstly, the algorithm performs an automatic editing operation that basically consists of the detection of the areas possibly involved by shadow/layover effects. This detection is carried out by applying a 3×3-pixels window to the DEM and computing the standard deviation of the heights within the window. Pixels originally classified as flooded whose standard deviation of the height is larger than a given thresh-old (0.7, but also in this case we expect to update this value through the analysis of other case studies), are flagged. Note that some SAR processing tools are able to produce maps of layover/shadow using the available orbit information and the DEM of the area. Since the availability of this kind of map is not ensured in operative conditions, we have preferred to resort only to the DEM for this editing step.
The second editing operation is manual and can be option-ally performed by the operator to correct the possible errors that he/she finds on the map on the basis of his/her visual in-terpretation. Errors detectable by a fairly skilled user can be false alarms caused by residual speckle noise or failures in detecting layover/shadow, as well as missed detection due to the presence of wind. The user can draw a ROI on the por-tion of the map he/she wants to edit and can carry out two different editing actions: (i) inserting new flooded areas not detected by the algorithm; (ii) removing from the ROI the pixels marked as flooded.
4 Application of the algorithm to the COSMO-SkyMed observations of the Shkod¨er flood (January 2010)
Fig. 4. Land Cover Map (left panel), derived from the Corine 2000
database, and Digital Elevation Model (right panel), derived from the SRTM mission, of the area of Shkod¨er. For the Land Cover Map, red: urban or built-up areas; green: bare soils; yellow: agri-cultural areas; maroon: forests; blue: water bodies. For the Digital Elevation Model the stretching is between 0 m and 300 m (see the colorbar). White areas correspond to no-data (regions not included in the analysis or areas not imaged by COSMO-SkyMed).
it from breaking. More than 10 000 hectares of land were flooded.
To describe the application of our algorithm to a case study and to compare its performance with that yielded by a stan-dard thresholding method, we refer to the CSK acquisition temporarily closest to the peak of the event, i.e., the obser-vation performed on 10 January 2010 (image-1). The im-age was acquired in Stripmap mode, horizontal polarization, right descending orbit, with an observation angle of 35.9◦. An archived image of the same area acquired on 7 July 2009 in Scansar mode, horizontal polarization, right descending orbit, and an observation angle of 22◦, was also available (image-2). The images were geocoded by means of appropri-ate software and exploiting the freely available SRTM (Shut-tle Radar Topography Mission) DEM. Then, they were re-sampled to a resolution of 5 m, and a Frost adaptive filter (Frost et al., 1982) was applied to mitigate the speckle noise. Note that a resolution of 5 m is degraded with respect to that of the CSK Stripmap products (3 m), but the Scansar resolu-tion is 30 m and we have avoided an excessive oversampling of the data acquired on 7 July 2009. A portion of 4000×6200 pixels, including the area involved in the flood, has been fi-nally selected.
The image acquired on 10 January 2010 is shown in the left panel of Fig. 3, while the right panel shows a RGB true colour image in which the red channel represents the ob-servation under dry conditions (7 July 2009) while in the other two channels the observation of 10 January 2010 is
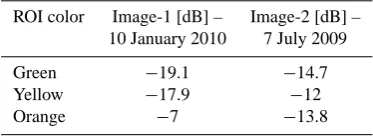
dis-Table 2. Mean values of the radar return in the ROIS drawn on
Fig. 3.
ROI color Image-1 [dB] – Image-2 [dB] – 10 January 2010 7 July 2009 Green −19.1 −14.7 Yellow −17.9 −12 Orange −7 −13.8
played. Many flooded areas can be visually detected since they appear dark in the left panel of Fig. 3 and red in the right panel. However, it can be noted that also the region of the Shkod¨er Lake appears red in the right panel because of the presence of wind in this region on 7 July 2009. The area of the Shkod¨er Lake can be easily detected by looking at the left panel of Fig. 4 showing the LCM that has been derived from the Corine 2000 database.
The area within the orange ROI in Fig. 3 deserves particu-lar attention. It appears bright in the left panel of Fig. 3 and cyan in the right panel of Fig. 3. This indicates that a consid-erable increase of the backscattering occurred on 10 January 2010 with respect to that measured by CSK on 7 July 2009. This increase is quantified in the last row of Table 2, where it is reported that the mean values of the radar return inside the three ROIs drawn in Fig. 3 for the two days considered in this analysis. It can be noted that the mean value of1σ0 in the orange ROI is 6.8 dB. In addition, this area is classi-fied as a forest by the LCM (see Fig. 4) and 6.8 dB represents a value that exceeds the default value ofx2 for the class of
forests that is equal to 5 dB, as reported in Table 1, suitable for this case study because it refers to an incidence angle of 35◦. We can therefore suppose that the area within the orange box was involved in the enhancement of the double bounce backscattering at the time of the inundation. The capability of our algorithm to automatically detect the flood in this area without any supervision will be shown hereafter.
Besides the orange box, other two ROIs are drawn in Fig. 3. Green and yellow boxes include two areas that ap-pear dark in the left panel (probably flooded). For the image acquired on 10 January 2010, the mean values ofσ0in these two ROIs are equal to−19.1 dB (green ROI) and−17.9 dB (yellow ROI), as reported in Table 2. These values are con-sistent with the default value ofx1for the fuzzy set of low
backscattering areas (−19 dB, see Table 1) and can therefore be retained.
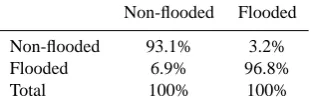
Table 3. Confusion matrix between the classification yielded by
our algorithm using the COSMO-SkyMed images acquired on 10 January 2010 and 7 July 2009, and that produced by the histogram thresholding method (only the image of 10 January 2010). Columns represent the result obtained by applying our algorithm.
Non-flooded Flooded Non-flooded 93.1% 3.2% Flooded 6.9% 96.8% Total 100% 100%
Table 4. Same as Table 3, but considering forested areas only.
Non-flooded Flooded Non-flooded 94.5% 76.3% Flooded 5.5% 23.7% Total 100% 100%
skill. We have supposed that an unskilled operator has run our algorithm, so that, to produce the map of inundated areas, we have retained the default threshold values for the three aforementioned classes, thus relying on the electromagnetic models.
For the considered test case, we have allowed the program to calculate the distance from the water bodies. In general, for real-time operative applications, the use of this informa-tion is recommended if the time requirements are not very strict, otherwise it can be skipped (unless a map of the dis-tance from the water bodies was already produced by a pre-vious run of the system, thus being already available).
The result of the application of our algorithm to the case study considered is shown in the left panel of Fig. 5. Hav-ing assumed that an unskilled operator has run the algorithm, we have not carried out any manual editing to generate this map. In the right panel of Fig. 5 the map obtained by ap-plying a simple histogram thresholding method is shown as a benchmark. The latter map represents the typical outcome of many flood detection methods that search for regions of low backscatter. In this case, the map has been obtained by applying the Otsu method (Otsu, 1979) directly to the CSK image of 10 January 2010.
From a visual comparison between the two maps shown in Fig. 5, the fairly large number of false alarms produced by the thresholding algorithm in the western part of the map can be noted. These false alarms are mostly due to shadow-ing effects that are not accounted for. Indeed, they occur in a hilly area as can be deduced by looking at the right panel of Fig. 4 that shows the DEM. Pixels affected by shadow-ing/layover can be flagged by using the DEM of the area and the available orbit information, as previously discussed, The
Fig. 5. Map of flooded areas for the Shkod¨er flood (10 January
2010). Left panel: map produced by our algorithm; right panel: map produced by a histogram thresholding method. White: non-flooded; cyan: flooded; blue: water bodies according to the land cover map; black: no-data.
most significant difference between the maps shown in Fig. 5 regards the area, close to the Shkod¨er Lake, that is identified by the orange ROI in Fig. 3. According to our classifica-tion this area is mostly flooded, whereas the thresholding al-gorithm assigns this area to the class of non-flooded pixels. This difference is due to the fact that we have introduced the condition of the increase of radar return caused by the double bounce backscattering that may happen in forests. Consider-ing that this area is close to the Shkod¨er Lake, that its altitude is low (see Fig. 4, right panel) and that it is surrounded by dark pixels (see Fig. 3, left panel), we trust our result.
The differences between the two maps shown in Fig. 5 are quantified in Table 3 in terms of the confusion matrix. The percentages of agreement are high for flooded and non-flooded areas, mainly because most of the agricultural ter-rains were bare when the flood occurred, so that searching for low backscattering areas has produced fairly good results for this case study. However, if we consider only the forests, the differences are large, as can be noted looking at Table 4, which is analogous to Table 3, but for forests only. In this case the 76.3 percent of pixels that are classified as flooded by our algorithm are assigned to the class of non-flooded ar-eas by the thresholding one.
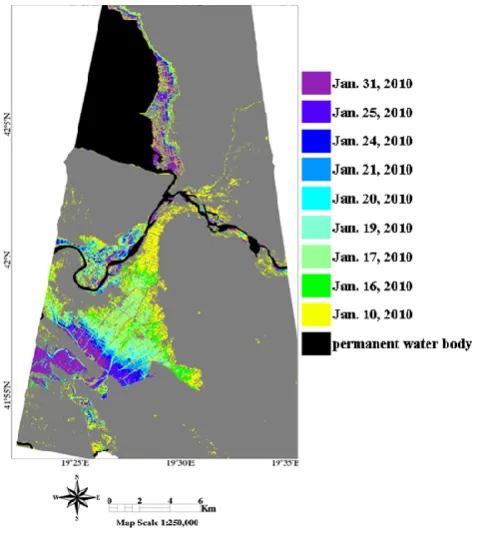
Fig. 6. Multi-temporal map showing the time evolution of the Shkod¨er flood. It has been produced by applying our algorithm to nine COSMO-SkyMed images whose acquisition dates are reported in the legend. White: no data; gray: non-flooded.
in the aforementioned websites. The most significant differ-ence regards again the area enclosed by the orange ROI in Fig. 3, which is considered as non-flooded by the classifica-tions found on the aforementioned websites.
The COSMO-SkyMed constellation offers a unique op-portunity to obtain radar data characterized by short revisit time, thus representing a powerful tool for flood evolution mapping. To give an example of this capability, we have ap-plied our algorithm to nine CSK images of the Shkod¨er area, acquired during the period 10 January–31 January 2010, pro-vided us by the ASI. In Fig. 6, a multi-temporal map rep-resenting time evolution of the Shkod¨er flood is shown, in which the gradual receding of water can be clearly observed with unprecedented time resolution.
5 Conclusions
A new algorithm based on a fuzzy classification approach producing maps of flooded areas using SAR data has been developed and integrated in a prototypical operational sys-tem for flood risk management. It allows a user either to quickly produce a classification map, or to perform fairly accurate, but possibly time consuming, flood boundary de-lineation. The software integrates the theoretical knowledge about the radar return from inundated areas taken into
ac-count by means of three well-established electromagnetic models of surface scattering, including hydraulic considera-tions and textural and contextual information in order to im-prove the classification accuracy.
The main novelty of the approach is its capability to detect not only open water surfaces, but also forested and agricul-tural flooded areas, thus allowing a user to cope with situ-ations in which inundation mapping generally represents a difficult task and requires a large amount of supervision in a simple manner. Indeed, if vegetation is composed by ce-real crops or forests with moderate biomass, our algorithm permits even unskilled users to automatically generate flood maps exploiting the electromagnetic knowledge introduced in the algorithm through the surface scattering models. In more complex environmental conditions, user interaction is required and allowed by the software.
The proposed algorithm can represent a valuable alterna-tive to simple thresholding methods or segmentation algo-rithms, thanks to its capacity to integrate different sources of information given by fuzzy logic. Even though it can operate at any frequency between L and X bands, particular atten-tion has been paid to the high resoluatten-tion X band COSMO-SkyMed data. Its application to a COSMO-COSMO-SkyMed obser-vation of the Shkod¨er flood occurred on January 2010 has provided fairly good results and improvement with respect to a thresholding procedure has been quantified. A multi-temporal map representing the time evolution of the flood has been also shown taking advantage of the short revisit time of COSMO-SkyMed constellation.
At the present status, the choice of the input ancillary data and of the number of land classes the algorithm is capable to manage and of the type of targets for which the fuzzy thresholds are determined, originate from a trade off between system complexity and performance. Future work will con-cern the update of the fuzzy thresholds, especially those suit-able for COSMO-SkyMed measurements, through an inte-gration of the electromagnetic simulations with an empirical data archive that could be built by ad-hoc programming the COSMO-SkyMed acquisitions in specific sites taking into account a larger number of vegetation types and land cover classes than those considered in this study. We plan also to include the roughening due to wind in the model of open wa-ter surfaces in order to produce reliable flood extent estimates also in the cases in which the contrast between land and water pixels is not very large. We expect that the aforementioned updates will decrease the number of situations in which user interaction is needed, although the availability of detailed in-formation on environmental conditions (e.g. wind speed and rain data, very detailed land cover maps) of the area involved in the flood may represent a critical aspect.
Acknowledgements. This work has been funded by the Italian
results obtained using COSMO-SkyMed data was requested of the ASI on 5 July 2010.
Edited by: F. Guzzetti
Reviewed by: two anonymous referees
References
Barber, D. G., Hocheim, K. P., Dixon, R., Mosscrop, D. R., and Mcmullan, M. J.: The role of earth observation technologies in flood mapping: A Manitoba case study, Can. J. Remote Sens., 22, 137–143, 1996.
Boni, G., Candela, L., Castelli, F., Dellepiane, S., Palandri, M., Persi, D., Pierdicca, N., Rudari, R., Serpico, S., Siccardi, F., and Versace, C.: The OPERA project: EO-based flood risk man-agement in Italy, Proc. IEEE/IGARSS 2009, Cape Town South Africa, 2009.
Bracaglia, M., Ferrazzoli, P., and Guerriero, L.: A fully polarimetric multiple scattering model for crops, Remote Sens. Environ., 54, 170–179, 1995.
Brakenridge, G. R., Knox, J. C., Paylor, E. D., and Magilligan, F. J.: Radar remote sensing aids study of the great flood of 1993, EOS Transaction American Geophysical Union, 75, 526–527, 1994. Covello, F., Battazza, F., Coletta, A., Lopinto, E., Fiorentino, C.,
Pietranera, L., Valentini, G., and Zoffoli, S.: COSMO-SkyMed an existing opportunity for observing the Earth, J. Geodyn., 49, 171–180, 2010
Della Vecchia, A., Ferrazzoli, P., Guerriero, L., Dente, L., Mattia, F., Satalino, G., Strozzi, T., and Wegm¨uller, U.: Influence of ge-ometrical factors and permittivity models on crop backscattering at C band, IEEE T. Geosci. Remote, 44, 778–790, 2006. Ferrazzoli, P. and Guerriero, L.: Radar sensitivity to tree geometry
and woody volume: a model analysis, IEEE T. Geosci. Remote, 33, 360–371, 1995.
Ferrazzoli, P., Wigneron, J. P., Guerriero, L., and Chanzy, A.: Mul-tifrequency emission of wheat: modeling and applications, IEEE T. Geosci. Remote, 38, 2598–2607, 2000.
Franceschetti, G., Iodice, A., and Riccio, D.: A canonical prob-lem in electromagnetic backscattering from buildings, IEEE T. Geosci. Remote, 40, 1787–1801, 2002.
Frost, V. S., Stiles, J. A., Shanmugan, K. S., and Holtzman, J. C.: A model for radar images and its application to adaptive digi-tal filtering of multiplicative noise, IEEE Transaction on Pattern Analysis and Machine Intelligence, 4, 157–166, 1982.
Henry, J. B., Chastanet, P., Fellah, K., and Desnos, Y. L.: ENVISAT multi-polarised ASAR data for flood-mapping, Int. J. Remote Sens., 27, 1921–1929, 2006.
Hess, L. L., Melack, J. M., and Simonett, D. S.: Radar detection of flooding beneath the forest canopy: A review, Int. J. Remote Sens., 11, 1313–1325, 1990.
Hess, L. L., Melack, J. M., Filoso, S., and Wang, Y.: Delineation of inundated area and vegetation along the Amazon floodplain with the SIR-C synthetic aperture radar, IEEE T. Geosci. Remote, 33, 896–904, 1995.
Horritt, M. S., Mason, D. C., and Luckman, A. J.: Flood boundary delineation from synthetic aperture radar imagery using a statis-tical active contour model, Int. J. Remote Sens., 27, 1921–1929, 2001.
Karmakar, G. C. and Dooley, L.: A generic fuzzy rule based image segmentation algorithm, Pattern Recogn. Lett., 23, 1215–1227, 2002.
Martinis, S., Twele, A., and Voigt, S.: Towards operational near real-time flood detection using a split-based automatic threshold-ing procedure on high resolution TerraSAR-X data, Nat. Hazards Earth Syst. Sci., 9, 303–314, doi:10.5194/nhess-9-303-2009, 2009.
Mason, D. C., Speck, R., Devereux, B., Schumann, G., Neal, J. C., and Bates, P. D.: Flood Detection in Urban Areas Using TerraSAR-X, IEEE T. Geosci. Remote, 48, 882–894, 2010. Nico, G., Pappalepore, M., Pasquariello, G., Refice, A., and
Samarelli, S.: Comparison of SAR amplitude vs. coherence flood detection methods- a GIS application, Int. J. Remote Sens., 21, 1619–1631, 2000.
Otsu, N.: A threshold selection method from gray-level histograms, IEEE Transactions on Systems, Man, and Cybernetics, 9, 62–66, 1979.
Pal, S. K. and Rosenfeld, A.: Image enhancement and thresholding by optimization of fuzzy compactness, Pattern Recogn. Lett., 7, 77–86, 1988.
Pierdicca, N., Chini, M., Pulvirenti, L., and Macina, F.: Integrating Physical and Topographic Information into a fuzzy scheme to Map Flooded Area by SAR, Sensors, 8, 4151–4164, 2008. Pulvirenti, L., Pierdicca, N., and Chini, M.: Analysis of
COSMO-SkyMed observations of the 2008 flood in Myanmar, Italian Jour-nal of Remote Sensing, 42, 79–90, 2010.
Pulvirenti, L., Chini, M., Pierdicca, N., Guerriero, L., and Fer-razzoli, P.: Flood monitoring using multi-temporal COSMO-SkyMed data: image segmentation and signature interpreta-tion, interpretainterpreta-tion, Remote Sens. Environ., 115(4), 990–1002, doi:10.1016/j.rse.2010.12.002, 2011.
Rignot, E. J. M. and van Zyl, J. J.: Change detection techniques for ERS-1 SAR data, IEEE T. Geosci. Remote, 31, 896–906, 1993. Sanyal, J. and Lu, X. X.: Application of remote sensing in flood
management with special reference to monsoon Asia: A review, Nat. Hazards, 33, 283–301, 2004.
Schumann, G., Hostache, R., Puech, C., Hoffmann, L., Matgen, P., Pappenberger, F., and Pfister, L.: High-Resolution 3-D Flood In-formation From Radar Imagery for Flood Hazard Management, IEEE T. Geosci. Remote, 45, 1715–1725, 2007.
Schumann, G., Di Baldassarre, G., and Bates, P. D.: The Utility of Spaceborne Radar to Render Flood Inundation Maps Based on Multialgorithm Ensembles, IEEE T. Geosci. Remote, 47(8), 2801–2807, 2009a.
Schumann, G., Bates, P. D., Horritt, M. S., Matgen, P., and Pap-penberger, F.: Progress in integration of remote sensing–derived flood extent and stage data and hydraulic models, Rev. Geo-physics, 47, RG4001, doi:10.1029/2008RG000274, 2009b. Smith, L. C.: Satellite remote sensing of river inundation area,
stage, and discharge: a review, Hydrol. Process., 11, 1427–1439, 1997.
Ulaby, F. T. and Dobson, C.: Handbook of Radar Scattering Statis-tics for Terrain, Artech House, 1989.