Page 25 www.ijiras.com | Email: [email protected]
Impacts Of Smartphone: A Data Mining Case Study In Theni
District
P. Suganya
PG Student, Dept of Computer Science, Jayaraj Annapackiam College for Women (Autonomous),
Periyakulam, Theni Dt, TamilNadu, India
R. Gowsalya Devi
Asst.Professor, Dept of Computer Science, Jayaraj Annapackiam College for Women (Autonomous),
Periyakulam, Theni Dt
I. INTRODUCTION
India is rapidly advancing in the technological space. With the growing population and increasing smart phone penetration, India is going towards the mobile and digital technology. Smartphone and internet is not just for the rich and wealthy but more users are becoming informed by getting access of mobile internet. However, the growth is still not at pair with other countries.
Smartphone systems are a way of providing portable communication services. Each smart phone is connected by a radio link and base station. In turn, this is linked to the mobile phone network, which is the largest machine on the planet. India is the second largest smart phone user with over 900 million users in the world. It accounted for over 10% of the world‟s online population in 2011. Smartphone telecommunications have seen tremendous growth in India. This growth has been inclusive with benefits accruing to the poorest households in the remotest regions of the country. This smart phone tariffs in India have become among the lowest in the world. A new mobile connection can be activated with a monthly commitment of 15 cents only.
A. SIGNIFICANCE OF THE STUDY
The Smart phone continues to evolve and advance with time. As of 2015, the most recent phone comes with 4G Generation (4G) technology. This allows users to download Music, watch video and join video conference as faster speeds. Those who want quick access to email, news and instant messaging will want to use 4G.Even with its pros and cons, Smartphone will continue to be a part of users‟ lives. People often overlook its health risks and security risks way to stay connected.
An average Indian spends almost 5 hours accessing internet and out of the 3 hours spend on mobile internet, only 45 minutes are spent doing any other work apart from social media. Unsurprising, since Facebook claims that it has 100 million users in India, out of which 84 million accesses the site or app on their smart phones.
While these technologies capture attention and have usability and easiness of everyday life. Furthermore, feelings of loneliness, isolation or, boredom can be replaced with the pleasure of free flow of electronic delights. It brings together worlds miles asunder. The majority of mobile users in India are aged 24 years below and they are almost male. Indian
Abstract: The intention of this study is to investigate how Smartphones are impacting in Theni district and also this study is to understand all the positive and negative aspects of Smartphone in Theni district. The aim of this study was to review the impact of smartphones on academic performance of people in Theni district. At the end, the study will summarize the impact and conclude based on wide range of impacts that Smartphones have in Theni district. The paper will also recommend solutions, in order to reduce the negative impacts of Smartphones and realizes more benefits of this exiting technology.
Page 26 www.ijiras.com | Email: [email protected] telecom industry has seen exponential growth in the recent
years.
B. OBJECTIVES OF THE STUDY
The objective of the study is to investigate the impact of smart phones in Theni district. This is a case study of magnitude and listing the impact of smart phones among people.
To analyze the common impact of smart phones
To mention the frequently impressed factor of the smart phones
To provide the causes and advantages of those commonly mentioned factor
C. NULL HYPOTHESIS
In this case study, I assume some hypothesis. These hypothesis are based only the impacts of smart phone among the people in Theni district. They are:
Management of financial, career, family and social problems are caused by smart phone use.
No association between the male and female those who are using smart phone.
II. RESEARCH METHODOLOGY
A. METHODOLOGY
The case study will consist of deferent stages, roughly following the cross industry standard procedure CRISP-DM. Firstly, the business understanding phase has to be carried out. In this phase, the project objectives and requirements are stated and reined and the resulting data mining problem is formulated. The results of this phase are summarized in the previous sections. Although the collection of additional data results in a richer data set and is therefore likely to give better results, model acting on a data set that is already automatically kept up-to-date is potentially a much more useful tool.
DESIGN FOR METHODOLOGY
A multiple case study design with historical and cross-sectional perspectives was adopted. According to Patton (1987) a project is a case study design when it seeks to capture rich and unique experiences as they happen in reality. Merriam (1998) indicates that a historical case study is essentially descriptive and deals with developments in the past. Yin (1994) points out that a case study design is cross-sectional to the extent that it examines “how” and “why” questions in a contemporary set of events. To the extent that this study attempts to reflect upon historical and cross-sectional events as reconstructed by subjects or respondents it is a survey research, and since it aims to include investigations from more than a single case it is a multiple case study design. The implementation of the study has been framed around the following procedures:
Developing a research proposal and instruments for data collection,
Creating contact with respective educational bureaus, Selecting research settings and sampling the research
population or respondents, Pre-testing instruments,
Administering instruments and completing data collection,
Analyzing and interpreting data, and writing a report.
B. ALGORITHM USED CLUSTER ANALYSIS
Cluster analysis is a multivariate analysis that attempts to form groups or “clusters “of objects (Sample plots in our case) that are “similar” to each other but which differ among clusters. The exact definition of “similar” is variable among algorithms. But has a generic basis. The methods of forming clusters also vary, but follow a few general blueprints.
SIMILARITY, DISSIMILARITY AND DISTANCE
Similarity is a characterization of the ratio of the number of attributes two objects share in common compared to the total list of attributes between them. Objects which have everything in common are identical, and have a similarity of 1.0. Objects which have nothing in common have a similarity of 0.0. As we have discussed previously, there is a large number of similarity indices proposed and employed, but the concepts are common to all.
Dissimilarity is the complement of similarity and is a characterization of the number of attributes two objects have uniquely compared to the total list of attributes between them. In general, dissimilarity can be calculated as 1- similarity.
K-MEANS CLUSTERING
The most common partitioning method is the K-means cluster analysis.
Conceptually, the K-means algorithm:
Selects K cancroids (K rows chosen at random) Assigns each data point to its closest centroid
Recalculates the centroids as the average of all data points in a cluster (i.e.,the centroids are p-length mean vectors, where p is the number of variables)
Assigns data points to their closest centroids
Continues steps 3 and 4 until the observations are not reassigned or the maximum number of iterations(R uses 10 as a default) is reached.
IMPLEMENTATION DETAILS FOR THIS APPROACH CAN VARY
R uses an efficient algorithm by Hartigan and Wong (1979) that partitions the observations into k groups such that the sum of squares of the observations to their assigned cluster centers is a minimum. This means that in steps 2 and 4, each observation is assigned to the cluster with the smallest value
of: n p
SS (K) = (Xij - Xkj) 2 ∑npi=1, j=1
Page 27 www.ijiras.com | Email: [email protected] K-means clustering can handle larger datasets than
hierarchical cluster approaches. Additionally, observations are not permanently committed to a cluster. They are moved when doing so improves the overall solution. However, the use of means implies that all variables must be continuous and the approach can be severely affected by outliers. They also perform poorly in the presence of non- convex (e.g., U-Shaped) clusters.
The format of the K-means function in R is k-means(x, clusters) where x is a numeric dataset (matrix or data frame0 and centers is the number of clusters to extract. The function returns the cluster memberships, centroids, sums of squares (within, between, total), and cluster sizes.
Since K-means cluster analysis starts with k randomly chosen centroids, a different solution can be obtained each time the function is invoked. Use the set. Seed () function to guarantee that the results are reproducible. Additionally, this clustering approach can be sensitive to the initial selection of centroids. The k means() function has an start option that attempts multiple initial configurations and reports on the best one. For example, adding nstart=25 will generate 25 initial configurations. This approach is often recommended.
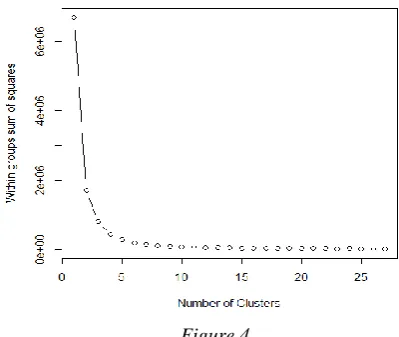
Unlike hierarchical clustering, K means clustering requires that the number of clusters to extract be specified in advance. Again the NbClust package can be used as a guide. Additionally, a plot of the total within-groups sums of squares against the number of clusters in a K-means solution can be helpful. A bend in the graph can suggest the appropriate number of clusters.
III. FINDING, INTERPRETATION, RECOMMENDATIONS AND SUGGESTIONS
A. FINDING AND INTERPRETATIONS
GENDER BASED ON SMARTPHONE USAGE
200 220 240 260 280
Male Female
Chart Title
Figure 1
AGE BASED ON SMARTPHONE USAGE
Figure 2
MARITAL STATUS
Figure 3
PARTITIONING FOR CLUSTERING
> for (i in 2:27) wss[i] <-
sum(kmeans(temp,centers=i)$withinss)
> plot(1:27, wss, type="b", xlab="Number of Clusters", ylab="Within groups sum of squares")
Figure 4
HIERARCHICAL AGGLOMERATIVE
Page 28 www.ijiras.com | Email: [email protected] Figure 5
FINDING STANDARD ERRORS
Figure 6
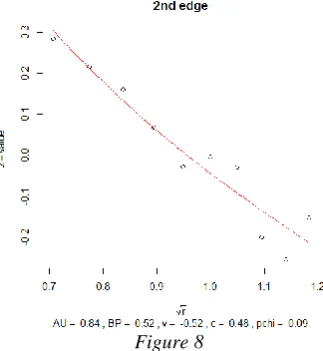
FINDING PLOTS FOR EDGE
Msplot(fit, edges=2) Msplot(fit, edges=12)
Figure 7
Figure 8
MODEL BASED CLUSTERING
library(mclust) fit <- Mclust(mydata) plot(fit)
Model-based clustering plots: BIC
classification uncertainty density
SELECTION: 1
Figure 9
SELECTION: 2
Page 29 www.ijiras.com | Email: [email protected] SELECTION: 3
Figure 11
SELECTION: 4
Figure 12
Selection: Enter an item from the menu, or 0 to exit
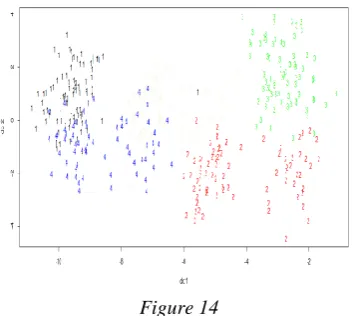
PLOTTING CLUSTER SOLUTIONS
fit <- kmeans(mydata, 5) library(cluster)
clusplot(mydata, fit$cluster, color=TRUE, shade=TRUE, labels=2, lines=0)
Figure 13 library(fpc)
plotcluster(mydata, fit$cluster)
Figure 14
VALIDATING CLUSTER SOLUTIONS
df<-scale(mydata[-1]) > wssplot(df)
Figure 15
> nc <- NbClust(df, min.nc=2, max.nc=5, method="kmeans")
Figure 16 table(nc$Best.n[1,])
0 1 2 3 4 5 2 1 7 5 4 7
Page 30 www.ijiras.com | Email: [email protected] Figure 17
B. RECOMMENDATIONS
This study reveals that teenagers and young adults using mobile phones for coordinating their social life and subsequent distraction.
Media taking a lead role in bringing to the knowledge of the general public and negative consequences of smartphone usage and tips to tackle such consequences. Smartphone maker and service providers researching on
the social context of teenagers,mobile phone usage and then promoting products or services suitable to the research findings.
C. SUGGESTIONS FOR FURTHER STUDY
It is true that Smartphone has a sizeable impact in Theni district and other aspects of life. Consumers are in process of traversing away from the use of conventional cell phone as the Smartphone„s are beginning the norm of the society. Manufacturers and marketing can be blamed for this hype, but there is no doubt that Smartphone„s are brining great features and capabilities to consumers. The key impacts like enable to be always-connected, addiction to phone, single device with all required features, business edge, convenient educational features, apps as new technology, entertainment, best utilization of time, disrespectful behavior, privacy issues, impact on culture, distraction at work & at education Institutes and many more provide us both positive and negative sides of the Smartphone„s.
This will enable users to use their phones if it is really required and when the use is really important. In summary, Smartphone can certainly be smart if the vendors, society and technologists understand their responsibility towards usage of these devices smartly in order to get more benefit in business, education, health and social life. It is apparent from above facts that the benefits of Smartphone are tremendous and negative impacts are minor. So it is important to concentrate on how to stop and avoid smartly the misuse of Smartphone rather trying to stop or avoid use to Smartphone„s.
REFERENCES
[1] Pei Zheng, Lionel M. Ni, 2006, ―Smart Phone and Next Generation Mobile Computing‖,
http://www.sciencedirect.com/science/book/97801208856 02
[2] Techterms.com, 2010,
http://www.techterms.com/definition/smartphone
[3] Nurfit, 2012,‖Smarphone Addiction and Impact on Society‖,
http://nurfitriah.wordpress.com/2012/03/25/smarphone-addiction/
[4] ComScore, Inc, 2012, ―2012 Mobile Future in Focus‖, http://www.comscore.com/Insights/Press_Releases/2012/ 2/comScore_Releases_the_2012_Mob
ile_Future_in_Focus_Report
[5] Brad Reed, 2010, ―A brief history of Smartphone„s‖, http://www.networkworld.com/slideshows/2010/061510-smartphone-history.html#slide1
[6] James Niccolai, Nancy Gohring, 2010,‖A Brief History of Palm‖,
http://www.pcworld.com/article/195199/article.html [7] Wikipedia, 2012, ―Blackberry‖,
http://en.wikipedia.org/wiki/BlackBerry
[8] Hamza Querashi, 2012, ―Apple: from iPhone 1 to iPhone 5 – Evolution, Features and Future Review‖, http://www.thenewstribe.com/2012/07/16/apple-from- iphone-1-to-iphone-5evolution-features-and-future-review/
[9] Sam Costello, retrieved on 2012, ―First-Generation iPhone Review‖,
http://ipod.about.com/od/iphoneproductreviews/fr/iphone _review.htm
[10] Chris Ziegler, 2011, ―Android: A visual history‖, http://www.theverge.com/2011/12/7/2585779/android-history
[11] Mark Prigg, 2012,‖ Microsoft launches Windows 8 Phone software - and hopes apps and Jessica
Alba will help it take on Apple and Google‖,
http://www.dailymail.co.uk/sciencetech/article- 2225149/Windows-8-phone-software-launchMicrosoft-hopes-Jessica-Alba-help-Apple-Google.html
[12] Strategy Analytics, 2012,‖ Global Mobile Media Revenues To Touch $150 Billion In 2012‖, http://www.strategyanalytics.com/default.aspx?mod=pres sreleaseviewer&a0=5206
[13] Md. Rashedul Islam, Md. Rofiqul Islam,Tahidul Arafhin Mazumder, 2010, ―Mobile Application and Its Global Impact‖, International Journal of Engineering & Technology, IJET-
![Figure 17 [4] ComScore, Inc, 2012, ―2012 Mobile Future in Focus‖, http://www.comscore.com/Insights/Press_Releases/2012/2/comScore_Releases_the_2012_Mob](https://thumb-us.123doks.com/thumbv2/123dok_us/1406443.1653005/6.595.63.246.80.227/figure-comscore-mobile-comscore-insights-releases-comscore-releases.webp)
