The Prediction of Solute Concentration by
Neural Network
Shen-Whan Chen
1, Chao-Fan Xie
2, Chum-Yi Wu
3, Shuming T. Wang
4, Rey-Chue Hwang
51Department of Communication Engineering, I-Shou University, Kaohsiung, Taiwan
2
Department of Electrical Engineering, I-Shou University, Kaohsiung, Taiwan
Electronic information and Engineering Institute, Fuqing Branch of Fujian Normal University, FuJian, China 3,4,5Department of Electrical Engineering, I-Shou University, Kaohsiung, Taiwan
Abstract- This paper presents a study about the possibility of the prediction of constituent concentration in a two-component (salicylic acid and caffeine) mixture by using neural network (NN). It is an important step for developing a smart SMB automatic control mechanism with the precision control ability. From the experimental results shown, it is conformed that the individual constituent concentration indeed can be accurately predicted via the absorbance of ultraviolet (UV) light at different wavelengths by using the well-trained neural network model.
Keywords –Prediction, Concentration, Mixture, Neural Network
I.INTRODUCTION
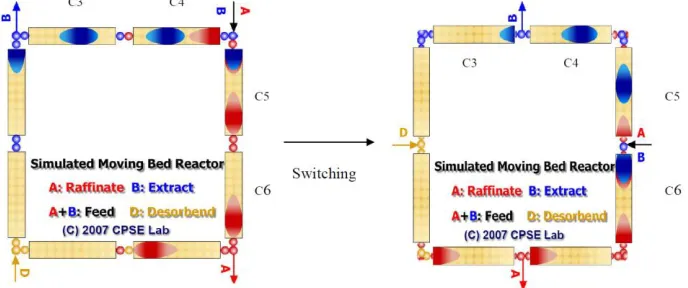
Chromatography is a method which can separate the components of a mixture based on the different characteristics of components. It has been widely applied into the chemical and biomedical industries. Chromatography has become a most important technique in the biomedical and pharmaceutical industries. Fig. 1 shows the diagram of chromatographic separation process [1-2].
In recent years, SMB has become the most advanced technology in the chromatographic separation process due to its continuous feeding ability. The advantages of multi-column SMB technology includes that not only the productivity can be increased, the consumption of solvent and water can also be decreased. Thus, SMB has been recognized as the cleanest manufacturing technology in the biomedical and pharmaceutical industries. Fig. 1 is the example of SMB operation [3].
Due to the complexity of SMB, the precision control of SMB is always a problem in its practical using. Even many researchers in this area have done lots of works on it, but still have no good results [4-10]. So far, there is no commercial SMB automatic control software can be found in the market. Only some simple and self-developed control software for the specific components’ separation were developed by a few users.
Figure 1. The example of SMB operation.
This intelligent control mechanism is expected to have the self-learning and adaptive abilities. It will enable the SMB’s control could be operated at the best condition in any time. Not only the productivity can be increased, the production cost can also be reduced.
II.SMBMODEL
In fact, the traditional SMB dynamic mathematical model is deduced by using TMB model. Here, we give an overview of SMB dynamic model [11-12]. For TMB, the mass balance of bulk phase is:
2 , , * , * 2 1 ( ) j
i j i j i j
i i ij ij
C C C
D v k q q
t x x
(1)
,
(
*)
i j
s ij i ij ij
q
u q
k q
q
t
x
(2)Where, i is the ithcomponent of mixing, j is the jth segments, x is the moving direction and distance,
k
i is a comprehensive mass transfer constant, vj is the velocity of body in the section j,u
sis solid flow rate, Ci j, is the fluid phase concentration of component i in section j,q
i j, is the solid phase concentration of component i in section j. *,
i j
q is the solid phase concentration at equilibrium between solid phase and liquid phase in component i in section j. In SMB system, there may be more than one adsorption bed in each section, and the region will be changed with the node switching. So redefining adsorption bed k,
v
j*is the flow rate of fluid in bed j, *Qj is the volume flow rate in bed j. Therefore, TMB and SMB can be converted to each other as follows:
2 , , * , * 2
1
(
)
ji j i j i j
i i ij ij
C
C
C
D
v
k q
q
t
x
x
(3)
, *
(
)
i j
i ij ij
q
k q
q
t
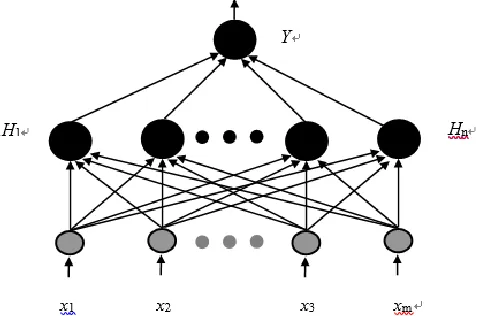
(4)III.NEURALNETWORKMODEL
have the fixed flow rate. The reactive absorbances of UV light are different to these mixtures. Fig. 3 and Fig. 4 are the examples of UV light intensities of four different concentrations of salicylic acid (A) and caffeine (B), respectively.
Figure 3. The UV intensities for four different concentrations of salicylic acid (A).
Figure 4. The UV intensities for four different concentrations of caffeine (B).
In this experiment, 64 solutions with different salicylic acid and caffeine concentrations are made. Let all solutions flow through three columns of SMB system and then collect 64 data sets of UV absorbance. In order to ensure the correctness of the experiment we did, the original data are reorganized randomly to generate two data sets, i.e. Group-1 and Group-2. For each group, 42 data are used as training of NN and the rest of 22 data are used as test. The size of NN is 114-250-1. The 114 inputs are all UV light absorbances. The mean absolute percentage error (MAPE) is used to be the experimental measurement. Table 1 shows the MAPEs of concentration predictions of salicylic acid and caffeine.
Table 1. : The MAPEs of concentration predictions of salicylic acid and caffeine.
Salicylic acid Caffeine
Training (MAPE)
Test (MAPE)
Training (MAPE)
Test (MAPE)
Group-1 1.18% 1.87% 0.98% 1.70%
Group-2 1.41% 2.01% 1.27% 1.73%
(a) (b)
Figure 5. The predictions of salicylic acid and caffeine concentrations performed by NN for Group-1. (Solid line: Desired value. Dot line: Predicted value.)
(a) (b)
Figure 6. The predictions of salicylic acid and caffeine concentrations performed by NN for Group-2. (Solid line: Desired value. Dot line: Predicted value.)
V.CONCLUSION
This paper presents a study about the prediction of constituent concentration in a two-component mixture by using NN technique. The experimental results show that the individual constituent concentration indeed can be accurately predicted via the absorbance of UV light by the well-trained NN model. It means the instant separation process and operation state of SMB can be precisely predicted. This result gives a great encouragement for the study of SMB precision control in the future.
VI.ACKNOWLEDGMENT
This research was supported by the Ministry of Science and Technology, Taiwan, R.O.C. under Contract No. MOST-107-2221-E-214-029.
VII.REFERENCES [1] http://www.ch.ntu.edu.tw/~genchem99/doc/97_C27_chromatography_web.pdf. [2] www.slvs.tc.edu.tw/125/20120919020319.ppt.
[3] http://www.asia-giant.com.tw/tw_technologr_b03.html.
[10] A. S. Andrade Neto, A. R. Secchi, M. B. Souza, A. G. Barreto, “Nonlinear model predictive control applied to the separation of praziquantel in simulated moving bed chromatography”, Journal of Chromatography A, pp. 42-49, 2016.
[11] M. T. Liang, R .C. Liang, L. R. Huang, K. Y. Liang, Y. L. Chien, J. Y. Liao, “Supercritical fluids as the desorbent for simulated moving bed – Application to the concentration of triterpenoids from Taiwanofugus camphorate”, Journal of the Taiwan Institute of Chemical Engineers, Vol. 45, pp.1225-1232, 2014
[12] M. T. Liang, R. C. Liang, L. R. Huang, P. H. Hsu, Y. H. Wu, H. E. Yen, “Separation of sesamin and sesamolin by a supercritical fluid-simulated moving bed”, American Journal of Analytical Chemistry, Vol. 3, pp.931-938, 2012.
[13] D. E. Rumelhart, G. E. Hinton and R. J. Williams, “Learning internal representations by error propagation”, Parallel Distributed Processing, Vol. 1, MIT Press, 1986.
[14] A. Khotanzad, R. C. Hwang, A. Abaye, and D. Maratukulam, “An adaptive modular artificial neural network: Hourly load forecaster and its implementation at electric utilities”, IEEE Trans. on Power Systems, Vol. 10, No. 3, pp. 1716–1722, 1995.