ISSN: 2278-7461, www.ijeijournal.com
Volume 1, Issue 6 (October2012) PP: 21-31
Properties of Concrete with Coconut Shells as Aggregate
Replacement
Amarnath Yerramala
aRamachandrudu C
b a,bStructures and Materials laboratory Department of Civil Engineering, Intell Engineering College, Anantapur, India
Abstract––Properties of concrete with coconut shells (CS) as aggregate replacement were studied. Control concrete with normal aggregate and CS concrete with 10 - 20% coarse aggregate replacement with CS were made. Two mixes with CS and fly ash were also made to investigate fly ash effect on CS replaced concretes. Constant water to cementitious ratio of 0.6 was maintained for all the concretes. Properties like compressive strength, split tensile strength, water absorption and moisture migration were investigated in the laboratory. The results showed that, density of the concretes decreases with increase in CS percent. Workability decreased with increase in CS replacement. Compressive and split tensile strengths of CS concretes were lower than control concrete. Permeable voids, absorption and sorption were higher for CS replaced concretes than control concrete. Coarse aggregate replacement with equivalent weight of fly ash had no influence when compared with properties of corresponding CS replaced concrete.
Keywords––civil engineering; construction materials; compressive strength coconut shells; concrete, environment; sustainability.
INTRODUCTION
Infrastructure development across the world created demand for construction materials. Concrete is the premier civil engineering construction material. Concrete manufacturing involve consumption of ingredients like cement, aggregates, water and admixture(s). Among all the ingredients, aggregates form the major part. Two billion tons of aggregate are produced each year in the United States. Production is expected to increase to more than 2.5 billion tons per year by the year 2020 [1]. Similarly, the consumption of the primary aggregate was 110 million tonnes in the UK in year 1960 [2] and reached nearly 275 million tonnes by 2006 [3]. Use of natural aggregate in such a rate leads to a question about the preservation of natural aggregates sources. In addition, operations associated with aggregate extraction and processing are the principal causes of environmental concerns [4]. In light of this, in the contemporary civil engineering construction, using alternative materials in place of natural aggregate in concrete production makes concrete as sustainable and environmentally friendly construction material. Different alternative waste materials and industrial by products such as fly ash, bottom ash, recycled aggregates, foundry sand, china clay sand, crumb rubber, glass were replaced with natural aggregate and investigated properties of the concretes [5-10]. Apart from above mentioned waste materials and industrial by products, few studies identified that coconut shells, the agricultural by product can also be used as aggregate in concrete [11,12]. According to a report, coconut is grown in more than 86 countries worldwide, with a total production of 54 billion nuts per annum. India occupies the premier position in the world with an annual production of 13 billion nuts, followed by Indonesia and the Philippines [13]. Limited research has been conducted on mechanical properties of concrete with coconut shells as aggregate replacement [11,12]. However, further research is needed for better understanding of the behaviour of coconut shells as aggregate in concrete. Furthermore, there is no study available in the literature on the transport properties which determine durability of the concrete. Thus, the aim of this work is to provide more data on the strengths of coconut shell concretes at different coconut shells (CS) replacements and study the transport properties of concrete with CS as coarse aggregate replacement. Furthermore, in this study, the effect of fly ash as cement replacement and aggregate replacement on properties of the CS replaced concrete was also investigated.
EXPERIMENTAL INVESTIGATIONS
2.1. Materials2.2. Mix proportions
In order to investigate properties of CS concretes, six mixes were employed. Control mix (M1) that is, without CS was made. Coarse aggregate was then replaced with CS in 10 (M2), 15 (M3), 20 (M4) percentages to study effect of CS replacement. Furthermore, a mix with both CS and fly ash (M5) was also employed, in which, 20% of CS was replaced with aggregate and 25% of fly ash was replaced with cement. M6 mix contained 20% of coconut shells and 5% of fly ash both replaced with aggregate. Free water to cementitious ratio was maintained constant at 0.6 for all concrete mixes. Extra water was added in the mixes depending on the CS replacement to compensate water absorption of the CS particles. The details of the mixture proportions used for the concretes are given in Table 3.
2.3. Mixing, compaction, specimen preparation and curing
The concretes were mixed in a planetary mixer of 100 l capacity. The mixing time kept to about 3 to 4 min. Mixing of the materials was in a sequence: (i) portion of design water poured into mixture drum; (ii) cement gently placed; and (iii) aggregate and CS was spread over the cement and started mixing. During mixing, the remaining design water was poured into the mix for thorough mix of concretes. Specimens were then prepared and left for 24 hours. The specimens were demoulded after 24 hours and immersed in normal water for curing until the test age.
3. TEST PROGRAM
The main objective of the present investigation was to study the performance of CS concretes in terms of strength and transport properties with normal water curing and with no chemical admixtures in the mixes. Performance of the concretes was assessed through: compressive strength, split tensile strength, water absorption and sorption. The specimens were tested for compression and split tensile strengths at 1, 7 and 28 days. The strengths were obtained by considering the average of two replicate specimens. However, if the variation of any individual value from the average was greater than 10 %, a third specimen was tested. Absorption and sorption tests were conducted at 28 days of curing. These tests were also conducted on two replicate specimens and the average values were reported.
3.1. Compressive strength studies
The compressive loading tests on concretes were conducted on a compression testing machine of capacity 2000 kN. For the compressive strength test, a loading rate of 2.5 kN/s was applied as per IS: 516–1959 [16]. The test was conducted on 150mm cube specimens at 1, 7 and 28 days.
3.2. Split Tensile Strength
Split tensile strength test was conducted in accordance with ASTM C496 [17]. Cylinders of 100 x 200 mm size were used for this test, the test specimens were placed between two platens with two pieces of 3 mm thick and approximately 25 mm wide plywood strips on the top and bottom of the specimens. The split tensile strength was conducted on the same machine on which the compressive strength test was performed. The specimens were tested for 1, 7 and 28 days.
3.3. Permeable voids and water absorption studies
An absorption study was conducted to understand the relative porosity permeable void space of the concretes, in according to ASTM C 642-82 [18]. The absorption and permeable voids tests were conducted on two 150 mm cubes. Saturated surface dry specimens were kept in a hot air oven at 105 oC until a constant weight was attained. The ratio of the difference between the mass of saturated surface dry specimen and the mass of the oven dried specimen at 105oC to the volume of the specimen gives the permeable voids in percentage as:
Permeable voids = (A-B)/V*100
where A is the weight of surface dried saturated sample after 28 days immersion period. B is the weight of oven dried sample in air. V is the volume of sample.
The specimens removed from the oven were allowed to cool to room temperature. These specimens were then completely immersed in water and weight gain was measured until a constant weight was reached. The absorption at 30 min (initial surface absorption) and final absorption (at a point when the difference between two consecutive weights was almost negligible) were reported to assess the concrete quality. The final absorption for all the concretes was observed to be at 72 h.
3.3. Sorption test
The sorption test was conducted on the concretes in order to characterize the rate of moisture migration of water into the concrete pores. One hundred fifty millimetre cube specimens were marked on all four sides at 10 mm interval to measure the moisture migration. As explained in the water absorption test, the specimens were oven-dried. They were then allowed to cool down to the room temperature. After cooling, the cubes were placed in water on the wedge supports to make sure that only the bottom surface of the specimens was in contact with the water. A cotton cloth was covered on top of the wedge supports to ensure the specimens are in contact with water throughout the test period. Moisture rise in the cubes was measured through the weight gain of the specimen ate the regular intervals. The sorption of the concretes was thus calculated using linear regression between the weight gain of specimen per unit area of concrete surface in contact with water and square root of time for the suction periods.
4. RESULTS AND DISCUSSION
4.1. Properties of fresh concrete
Visual observations during mixing and compaction of all the concretes suggested that the concretes were homogeneous; there was no segregation and bleeding, the mixes were compactable. The fresh state performance of the CS concretes was comparable with control concrete. The concretes had low slump the slump values of the concretes were between 20-26mm. The slump decreased with increase in CS percentage. However, for M5 mix, in which, the cement content was replaced with 5% of fly ash had 25% CS shown little better performance over M4. Furthermore, M6 mix, in which, the total aggregate was replaced with 5% of fly ash and had 25% CS shown highest slump value.
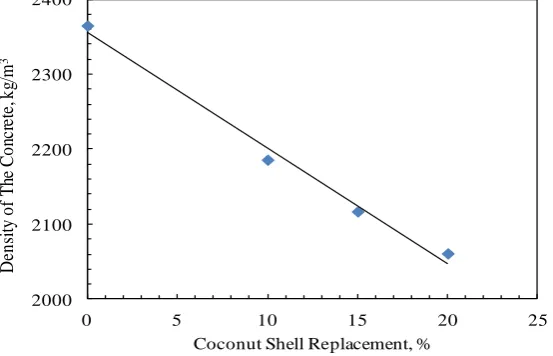
This observation suggests that addition of CS decreases workability and addition of fly ash either as cement replacement or aggregate replacement increases workability in CS concrete. The decreased workability of CS concretes may be due to CS particle shape. Flat shaped CS particles could have restricted overall movement of the aggregate particles and thus reduced workability. The densities of fresh concretes were also tested (Table 4). Figure 2 shows relationship between density of the concrete and CS replacement, there was good relationship between the variables. As can be seen in the figure, with increase in CS percentage the densities were decreased. Decreased densities of CS concretes could be attributed to direct consequence of specific gravities of the materials. The specific gravity of normal aggregate was around 2.6, whereas, specific gravity of CS shells was 1.33.
4.2. Compressive strength
Table 4 shows the compressive strengths of all the concretes for 1, 7 and 28 days of curing. The strength of all the concretes increased with curing age. Control concrete gained 31 percent and 50 percent over its 28 day compressive strength at one day and 7 days of curing respectively. Strength of the CS concretes increased 24-42 percent at one day and 38-84 percent after 7 days of curing than its corresponding 28 day strengths respectively. This observation suggests that as CS percentage increased the 7 day strength gain also increased with corresponding 28 day curing strength. The CS concretes, especially 15 % (M3) and 20% (M4) replacement level the concretes failed to maintain same strength gain, which had first 7 days of curing. This may be due to lack of sufficient bond between the particles. As the first 7 days of curing, majority of the compressive strength of the concretes depends on paste strength. However, at later age, the strength of concrete depends on strength of the paste, strength of the aggregate and bond strength between the aggregate particles and cement paste. Evidently, in the present investigation, the visual observations on specimens failed in compressive strength test suggested that the CS particles were separated from the paste phase. M5 concrete gained 48 percent at 7 days of curing of its 28 day compressive strength. The difference in behaviour of M5 when compared to M4 could be due to presence of fly ash as cement replacement. Fly ash as cement replacement reduces strength of the paste at early age, thus, strength gain was reduced in M5 when compared to M4. Strength gain in M6 was higher when compared to M5. In M6 concrete fly ash was replaced with aggregate content. The 28-day compressive strengths of the concretes were between 7.22-22.33MPa. The highest strength was for control concrete and the lowest strength was for M5 concrete. The 28 day compressive strength of M2 concrete was 61 percent when compared to control concrete. Furthermore, the strength decreased with CS replacement. The trend of the results was in line with the earlier studies [11]. The strengths of M3 and M4 were 42 and 32% respectively when compared to control concrete. M5 concrete strength was lower than M4 concrete. This observation suggests fly ash as a cement replacement had reduced compressive strength of CS concrete. Furthermore, compressive strength of M6 concrete was nearly equal to M4 concrete. From this observation it can be understood that addition of fly ash as an aggregate replacement had no influence on compressive strength when compared to corresponding CS replaced concrete (M4). However, fly ash influence on compressive strength is time dependent phenomenon. Therefore, there may be possibility of increase in strength at later ages. It was not possible to perform later age tests in this project due to time constrain. Figure 3 shows relationship between compressive strength and density of the concretes, there was good relationship between the parameters. As density increased compressive strength also increased.
4.3 Split tensile strength
between the particles and internal structure of the concrete. In the present investigation the normal aggregate was replaced with coconut shells. In this study, there may be several reasons that might cause strength reduction due to CS replacement in concrete like shape of the particles, bond between the particles and the cement paste, alignment of the particles, water absorption and density of the particles. As can be seen in Fig.1 the shape of the particles is two dimensional, that is, the ratio of lateral dimension to thickness is nearly 15 for 12mm CS particle. Furthermore, the particles are of curved shape. Elongated particles reduce compressive strength [20]. Surface texture determines bond between the particles, rough surface can produce good bond. However, coconut shells are rough on one face and relatively smooth on the other face. Therefore, there may not be enough bond between CS particles and cement paste to produce sufficient bond strength and ultimately sufficient compressive or tensile strength of the concrete. Furthermore, elongated and curved particle shape and insufficient bond between the particles may lead to porous structure. Evidently from Fig. 5 it can be noticed that M4 concrete had porous structure. Alignment of the CS particles within the concrete against load application might also contribute to strength. The particles aligned normal to the load direction could have failed due to in sufficient bond strength; the particles aligned parallel to load direction might have not resisted the strength due to thin section and insufficient bond. As stated earlier, the absorption of the coconut shells was 8% indicating that the material is porous. Porous material as aggregate leads to reduced density and ultimately reduces strength (Figure 3).
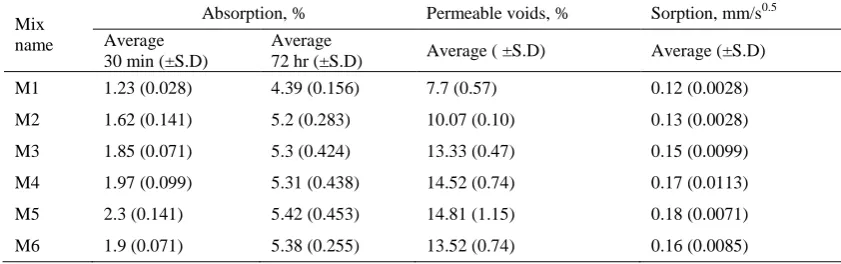
4.4 Permeable voids and water absorption
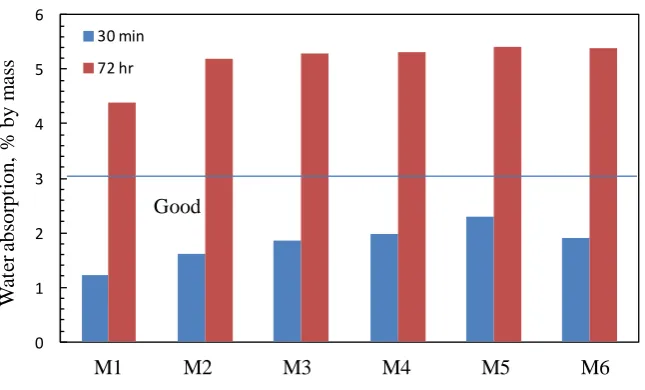
Permeable voids of the concretes are shown in Table 5. As can be seen the permeable voids increased with increase in CS replacement. For control concrete the permeable voids were 7.7%. However, 10% CS replacement increased permeable voids to 10.07 % which was 30 percent higher than control concrete. Similarly, the permeable voids were 88% higher than control concrete for 20% CS replacement. Addition of fly ash as cement replacement increased permeable voids with corresponding CS concrete (M4). However, addition of fly ash as an aggregate replacement reduced permeable voids. Relationship between permeable voids and CS replacement was examined (Fig.6). There was good relationship between the parameters, permeable voids increased with increase in CS replacement. As strength of the concrete is also depends on pore structure, a relationship between permeable voids and strength was examined; there was good relationship between the two parameters (Fig. 7) as compressive strength increased permeable voids decreased. The absorption in 30 min (initial surface absorption) and the absorption after 72 h (final absorption) for the concretes are presented in Fig. 8. It can be seen that the initial surface absorption of all the concretes shows values lower than 3%, the limit specified for ‘‘good’’ concrete by CEB [21]. The final absorption at the end of 72 h for these concretes also followed a similar trend. Initial and final absorptions of control concrete were lower than all the remaining concretes. Although there was little difference of initial water absorption between CS concretes, the final absorptions of the concretes were nearly same for all the CS concretes. Addition of fly ash as cement replacement (M5) increased initial water absorption when compared to corresponding CS replaced concrete (M4). However, fly ash as an aggregate replacement did not show any marked difference when compared to corresponding CS replaced concrete (M4). Figure 9 shows relationship between water absorption and permeable voids, the trend shows that with increase in permeable voids water absorption also increases. Strength and water absorption are dependent on pore structure of the concrete and are inversely proportional to one another, that is, if porosity increases, strength decreases and absorption increases. Fig. 10 reveals similar trend, as strength decreased water absorption increased.
4.5 Sorptivity – capillary water absorption
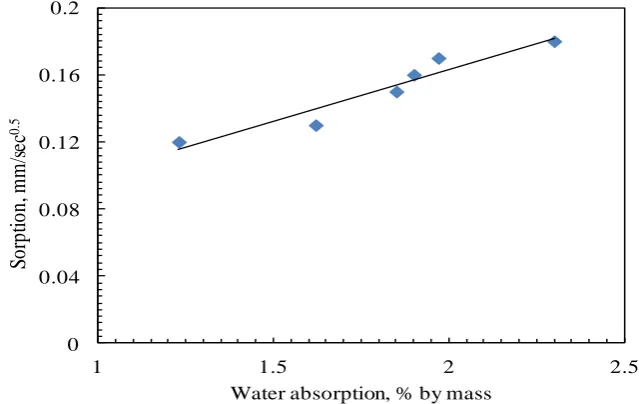
Sorptivity of the concretes is shown in Table 5. Sorptivity of the concretes was between 0.12-0.18 mm/s0.5. The lowest sorptivity was for control concrete and the highest sorptivity was for M5 concrete. Similar to water absorption, sorptivity also increased with CS replacement. Furthermore, fly ash as cement replacement further increased sorption when compared to corresponding CS replaced concrete, but, fly ash as an aggregate replacement showed little lower sorption. Fig. 11 shows relationship between water absorption and sorption. As water absorption increased sorption also increased. As in water absorption, sorptivity also increased with increase in permeable voids (Fig. 12). Overall, the main factors that control the transport properties of concrete materials are relative volume of paste matrix, the pore structure of the bulk matrix and the interfacial zone around the aggregate particles. As explained earlier, it is thought that the CS with elongated and curved shape and lack of bond between the paste and aggregate particles resulted more porous structure and thus had higher values of absorption and sorption for CS replaced concretes than control concrete.
4.6 Further discussion
There may be a possibility to increase strength of CS replaced concrete. The coconut shells need to be cleaned thoroughly and make them free from fibre and husk on the surface. Size of the CS particles should be nearly equal to the thickness of the CS particle, that is, the ratio between the lateral dimensions of CS particle and thickness should be nearly equal to one. The particles with decreased size may avoid problems associated with shape and thus improve bonding between the aggregate particles and cement paste. Increased bond between the particles may lead to higher strength. On the other hand, reduced particle size may increase surface area and may lead to increased water demand and may cause strength reduction. In the present investigation the free water to cementitious ratio was 0.6. However, with the help of water reducing admixtures, if water to cementitious materials ratio can be reduced, then, it may be possible to increase strength of CS replaced concretes. Further investigation is clearly needed to assess particle size effect and effect of water to cementitious ratio on CS concretes.
5. CONCLUSIONS
place of normal aggregate, however, performance of CS aggregate concrete is little lower than normal aggregate concrete. The main points of this study are:
1. Addition of CS decreases workability and addition of fly ash either as cement replacement or aggregate replacement increases workability of CS concrete. Increase in CS percentage decreased densities of the concretes. 2. With CS percentage increase the 7 day strength gain also increased with corresponding 28 day curing strength. However, the overall strength decreased with CS replacement when compared to control concrete. Furthermore, fly ash as cement replacement had negative influence when compared to corresponding CS concrete and fly ash as aggregate replacement had similar performance as that of corresponding CS replaced concrete.
3. Similar to compressive strength, the split tensile strength also decreased with increase in CS replacement. Furthermore, for 28 days of curing addition of fly ash as cement replacement reduced overall split tensile strength of CS concrete and fly ash addition as aggregate replacement showed no major difference with corresponding CS replaced concrete (M4).
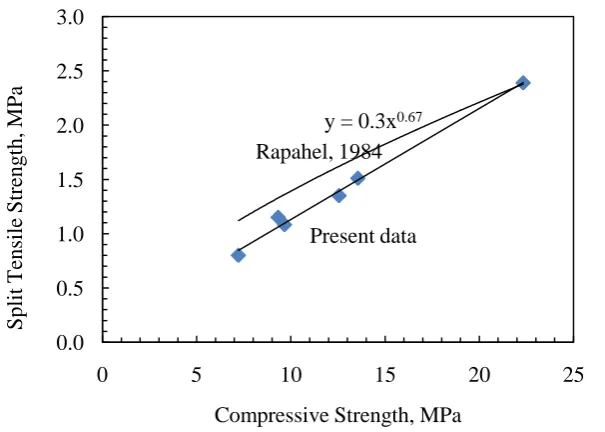
4. The results demonstrated that, irrespective of CS percentage replacement there was good relationship between compressive strength and split tensile strength. The equation proposed by Raphael, 1984 [19] for normal concrete was over predicting at lower strengths for CS concretes.
5. Increase in CS replacement permeable voids also increased. With 10% CS replacement the permeable were 30 percent higher than control concrete. Similarly, the permeable voids were 88 percent higher than control concrete for 20% CS replacement. Addition of fly ash as cement replacement increased permeable voids with corresponding CS concrete (M4). However, addition of fly ash as aggregate replacement reduced permeable voids. 6. The absorption characteristics show that the initial 30 min absorption values for all the concretes were lower than limits commonly associated with good quality concrete [21]. The maximum absorption was 2.3% for the concrete having 20% CS and 25% fly ash as cement replacement. Fly ash as cement replacement increased water absorption and fly ash as aggregate replacement did not show any marked difference with corresponding CS replaced concrete.
7. Sorptivity of the concretes was higher than control concrete for all CS concretes. The maximum sorption was 0.18mm/s0.5 for the concrete having 20% CS and 25% fly ash as cement replacement. Similar to absorption, fly ash as cement replacement increased sorption and fly ash as aggregate replacement did not show any marked difference with corresponding CS replaced concrete.
Acknowledgements
The author would like to acknowledge our final-year undergraduate students, M. Gnana Deep, V. Sushma, B. Ayesha Farheen, K. Divya Sree, J. Madhu Sudhakar, G.S. Naziya and R. Ramesh Babu for their contributions to the reported experimental work.
REFERENCES
1. U.S. Department of Transportation Federal Highway Administration. Transportation Applications of Recycled Concrete Aggregate—FHWA State of the Practice National Review. Washington, DC, USA, 2004; pp. 1-47.
2. Transport Research Laboratory. A review of the use of waste materials and by-products in road construction. contractor report 358, 1994.
3. WRAP. Use of the demolition protocol for the Wembley development. The Waste & Resources Action Programme, Wrap-Report No AGG0078. Oxon, UK, 2006; p.68.
4. William H. Langer, Lawrence J. Drew, Janet S. Sachs. Aggregate and the environment, American Geological Institute, 2004.
5. Filipponi P, Polettini A, Pomi R, Sirini P. Physical and mechanical properties of cementbased products containing incineration bottom ash. Waste Management 2003; 23(2): 145–156.
6. Dhir RK, Paine KA, Dyer TD, Tang MC. Value-added recycling of domestic, industrial and construction arisings as concrete aggregate. Concrete Engineering International 2004; 8 (1): 43–48.
7. Poon CS, Shui ZH, Lam L, Fok H, Kou SC. Influence of moisture states of natural and recycled aggregates on the slump and compressive strength of concrete. Cement and Concrete Research 2004; 34(1): 31–36.
8. Khatib ZM. Properties of concrete incorporating fine recycled aggregate. Cement and Concrete Research 2005; 35(4): pp. 763–769.
9. Andrade LB, Rocha JC, Cheriaf M. Evaluation of concrete incorporating bottom ash as a natural aggregates replacement. Waste Management 2007; 27(9): 1190–1199.
10. M. R. Jones, L. Zheng, A. Yerramala, K. S. Rao. Use of Recycled and Secondary Aggregates in Foamed Concretes. communicated, Magazine of Concrete Research, 2012.
11. E.A. Olanipekun, K.O. Olusola, O. Ata. A comparative study of concrete properties using coconutshell and palm kernel shell as coarse aggregates. Building and Environment 2006; 41(3):p297–301.
12. K. Gunasekaran, P.S. Kumar, M. Lakshmipathy. Mechanical and bond properties of coconutshellconcrete. Construction and Building Materials 2011; 25(1): p 92–98.
13. V.T. Markrose, Coconuts in India. Coconut Development Board, Kerala, India. http://www.bgci.org/education/1685/, accessed on 31-3-2012.
14. IS: 12269-1987. Specification for 53 grade ordinary Portland cement.
15. ASTM C 642–82. Test method for specific gravity, 403 absorption and voids in hardened concrete. Annual book of ASTM standards, vol. 04.02; 1995.
16. IS: 516–1959 Method of test for strength of concrete.
18. ASTM C 642–82. Test method for specific gravity, absorption and voids in hardened concrete. Annual book of ASTM standards, vol. 04.02; 1995.
19. J M Rapheal. Tensile strength of concrete, ACI Materials Journal 1984; 81, No.2: 158-65.
20. A.M. Neville. Properties of concrete, Person Edition 2006.
21. CEB-FIP. Diagnosis and assessment of concrete structures – state of art report. CEB Bull 1989;192:83–5.
Figure1 Processing of coconut shells: (i) air drying at 25-30oC, (ii) breaking coconut shells and (iii) sieved coconut shells through 12mm sieve.
Figure 2 Relationship between concrete density and coconut shell replacement
Figure 3 Relationship between compressive strength and density
(i) (ii) (iii)
2000 2100 2200 2300 2400
0 5 10 15 20 25
D
en
si
ty
o
f
T
he
Co
nc
re
te
, k
g/
m
3
Coconut Shell Replacement, %
0 5 10 15 20 25
2000 2100 2200 2300 2400
Co
m
p
re
ss
iv
e
S
tre
ng
th
, M
P
a
Figure 4 Relationship between compressive strength and split tensile strength
Figure 5 A sample cylinder of M4 concrete
Figure 6 Variation of permeable voids with coconut shells replacement
y = 0.3x
0.670.0
0.5
1.0
1.5
2.0
2.5
3.0
0
5
10
15
20
25
Spli
t
T
ens
il
e
Str
eng
th,
M
Pa
Compressive Strength, MPa
Present data
Rapahel, 1984
Porous surface of M 4
concrete
6
7
8
9
10
11
12
13
14
15
0
5
10
15
20
25
P
e
rm
e
a
b
le
v
o
id
s,
%
Figure 7 Relationship between compressive strength and permeable voids
Figure 8 Initial and final water absorptions of the concretes
Figure 9 Relationship between water absorption and permeable voids
6 7 8 9 10 11 12 13 14 15
0 5 10 15 20 25
P
erm
ea
b
le
V
oi
d
s,
%
Compressive Strength, MPa
0 1 2 3 4 5 6
30 min
72 hr
M1
M2
M3
M4
M5
M6
Good
W
at
er
a
bs
or
pt
ion,
%
by
m
as
s
6
7
8
9
10
11
12
13
14
15
4.0
4.5
5.0
5.5
6.0
Per
m
ea
bl
e
v
oi
ds,
%
Figure 10 Relationship between compressive strength and water absorption
Figure 11 Relationship between sorption and final water absorption
Figure 12 Relationship between sorption and permeable voids
0 5 10 15 20 25
4.0 4.5 5.0 5.5 6.0
Co
m
pre
ss
iv
e
St
re
ng
th
, M
Pa
Water absorption, % by mass
0 0.04 0.08 0.12 0.16 0.2
1 1.5 2 2.5
S
orp
ti
on
, m
m
/s
ec
0.
5
Water absorption, % by mass
0 0.04 0.08 0.12 0.16 0.2
5 6 7 8 9 10 11 12 13 14 15
So
rp
tio
n,
m
m
/s
ec
0.
5
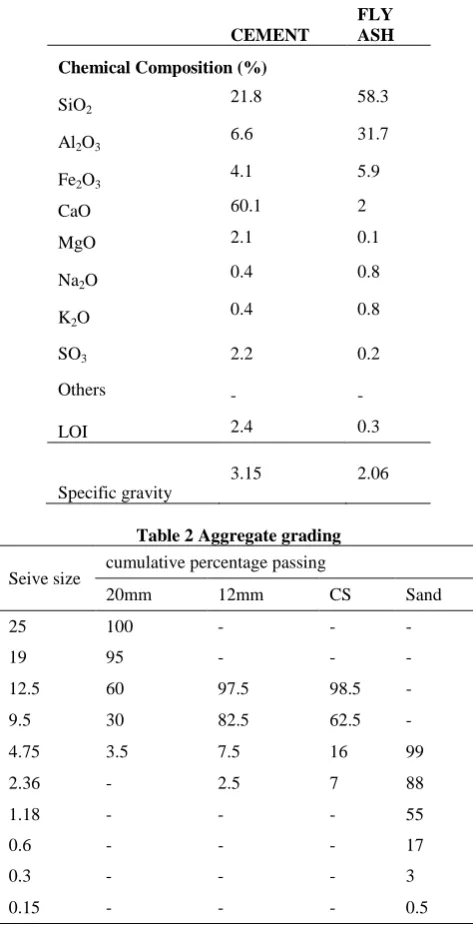
Table 1 Chemical composition and specific gravity of the materials
CEMENT
FLY ASH
Chemical Composition (%)
SiO2 21.8 58.3
Al2O3 6.6 31.7
Fe2O3 4.1 5.9
CaO 60.1 2
MgO 2.1 0.1
Na2O 0.4 0.8
K2O 0.4 0.8
SO3 2.2 0.2
Others - -
LOI 2.4 0.3
Specific gravity
3.15 2.06
Table 2 Aggregate grading
Seive size cumulative percentage passing
20mm 12mm CS Sand
25 100 - - -
19 95 - - -
12.5 60 97.5 98.5 - 9.5 30 82.5 62.5 - 4.75 3.5 7.5 16 99 2.36 - 2.5 7 88
1.18 - - - 55
0.6 - - - 17
0.3 - - - 3
0.15 - - - 0.5
Table 3 Mixture proportions
concrete name
Cement,
kg/m3 f, kg/m3
CA,
kg/m3 FA, kg/m3 CS,
kg/m3 w/cm M1 300 0 1170 750 0 0.6 M2 300 0 1053 750 117 0.6 M3 300 0 994.5 750 175.5 0.6 M4 300 0 936 750 234 0.6 M5 225 75 936 750 234 0.6 M6 300 96 813.12 750 203.28 0.6 CS-coconutshells, f- fly ash, CA- coarse aggregate, FA-fine aggregate, cm-cementitious materials (c+f)
Mix name
Slump, mm
Density, kg/m3
Compressive Strength, MPa Split Tensile Strength, MPa
1 day 7 day 28 day 1 day 7 day 28 day
M1 25 2365 6.84 11.11 22.33 0.38 0.76 2.39
M2 23 2186 3.2 5.16 13.56 0.19 0.95 1.51
M3 22 2117 3.56 7.29 12.56 0.45 0.95 1.35
M4 20 2061 3.91 7.82 9.33 0.25 0.76 1.15
M5 23 2027 2.22 3.47 7.22 0.19 0.64 0.8
M6 26 2023 3.40 5.56 9.67 0.32 0.57 1.08
Table 5. Transport properties of normal and CS concretes
Mix name
Absorption, % Permeable voids, % Sorption, mm/s0.5 Average
30 min (±S.D)
Average