Atmos. Meas. Tech., 6, 801–816, 2013 www.atmos-meas-tech.net/6/801/2013/ doi:10.5194/amt-6-801-2013
© Author(s) 2013. CC Attribution 3.0 License.
EGU Journal Logos (RGB)
Advances in
Geosciences
Open Access
Natural Hazards
and Earth System
Sciences
Open AccessAnnales
Geophysicae
Open AccessNonlinear Processes
in Geophysics
Open AccessAtmospheric
Chemistry
and Physics
Open AccessAtmospheric
Chemistry
and Physics
Open Access DiscussionsAtmospheric
Measurement
Techniques
Open AccessAtmospheric
Measurement
Techniques
Open Access DiscussionsBiogeosciences
Open Access Open Access
Biogeosciences
Discussions
Climate
of the Past
Open Access Open Access
Climate
of the Past
Discussions
Earth System
Dynamics
Open Access Open Access
Earth System
Dynamics
DiscussionsGeoscientific
Instrumentation
Methods and
Data Systems
Open Access
Geoscientific
Instrumentation
Methods and
Data Systems
Open Access DiscussionsGeoscientific
Model Development
Open Access Open Access
Geoscientific
Model Development
DiscussionsHydrology and
Earth System
Sciences
Open AccessHydrology and
Earth System
Sciences
Open Access DiscussionsOcean Science
Open Access Open Access
Ocean Science
DiscussionsSolid Earth
Open Access Open Access
Solid Earth
DiscussionsThe Cryosphere
Open Access Open Access
The Cryosphere
DiscussionsNatural Hazards
and Earth System
Sciences
Open Access
Discussions
Developing a portable, autonomous aerosol backscatter lidar for
network or remote operations
K. B. Strawbridge
Air Quality Processes Research Section, Environment Canada, Toronto, ON, Canada Correspondence to: K. B. Strawbridge ([email protected])
Received: 21 October 2012 – Published in Atmos. Meas. Tech. Discuss.: 30 November 2012 Revised: 22 February 2013 – Accepted: 7 March 2013 – Published: 26 March 2013
Abstract. Lidar has the ability to detect the complex
ver-tical structure of the atmosphere and can therefore identify the existence and extent of aerosols with high spatial and temporal resolution, making it well suited for understand-ing atmospheric dynamics and transport processes. Environ-ment Canada has developed a portable, autonomous lidar system that can be monitored remotely and operated contin-uously except during precipitation events. The lidar, housed in a small trailer, simultaneously emits two wavelengths of laser light (1064 nm and 532 nm) at energies of approxi-mately 150 mJ/pulse/wavelength and detects the backscatter signal at 1064 nm and both polarizations at 532 nm. For laser energies of this magnitude, the challenge resides in design-ing a system that meets the airspace safety requirements for autonomous operations. Through the combination of radar technology, beam divergence, laser cavity interlocks and us-ing computer log files, this risk was mitigated. A Continuum Inlite small footprint laser is the backbone of the system be-cause of three design criteria: requiring infrequent flash lamp changes compared to previous Nd : YAG Q-switch lasers, complete software control capability and a built-in laser energy monitoring system. A computer-controlled interface was designed to monitor the health of the system, adjust op-erational parameters and maintain a climate-controlled envi-ronment. Through an Internet connection, it also transmitted the vital performance indicators and data stream to allow the lidar profile data for multiple instruments from near ground to 15 km, every 10 s, to be viewed, in near real-time via a website. The details of the system design and calibration will be discussed and the success of the instrument as tested within the framework of a national lidar network dubbed CORALNet (Canadian Operational Research Aerosol Lidar Network). In addition, the transport of a forest fire plume
across the country will be shown as evidenced by the lidar network, HYSPLIT back trajectories, MODIS imagery and CALIPSO overpasses.
1 Introduction
802 K. B. Strawbridge: Developing a portable, autonomous aerosol backscatter lidar
and biogenic, locally produced air pollutants as well as those which move into the area having undergone long-range trans-port via meteorological highways. By operating in a con-tinuous mode, lidar can help to address the magnitude and occurrence of long-range transported aerosols, of both an-thropogenic and biogenic origin, as countries try to monitor and understand the relative roles and impacts of these atmo-spheric particulates.
In order to provide a near continuous aerosol lidar data stream, necessary to address these issues, a lidar instrument was developed that could operate in an autonomous mode, yet portable enough to deploy to remote regions. Typical aerosol lidar systems reside in laboratory spaces, often re-quiring routine monitoring, maintenance and frequent opera-tor interaction. The exception, to date, was the development of micropulse lidar systems (Spinhirne, 1993) that can be easily deployed without requiring the complex permission of airspace authorities due to their low laser energy emis-sions and subsequent eye-safe design. This autonomous li-dar uses a high-power, fixed-wavelength, pulsed Nd : YAG (neodymium-doped yttrium aluminum garnet) laser as an ef-fective transmitter. Generally, a zenith aerosol lidar oper-ates by emitting a pulsed, fixed wavelength or wavelengths (with the aid of doubling or tripling crystals) laser beam ver-tically into the atmosphere, while simultaneously recording the elastic backscattered signals via a telescope and detector assembly, as a function of time, to provide range-dependent data. The elastic backscattered signals due to Rayleigh and aerosol scattering are recorded to form a comprehensive composite picture of the troposphere, assembled by the in-dividual vertical profiles obtained at regular time intervals. A small footprint laser with low maintenance issues was chosen to reduce the power requirement, minimize the space require-ment of the container and reduce the on-site visits required to maintain the instrument.
It is also noteworthy that a high spectral resolution lidar (HSRL) developed by University of Wisconsin (Eloranta, 2005) was successfully operated autonomously at Eureka, Nunavut, in Canada’s High Arctic. Aside from HSRL tech-nology, improvements can be made to a simple aerosol li-dar system with the addition of one or more Raman nitro-gen channels (Althausen et al., 2009). This also eliminates the need for assuming anS ratio (extinction-to-backscatter ratio – see Eq. 2) to determine the aerosol backscatter coef-ficient. Due to budget constraints, the autonomous lidar sys-tem described here did not use the HSRL design platform nor the addition of a nitrogen Raman channel, although the latter could easily be added to the current system with only minor modifications to the detector block assembly and the subse-quent addition of detection hardware. The trade-off in oper-ating within a fixed funding envelope is to weigh the quality of the measurement versus the spatial coverage of the net-work. More sophisticated lidar systems can address radiative forcing issues and provide knowledge on the microphysical properties of the aerosol. In this case, the emphasis of the
research was on the detection of the occurrence of events and their impact on air quality and subsequent interest in the at-mospheric processes.
Utilizing coincident observations from a simple aerosol lidar and sunphotometer should also be considered. The main motivation is to explore the advantage of accurate column-averaged aerosol optical depth measurements at sev-eral wavelengths with the vertically resolved structure of the tropospheric aerosols provided by lidar (Baibakov et al., 2009; Daou et al., 2012). The sunphotometry data can pro-vide optical closure to the lidar profile data. There are how-ever a few challenges in this synergistic approach. Firstly, a sunphotometer measures the optical depth between the in-strument and the sun, while most lidar measurements are per-formed in a vertical orientation above the ground site. In prin-ciple, this means one is comparing slant-averaged values to zenith measurements. While the observations approach one another near noon, they are measuring significantly differ-ent parts of the sky during the morning hours (and late after-noon) when the boundary layer structure can be the most dy-namic. Another challenge is lidars typically do not measure the aerosol structure right to the ground due to the optical “overlap” characteristics of the instrument. Thus the lidar is unable to measure the important optical depth contributions from the aerosols nearest to the ground. This can be mini-mized by assuming a well-mixed boundary layer and recon-structing the lidar profile to the ground. In addition to this, a sunphotometer provides only column-averaged values while an aerosol lidar provides the dynamic vertical structure but has difficulty measuring the optical extinction profile with a variableS ratio. This too can be overcome, in part, by us-ing the almucantar scannus-ing capability of the CIMEL sun-photometer to extract theS ratio to help constrain the lidar profile. In spite of these challenges, a great deal of valu-able information can be obtained by making such coincident measurements. When deploying simple aerosol lidars, it is therefore advantageous to consider their proximity to sun-photometers or include them in the site instrument plan.
In this paper, we discuss the design, deployment and per-formance of a portable, autonomous lidar system and the challenges of operating a national lidar network dubbed CORALNet (Canadian Operational Research Aerosol Lidar Network). The sites were strategically located across Canada to maximize the ability to monitor both long-range trans-port and local events. This required university, provincial and other federal partners interested in monitoring the impact of such aerosols on air quality on local, regional and national scales. Details of the control interface and maintenance re-quirements will also be given.
2 Aerosol lidar technique
K. B. Strawbridge: Developing a portable, autonomous aerosol backscatter lidar 803
high spatial and temporal resolution. However, the backscat-ter coefficient is not a direct observable. Instead the lidar sys-tem measures the power returned to the detector. The general lidar equation for Mie–Rayleigh elastic backscattering for a given incident laser wavelength (λ)is given by
P (z, λ)=Pocτ 2
A
z2η·O(z)β (z, λ)exp
−2 Z
α z0, λ dz0
, (1) where Po is the average power of a single laser pulse, τ temporal pulse length of the laser,Athe detector area, and η the overall system efficiency (optical transmission from emitter to receiver and detection efficiency).O(z)is the ge-ometry factor containing the overlap function of the laser beam with the receiver field-of-view,βthe backscatter coef-ficient (m−1sr−1), which is the parameter that determines the strength of the signal being received by the telescope, and the exponential term represents the two-way transmission loss as the laser propagates through the atmosphere whereα(z) is the volume extinction coefficient (m−1)due to molecular and aerosol contributions. A difficulty arises because bothβ andαare unknowns. The simplest relationship between the backscatter and extinction coefficients is given by the follow-ing scalfollow-ing law:
β=Kαk, (2)
wherek is usually set equal to 1 and K has been studied for various atmospheric conditions and media (Ansmann et al., 1992). Sometimes the inverse ofKis referred to as the S ratio or the extinction-to-backscatter ratio. For our pur-poses, the scaling parameters are set atk=1 andK=0.03, which is characteristic of boundary layer aerosol. This ap-proximation leads to a source of error in the calculation of the atmospheric attenuation term in Eq. (1). Although other methods have been proposed (Klett, 1981, 1985), the effect is small for light aerosol loading, and for the qualitative in-terpretations in this paper. However, variableS ratios were used when plotting the profile data (see Sect. 3.4).
This now provides a way of determining the backscatter coefficient,β. However, from an atmospheric perspective it is sometimes more useful to obtain the backscatter ratio, which is the total backscatter signal divided by the backscatter co-efficient for the Rayleigh scattering of the atmosphere, with no aerosol. This normalized backscatter ratio, as a function of height, is determined by our lidar system.
In addition, it is also possible to determine the linear depo-larization ratio, an effective tool for distinguishing between water and ice clouds, desert dust and forest fire plumes to name a few. Specifically, the linear depolarization ratio,δ, is defined by Sassen (1991) as
δ≡P⊥
P||, (3)
whereP⊥andP||are the measured perpendicular and paral-lel backscatter intensities relative to polarization of the laser
beam. For spherical particles the linear depolarization ratio is 0. However, the linear depolarization ratio for a Rayleigh or molecular atmosphere is nonzero (typically around 1.5 %) because of the anisotropy of the air (Young, 1982). For non-spherical particles, such as those found in cirrus clouds, the linear depolarization ratio lies between 0 and 1.
3 Autonomous lidar system design
Environment Canada began the development of this technol-ogy with the acquisition of the Continuum Inlite III laser in 2004. A prototype of the lidar was built and tested in 2005, and after favourable performance a proposal was written in 2006 to purchase the components to build and deploy six au-tonomous lidar systems over a four-year period. Around the same time another lidar group was also designing an aerosol lidar system with similar design criteria that could be de-ployed for short-term field studies at remote locations around the globe. A second version of their instrument has now been built and deployed (Althausen et al., 2009). The main dif-ferences between the two autonomous lidar systems initially were the laser, radar interlock system, climate-control sys-tem and Internet access. The details of our instrument are described below.
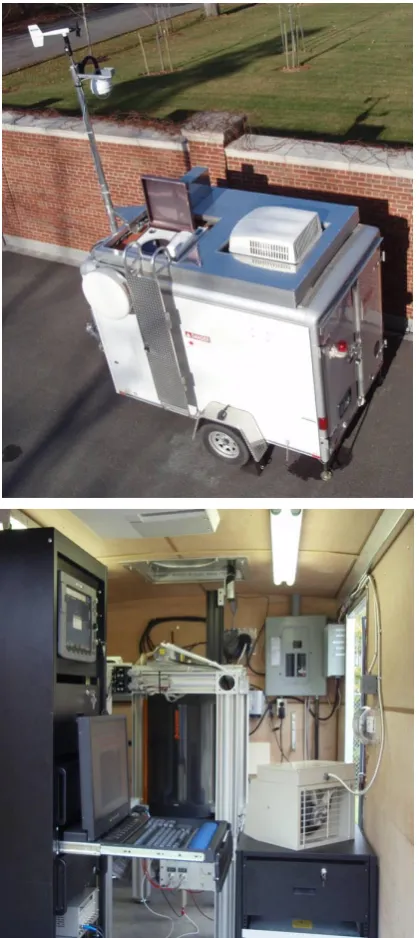
The aerosol lidar system was housed inside a modified Wells Cargo trailer to provide a portable platform for de-ployment. The interior floor footprint is approximately 2 m by 2.7 m. The trailer modifications (see Fig. 1a) include a roof hatch assembly, basic meteorological tower, radar in-terlock system, climate control system, a roof access lad-der, safety warning lights and leveling stabilizers. The unit can be operated via an Internet link and requires an exter-nal power source rated at 50 A, 240 V, single phase. The lidar system was mounted on a custom-built optical bench (see Fig. 1b), comprised of Newport X95 aluminum extru-sion tubing, which is lightweight and very rigid. The data ac-quisition electronics, radar display and Internet control sys-tems were mounted in a full-size Hammond rack and shock mounted to the floor to protect the delicate instruments dur-ing transport. The laser electronics and storage drawer were placed in a half-rack, also shock mounted to the floor. The laser electronics was mounted at a sufficient height to allow water and filter changes to the cooling system without the need to remove the unit from the rack. Details of the op-tical design, control systems, website interface and remote troubleshooting capability will be discussed in the following sections.
3.1 Lidar instrument design
804
(a)
K. B. Strawbridge: Developing a portable, autonomous aerosol backscatter lidar(b)
(a)
(b)
Fig. 1. (top) A picture showing the outside of the portable, au-tonomous aerosol lidar system. Note the location of the hatch as-sembly, radar and meteorological tower and (bottom) a picture of the inside of the trailer showing the basic layout of the lidar optical bench and rack locations.
Continuum Inlite III Nd : YAG, Q-switched laser with a sec-ond harmonic package to simultaneously emit both 1064 nm and 532 nm wavelengths. The approximate energy at each wavelength is 150 mJ with a pulse repetition rate of 10 Hz. The Continuum laser was chosen for three specific design criteria: requiring infrequent flash lamp changes compared to previous Nd : YAG Q-switch lasers, complete software
Fig. 2. A schematic showing the major components in the optical design of the lidar system.
control capability and a built-in laser energy monitoring sys-tem. Typically, Nd : YAG lasers with energy outputs of this magnitude can operate between 10 and 20 million shots be-fore requiring a flash lamp change. This particular design averages 60 to 100 million shots (and can even reach 500 million shots) on a single set of flash lamps, reducing the requirement for on-site visits to perform laser maintenance. The laser required two custom modifications: the addition of an optic to diverge the output beam to 6 mrad at both wavelengths (to reduce the nominal hazard zone of the laser) and the addition of an energy monitor for the 532 nm output wavelength. The Inlite III laser already has an energy monitor built-in for the output laser beam. The addition of a second energy monitor allowed the energy at both wavelengths to be recorded, after a simple calibration scheme. The small foot-print laser is based upon a folded cavity design that maintains alignment and is easily mounted via a three point mount sys-tem designed to accommodate sys-temperature fluctuations with-out distortion to the laser cavity. The laser is externally trig-gered by using a Stanford Research DG645 delay generator. The boresight assembly uses a dual-coated (anti-reflection coating at 1064 nm and 532 nm), high-power, 50 mm flat op-tic optimized at 45 degrees, controlled by a pair of Thorlabs Z812B 12 mm encoded, actuators and Thorlabs TDC001 DC servo motor controllers. The Thorlabs system allows the user to perform remote alignments of the transmitter and receiver assemblies of the lidar system, if necessary. The entire path of the laser beam from the laser output window to the final output ceiling window is enclosed by shaded black tubing for safety, in addition to minimizing background scattered light interference.
K. B. Strawbridge: Developing a portable, autonomous aerosol backscatter lidar 805
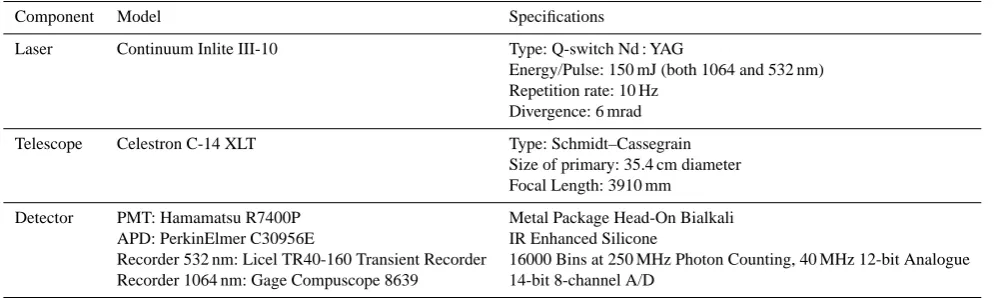
Table 1. Specifications of the major components of the aerosol lidar system.
Component Model Specifications
Laser Continuum Inlite III-10 Type: Q-switch Nd : YAG
Energy/Pulse: 150 mJ (both 1064 and 532 nm) Repetition rate: 10 Hz
Divergence: 6 mrad
Telescope Celestron C-14 XLT Type: Schmidt–Cassegrain
Size of primary: 35.4 cm diameter Focal Length: 3910 mm
Detector PMT: Hamamatsu R7400P Metal Package Head-On Bialkali
APD: PerkinElmer C30956E IR Enhanced Silicone
Recorder 532 nm: Licel TR40-160 Transient Recorder 16000 Bins at 250 MHz Photon Counting, 40 MHz 12-bit Analogue
Recorder 1064 nm: Gage Compuscope 8639 14-bit 8-channel A/D
fixed in the zenith direction. The telescope is a Cassegrain design, using a Schmidt corrector plate, with a primary mir-ror diameter of 35.4 cm. The telescope is located directly un-derneath a 40 cm diameter (2 cm thick) slab of fused silica (Grade 5F) purchased from Corning and polished with a flat-ness ofλ/10. The detector block assembly, outlined in Fig. 2, initially collimates the light received by the telescope. A dichroic beam splitter separates out the two detection chan-nels by reflecting light with shorter wavelengths while trans-mitting light with longer wavelengths. The 532 nm channel further separates the light into the perpendicular and parallel polarization components. Depending on the intensity of the return signal of the parallel 532 nm channel, a filter wheel, containing a range of calibrated neutral density filters, can be actively controlled. An interference filter and focusing op-tic is placed in front of each LICEL photomultiplier tube (PMT). LICEL high voltage power supplies support each PMT, and the signals are directed into the Licel TR40-160 transient recorder. The transient recorder collects both the analogue and photon count signals to increase the dynamic range and versatility. The 1064 nm channel is focused onto a PerkinElmer C30956E avalanche photodiode (APD). The APD incorporates a logarithmic amplifier (25 mV rms noise), made by Optech Inc., to increase dynamic range. The ampli-fiers were individually calibrated prior to the experiment via a transfer function, to convert the signal to a linear scale, in addition to second-order corrections provided by Optech Inc. The signal is directed into a 14-bit, Gage Compuscope 8639 computer card. Both the LICEL transient recorder and Gage computer card were externally triggered by the same Stan-ford Research delay generator. Each lidar profile is stored every 10 s, with a vertical resolution of 3 m for the 1064 nm channel and 3.75 m for the 532 nm channel.
3.2 Lidar control systems
A summary of the control systems is illustrated in Fig. 3. Two Windows-based computers are used in each system: one for data acquisition and one for data storage and file
Fig. 3. A schematic showing the control systems required to auto-mate the operation of the lidar for a variety of weather conditions and in the presence of airborne targets.
806 K. B. Strawbridge: Developing a portable, autonomous aerosol backscatter lidar
humidity probe. In order to maintain an appropriate opera-tional temperature range inside the trailer, a computer algo-rithm used the temperature information to determine whether or not to heat or cool the environment. Furthermore, it needed to decide whether or not to use the air conditioner or vent-ing system to cool dependvent-ing on the outside temperature. This was necessary to avoid turning on the air conditioner when external temperatures fell below the operational speci-fications. Similarly, the interior and exterior temperature in-formation was used by the algorithm to determine how much heating was required. The trailer had a two-stage heating sys-tem composed of a combination of baseboard heaters and a high capacity forced air heater to keep the trailer warm enough, particularly in very cold temperatures when the laser was not operating due to precipitation and therefore not ex-pelling heat from the laser cooling system.
In order to operate a class IV laser outdoors, it is neces-sary to obtain airspace approval from the governing author-ities, in this case Transport Canada. Two important criteria in providing a safe operational plan are to reduce the size of the nominal hazard zone and develop a method to interro-gate that zone for potential targets. The first was achieved by diverging the laser beam to 6 mrad, reducing the altitude of the nominal hazard zone to 1200 m. It was determined that it would be substantially more economical to modify an ex-isting radar system then to develop a custom radar to iden-tify airborne targets above the lidar system. A Raymarine E120 marine radar and 4 kW radome had sufficient range and sensitivity for this application. The radome was mod-ified to operate in a fixed orientation rather than the typi-cal 360 degree scan mode. This required designing a circuit that would send a signal to the electronic control board so the radar would operate even though the transmitter array was stationary. The radome was vertically mounted at a safe height above ground. The field-of-view of the radar was sub-stantially larger than the laser beam enabling enough time to react to airborne targets entering the zone. The one disadvan-tage of marine radars is the built-in target alert system is too slow to notify the computer that an airborne target entered the hazard zone. To overcome this limitation, a software in-terface was designed to interrogate the data from each radar pulse transmission. Once a target was detected, the software would send a signal to spoil the laser cavity by turning off the Q-switch on the laser control system. As an additional safety measure to ensure the radar interlock was effective, the laser cavity would also be spoiled as soon as the data stream from the radar stopped. This would remove the possibility of emit-ting the laser beam, if the radar locked up or stopped work-ing altogether. Transport Canada field tested the system, to determine that the radar interlock system functioned prop-erly. As an additional safety precaution, Transport Canada issued a NOTAM (notice to airman) or permanently marked the hazard on the flight charts, depending on the proposed duration of the lidar field study. All of these safety consider-ations allowed confidence to deploy the autonomous aerosol
lidar system at a variety of locations across Canada including busy air corridors like the metropolitan Vancouver region.
An automatic hatch cover was designed to close during precipitation events. A Vaisala DRD11A precipitation sen-sor was mounted on the meteorological pole approximately 2 m above the exit window as well as a RM Young 05103VM 0-1VDC M/S wind sensor. The precipitation sensor is heated to detect both snow and rain, and the wind sensor records the speed and direction of the wind to aid in the interpreta-tion of the lidar data. The hatch was controlled by a Joyce LA052LSCCL-12 actuator arm, wrapped in a heat pad to al-low cold temperature operation. Switches were placed on the hatch and window assembly to provide a positive feedback system for the computer control software. This avoided the potential problem of firing the laser through the exit win-dow if the hatch malfunctioned, inevitably causing signifi-cant damage to the telescope from the back reflection of the laser beam. Since the trailers were deployed to regions that have substantial snow fall, it is necessary to place heat pads on top of the hatch and around the hatch area to avoid snow from accumulating around the exit window. The heat pads, made by Custom Heat LLC silicone AC heat pads, were cus-tom sized to fit the necessary areas around the roof hatch. The precipitation sensor and external temperature were used as input into the control software to determine if power should be sent to the pads. If a positive state was reached, the power would be cycled on and off on a two-minute cycle to keep the pads from overheating. To maintain a clean exit window, a Wynn Type D MKV Straight Line wiper system with a fluid dispenser was installed. The cleaning cycle was controlled by the software to clean the window after each rain event or on a regular cycle that was optimized depending on the location of the instrument.
A service switch was installed that would shut off the radar and laser, to allow servicing to the roof area. The roof access ladder had a key-locked cage installed with a safety switch to also turn off the radar and laser should someone forget to turn the service switch. Safety lights, installed around the trailer, illuminate while the laser is firing and locks were placed on all access doors of the trailer.
3.3 Website design for data access and system status
K. B. Strawbridge: Developing a portable, autonomous aerosol backscatter lidar 807
has custom plotting tools available to generate false colour images over any selected time period and altitude of inter-est. One of the challenges in operating a lidar network is to maintain nominal system performance at each site and design an alert system should the status change. This was accom-plished by designing a “network status” Internet web page to simultaneously monitor and display the vital status infor-mation of each lidar station in the network. A variety of log files were set up to keep a record of laser output energies at both wavelengths, radar interlocks, meteorological data and system control parameters. This data formed the basis of the status page to ensure the system was operating nominally. In certain conditions, such as a laser failure, the control com-puter would send a notification email to technical staff, alert-ing them of the situation.
Remote troubleshooting of the system is possible by using two Axis 214PTZ network pan/tilt cameras. One is placed near the top of the meteorological tower to provide good ex-ternally visibility, and one is strategically placed in the in-side of the trailer with good visibility of all the main compo-nents. A number of systems are wired through a status light panel to quickly determine the state of the system. All of the electrical components of the trailer are plugged into a AP7900 Switched Rack PDU, which is essentially a Inter-net port-controlled power bar that allows each outlet to have the power cycled. The main control systems are also powered through an APC Smart uninterruptible power supply to allow the safe shutdown of the instrument should there be a power failure.
3.4 Calibration of the lidar system
The raw lidar profiles obtained from the data acquisition sys-tem are sys-temporally averaged (100 profiles = 10 s) and back-ground corrected. An overlap function is applied to the data that were empirically determined for this system’s trans-mitter and receiver geometry by orienting the lidar along a low-angle slant path in a well-mixed boundary layer. The backscatter coefficient is calculated by using Eqs. (1) and (2). As mentioned earlier, simple aerosol backscatter lidars need a priori information about theSratio in order to esti-mate the particle backscatter ratio. The US Standard Atmo-sphere 1976 is used to account for the Rayleigh scattering of the air molecules, and theSratios for final data products are estimated by using the CALIPSO aerosol classification scheme (Omar et al., 2009). This categorizes aerosols into six sub-classes and lists anSratio for both 532 nm and 1064 nm wavelengths. The profile software is designed to allow mul-tipleS ratios for specific altitude ranges. This permits anS ratio to be specified for the boundary layer to be different than free tropospheric layers, which usually have very dif-ferent values, particularly at 532 nm. The calibration con-stant for both wavelengths is determined by using a “clear air region”, typically representing a two- or three-hour av-erage, and through an iterative process adjusting the system
constant until a value of unity is determined for the backscat-ter ratio. The “clear air region” is chosen from a day where there are very few aerosols present in the boundary layer, usually from an Arctic intrusion over the measurement site. The values of the calibration constants are further tested by determining the colour ratio (β1064 /β532)of cirrus clouds (Tao et al., 2008; Bi et al., 2009). This methodology was per-formed on each lidar system in the network.
The depolarization ratio, as defined by Eq. (3), also re-quires calibration. Since a different detector and optical path is used for both the parallel and perpendicular 532 nm chan-nels, it is necessary to compensate for any bias induced by this difference in sensitivity. The method applied here is to acquire data for 5 min, rotate the 532 nm block assembly 90 degrees and acquire data for another 5 min, for 3 cycles. The rotation of the block effectively swaps which detection path-way measures the perpendicular and parallel components. The difference in sensitivity is calculated and the value ap-plied to all the depolarization data.
4 Canadian Operational Research Aerosol Lidar Network (CORALNet)
The CORALNet sites are strategically chosen to maximize our ability to monitor transport events as well as investigate regional air quality issues. Aside from the obvious neces-sity to achieve scientifically relevant data, other considera-tions play an important role in site selection, such as se-curity, dominant wind direction, fog and cloud cover, local support and coincident measurements. The sites, from west to east, are University of British Columbia, Whistler, Bratt’s Lake Observatory, Centre For Atmospheric Research Exper-iments, University of Sherbrooke and Acadia University (see Fig. 4). The autonomous lidar systems were built, tested and deployed over a three-year period. Table 2 shows the latitude and longitude coordinates and start date for each field site location. It is important to note that, due to the 4500 km dis-tance across Canada and the orographic barrier of the Rocky Mountains range, there are very few long-range transport events that travel from coast-to-coast. This is also due to the pattern of the jet stream that tends to undulate across Canada from day to day. Over three years of operation, there were only a few events traceable by the network that extended from the one coast of Canada to the other. This is also likely due in part to the sparseness of the network coverage over such a great land mass area. Canada can also be divided into regional areas of interest. In some cases, the regions have very different source emissions whereas other regions are heavily impacted by pollution sources upwind. The desire of the network was to provide as much coverage as possible to these regions of high interest.
808 K. B. Strawbridge: Developing a portable, autonomous aerosol backscatter lidar
Table 2. Geographical location and operational period for each site in the Canadian Operational Research Aerosol Lidar Network (CORAL-Net).
Site Name Geographical Location Start/End Date
CORALNet UBC Latitude: 49.265◦N 16 April 2008/29 June 2011 Longitude: 123.250◦W
CORALNet Whistler Latitude: 50.128◦N 20 April 2010/21 July 2011 Longitude: 122.950◦W
CORALNet BLO Latitude: 50.204◦N 16 May 2011/28 September 2011 Longitude: 104.713◦W
CORALNet Egbert Latitude: 44.232◦N 29 April 2009/14 October 2011 Longitude: 79.781◦W
CORALNet Sherbrooke Latitude: 45.374◦N 25 September 2008/28 September 2011 Longitude: 71.923◦W
CORALNet Acadia Latitude: 45.087◦N 19 November 2009/28 September 2011 Longitude: 64.369◦W
Fig. 4. A map of Canada showing the site locations where the portable, autonomous lidars were deployed. The network is dubbed CORALNet for the Canadian Operational Research Aerosol Lidar Network.
shows the percentage of time for each month that lidar profile data were obtained, for three different site locations, for the year 2010. Each month is divided into three groups: data, no data and precipitation. The CORALNet UBC (see Fig. 5a) performed the best of all the sites during 2010. This is pri-marily due to the instrument being in the third year of op-eration. The earlier years, plotted in Fig. 6, are more rep-resentative of what we observe at CORALNet Egbert (see Fig. 5b) and CORALNet Acadia (see Fig. 5c). It is impor-tant to note that the “no data” group represents not only in-strument downtime due to a component failure or system maintenance but also represents the time when the aircraft interlock was active as well as warm-up time for the laser after a precipitation event and wait time accumulated after
K. B. Strawbridge: Developing a portable, autonomous aerosol backscatter lidar 809
(a)
(b)
(c)
(a)
(b)
(c)
(a)
(b)
(c)
Fig. 5. Yearly plots showing the percentage of time each month that the lidars collected data, precipitation occurred, or the system was down. The data are from 2010 for (a) CORALNet UBC, (b) CORALNet Egbert and (c) CORALNet Acadia.
Fig. 6. Graph showing the same information as in Fig. 5 for CORALNet UBC, but for the entire operational period.
4.1 CORALNet University of British Columbia (CORALNet UBC)
CORALNet UBC, deployed in April 2008, was the first li-dar system in the network. Part of the motivation is the lack of aerosol lidar measurements acquired along the west coast of North America. Asian dust events, once thought to be rare, show almost a seasonal occurrence on the west coast of Canada (Cottle et al., 2012). This region of Canada is most frequently impacted by Asian dust plumes. The synop-tic conditions are most favourable during the months March, April and May but can occasionally occur during the sum-mertime (Yumimoto et al., 2010). The CORALNet UBC site has attempted to partially fill this void by providing criti-cal evidence and insight into the transport pathways and air quality impacts of these dust events on this side of the Pa-cific Rim. The University of British Columbia is located on a peninsula, adjacent to the Strait of Georgia that separates mainland Canada from Vancouver Island. As a result there are very few upwind sources (just ship traffic) from the west (the dominant wind direction) that impact the local air qual-ity of the site. However, its proximqual-ity to the water usually results in a shallow boundary layer and land breeze and sea
810 K. B. Strawbridge: Developing a portable, autonomous aerosol backscatter lidar
4.2 CORALNet Whistler
Part of the original vision in acquiring funding for build-ing a network of lidars was to build an extra portable lidar that could be deployed in support of Environment Canada short-term field studies. This was the origin of CORAL-Net Whistler, deployed to the area in support of a major field program in July 2010. The results of the deployment were so successful in providing critical profile information on the complex mixing which occurs in mountainous terrain (Wainwright et al., 2012; Gallagher et al., 2012), the lidar continues to make observations. This supports the ongoing research initiative to evaluate long-range transport events ob-served at Whistler Peak High Elevation Research Site located at the peak of Whistler Mountain. The site was established in 2002 and operates year-round and is ideal for observing free tropospheric events. The local pollution influences are mini-mal from the ski village and resort area in the valley below, but it does have biogenic contributions (Pierce et al., 2012) from the forested areas that surround. There is also an op-portunity to study cloud and aerosol interactions as clouds often form below and around the peak elevation. The lidar site is situated at a government meteorological station, inside a fenced compound, located approximately 600 m below the peak observatory. It provides a critical component into under-standing whether the high-altitude observatory is sampling free tropospheric air or air from the village in the valley be-low or nearby biogenic sources. It also provides complemen-tary data to the CORALNet UBC lidar when looking for sim-ilarities and differences of these long-range transport events (McKendry et al., 2011).
4.3 CORALNet Bratt’s Lake Observatory (CORALNet BLO)
The Bratt’s Lake CORALNet site will provide the first rou-tine lidar measurements in the Canadian Prairies. The Bratt’s Lake facility is situated 23 km south of the city of Regina, Saskatchewan. It is best known as part of the Baseline Sur-face Radiation Network (BSRN) but has in recent years added several other atmospheric and meteorological mea-surements. A full suite of sunphotometers routinely measure column optical depth at the site. There are also meteorologi-cal, air and precipitation chemistry, greenhouse gas and PM measurements that augment the remote sensors. The lidar will provide vertically resolved information on the aerosol column to better understand and apportion the optical bud-get aloft. This site, which remains sunny most of the year, should provide valuable information on forest fire plumes, long-range pollution transport and impacts of agricultural techniques on regional air quality issues. The CORALNet BLO site was deployed in May 2011 after a lengthy delay in building construction. Unlike the UBC lidar, this lidar is housed in a separate room in a new building that was erected adjacent to the sunphotometry rooftop instrument suite. The
(a)
(b)
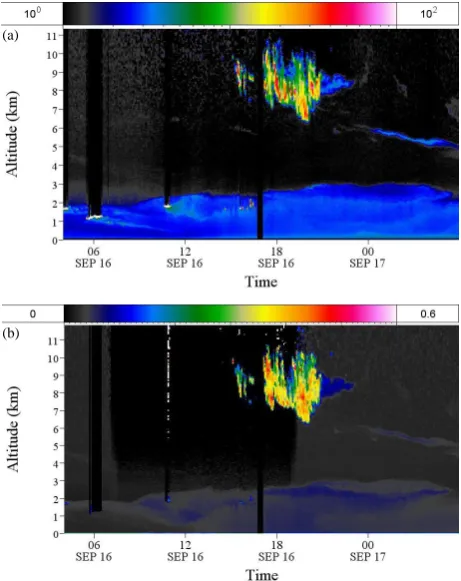
Fig. 7. False colour plot of the (a) lidar backscatter ratio at 532 nm and (b) the depolarization ratio at 532 nm. The cirrus cloud shows significant depolarization as expected from a cloud primarily com-posed of ice crystals.
basic lidar design is identical, including the roof hatch as-sembly and radar interlock system. The heating, cooling and external vent systems are individually controlled to maintain a climate-controlled environment inside the lidar room. Al-though the data were only collected at this site for a short period of time (see Table 1), there are a number of days avail-able to investigate sunphotometry and lidar coincident mea-surements.
4.4 CORALNet Centre For Atmospheric Research Experiments (CORALNet Egbert)
K. B. Strawbridge: Developing a portable, autonomous aerosol backscatter lidar 811
(a)
(b)
(c)
Fig. 8. False colour plots (using the same colour scale) showing the lidar backscatter ratio at 1064 nm for (a) CORALNet UBC, (b) CORALNet BLO and (c) CORALNet Egbert. The time and date (in 2011) are plotted in UTC.
optical depths at night (Baibakov et al., 2009). The goal is to evaluate the optical coherency between the active and pas-sive techniques even through the nocturnal periods. Since other lidar systems vertically profile the atmosphere above Egbert, there is a unique opportunity to use these coincident measurements to provide insight into the complex dynamic mixing of the lower atmosphere. In addition, Egbert is the test ground for new developments to the autonomous lidar platform. Figure 7 shows the backscatter ratio plot and de-polarization plot for 16–17 September 2012, obtained from the recently modified 532 nm channel. The recent modifica-tion utilizes the LICEL photon counting hardware instead of analogue signals amplified through a logarithmic amplifier (similar to that used in the 1064 nm channel). The increased sensitivity and improvements in linearity are immediately ev-ident in the plot. The volume linear depolarization ratios vary from around 5–10 % in some embedded structures within the boundary layer and layer aloft on 17 September compared to 40–50 % in the cirrus cloud aloft. In addition we have measured Asian dust, several forest fire plumes and several smog events at this site. The lidars also support the many
(a)
(b)
Fig. 9. False colour plots (using the same colour scale) showing the lidar backscatter ratio at 1064 nm for (a) CORALNet Sherbrooke, and (b) CORALNet Acadia. The time and date (in 2011) are plotted in UTC.
ground-based in situ instruments that reside at the facility and other remote sensing and satellite studies that augment the instrument suite during major field campaigns.
4.5 CORALNet University of Sherbrooke (CORALNet Sherbrooke)
812 K. B. Strawbridge: Developing a portable, autonomous aerosol backscatter lidar
(a) (b) (c)
Fig. 10. HYSPLIT five-day back trajectories ending at (a) CORALNet Egbert (b) CORALNet Sherbrooke and (c) CORALNet Acadia site locations.
Fig. 11. Lidar profile data averaged over the plume duration at all five CORALNet lidar stations.
4.6 CORALNet Acadia University (CORALNet Acadia)
CORALNet Acadia provided a critical link in the chain of lidars across Canada. Determining a site location in eastern Canada was difficult because of the high incidence of fog in the region. With the aid of meteorological observations, it was decided that a location in the Annapolis Valley provided the best opportunity for clear day operations. In addition, sev-eral ground-based measurements are operated in the gensev-eral area and will therefore benefit from knowledge of the verti-cal structure observed by the lidar. The pollutants in the sur-rounding area arise primarily from agriculture, wood burning stoves and small industrial plants. Another research area of interest is to study the impact and frequency on long-range transport of pollutants from eastern North America that often traverse over the region as they ride the jet stream across the Atlantic. CORALNet Acadia also provides an opportunity
to collaborate with the lidar group at Dalhousie University in Halifax. Acadia is approximately 200 km to the west and provides a good upwind site for Lagrangian-type studies.
4.7 Example of a CORALNet long-range transport event
One of the advantages of a national lidar network is to track long-range transport events as they move across the coun-try. On 24 June 2011, a forest fire plume was observed over the CORALNet UBC (see Fig. 8a) and CORALNet Whistler. The false colour plot for Whistler is not shown, because the plume was only visible for about 12 min at the Whistler site due to extensive cloud cover. The black areas on the images in Figs. 8 and 9 represent regions where lidar data are not available, due to the presence of optically thick clouds or dur-ing precipitation when the lidar system does not operate. The plume is visible in Fig. 8a between 21:00 and 05:30 (UTC) at an altitude of 7.5–9.5 km. On 26 June, a plume appears over the CORALNet BLO site ranging in altitude from 4– 9.5 km (see Figs. 8b and 11). The plume layers at the higher altitudes are very difficult to see in the backscatter ratio plot, but, after some temporal averaging, their existence is con-firmed (see Fig. 11). The following day, the main plume is observed over the CORALNet Egbert site at an altitude of 4–7 km (see Fig. 8c) between 19:00 UTC on 26 June and 11:00 UTC on 27 June. There is also a plume visible around 3 km that eventually appears to interact with the boundary layer at 19:00 UTC on 28 June. The CORALNet Sherbrooke (see Fig. 9a) site shows the plume arriving at 22:00 UTC 27 June at an altitude of 4–5 km. At 19:00 UTC on 28 June, the layer at 3 km also appears to mix down into the boundary layer. The plume arrives at CORALNet Acadia (see Fig. 9b) at 18:00 UTC on 27 June at an altitude of 4–5 km and eventu-ally mixes into the descending cloud layer at 08:00 UTC on 29 June.
K. B. Strawbridge: Developing a portable, autonomous aerosol backscatter lidar 813
Fig. 12. Terra MODIS true colour image at 1 km resolution over the CORALNet Egbert site on 27 June 2011. Notice the smoke, more easily visible over the water surface, at the leading edge of the cloud system.
calculated using the HYSPLIT (HY-brid Single-Particle La-grangian Integrated Trajectory) model (http://ready.arl.noaa. gov/HYSPLIT.php). Figure 10 shows the resulting five-day back trajectory analysis from the CORALNet Eg-bert, CORALNet Sherbrooke and CORALNet Acadia loca-tions. Figure 10a shows the backward trajectory ending at 04:00 UTC on 27 June at CORALNet Egbert. The back tra-jectory indicates that the air arriving at Egbert originated from the west coast of North America, very close to the US/Canada border. It also indicates the air parcel descended from an altitude of 8500 m to 5000 m as it travelled from west to east with the largest decrease in altitude occurring around 26 June. Very similar results are shown in Fig. 10b and c representing back trajectories ending at 04:00 UTC on 28 June at CORALNet Sherbrooke and 19:00 UTC on 28 June at CORALNet Acadia. These results are consistent with the altitude ranges of the plume observed at each of the CORALNet sites shown in Figs. 8 and 9. Temporally av-eraged 532 nm lidar profiles were obtained at each of the CORALNet sites over an altitude range of 0 to 11 km and plotted in Fig. 11. The lidar profiles also show the decrease in altitude as the plume travels from west to east and the large altitude shift around 26 June when the plume was around the CORALNet BLO site. The lidar profile data were obtained by using an S ratio of 35, except in the altitude range of the plume, where an S ratio value of 70 was used to rep-resent clean continental and smoke respectively (Omar et al., 2009). The maximum particle backscatter coefficients were measured over the CORALNet Egbert site. Figure 12 repre-sents the MODIS (Moderate Resolution Imaging Spectrora-diometer) true colour image acquired form the Terra satel-lite on 27 June 2011 over the CORALNet Egbert location. The variation in backscatter coefficients between the various
Fig. 13. CALIPSO vertical feature mask (top) and aerosol subtype (bottom) plots near CORALNet UBC on 24 June at approxi-mately 11:00 UTC (http://www-calipso.larc.nasa.gov/products/ lidar/browse images/show date.php?s=production\&v=V3-01\ &browse date=2011-06-24).
CORALNet sites is easily explained by the highly variable plume depicted in the MODIS image.
814 K. B. Strawbridge: Developing a portable, autonomous aerosol backscatter lidar
Fig. 14. CALIPSO vertical feature mask (top) and aerosol subtype (bottom) plots near CORALNet BLO on 25 June at approxi-mately 21:11 UTC (http://www-calipso.larc.nasa.gov/products/ lidar/browse images/show date.php?s=production\&v=V3-01\ &browse date=2011-06-25).
only heavy cloud cover. Figure 9b shows the smoke plume was indeed well under the cloud, making it difficult for CALIPSO to validate its presence. The CORALNet lidar data, HYSPLIT trajectory analysis, MODIS imagery and CALIPSO lidar data all indicate a forest fire plume was transported 4500 km, from the west to east coast of Canada.
5 Conclusions and future work
Environment Canada has successfully designed, built and deployed a number of portable, autonomous lidar systems across Canada. The primary motivation was to collect con-tinuous lidar profiles, except during precipitation, to improve our understanding of the impact and extent of long range transport and other pollution events on air quality at local, regional and national scales. Developing an autonomous li-dar facility significantly reduces the operational field costs of maintaining on-site personnel. The development of the in-strument was possible due to recent technological advance-ments in laser technology and Internet-controlled electronics. A sophisticated control program of approximately 250 000 lines of code was developed to provide safe operations, ex-tensive system controls and the storage, transmission and dis-play of the data in near real-time.
A network of lidars was an excellent test platform to ensure the design was robust, reliable, and operational costs were minimal. It has been shown that the system
Fig. 15. CALIPSO vertical feature mask (top) and aerosol subtype (bottom) plots near CORALNet Egbert on 27 June at approx-imately 08:13 UTC (http://www-calipso.larc.nasa.gov/products/ lidar/browse images/show date.php?s=production\&v=V3-01\ &browse date=2011-06-27).
K. B. Strawbridge: Developing a portable, autonomous aerosol backscatter lidar 815
performance was outstanding, operating in harsh climates for several months without any requirement for maintenance or on-site adjustments. CORALNet site locations were strate-gically chosen to provide adequate coverage, support local scientific interests and placed coincident with sunphotome-try and other useful measurement devices. An example of a forest fire plume travelling across the entire network from the west to east has been shown. The success of the aerosol li-dar network is viewed as a starting point from which more complex lidars will eventually replace these systems as tech-nology and funding become available. The current plan is to add a nitrogen Raman channel to improve the backscat-ter retrievals at 532 nm. There is also an ozone DIAL system being developed to be deployed along with the aerosol li-dar in a larger container, allowing simultaneous observations of tropospheric ozone and aerosol profiles. This technology will be deployed to the oil sands region where the winters are harsh and costs to travel to the region are high in support of an Integrated Oil Sands Environment Monitoring Plan.
The autonomous lidar network also has the potential to help as a forecasting tool. Figure 8c shows the typical on-set of a frontal wedge and subsequent rain event (not shown, but occurs at 04:00 UTC on 28 June). Some preliminary at-tempts have been made at exploring the relationship between the slope of the frontal wedge and wind speed to help accu-rately predict a rain event. The initial results are promising. This would be an interesting application for lidar data as most laboratory lidars would be turned off when such weather is forecast over the instrument.
Acknowledgements. The author would like to personally acknowl-edge the technical support of Bernard Firanski and Michael Travis who generally go above and beyond their regular duties to produce outstanding results.
Edited by: G. Pappalardo
References
Althausen, D., Engelmann, R., Baars, H., Heese, B., Ansmann, A., and Muller, D.: Portable Raman lidar PollyXT for automated profiling of aerosol backscatter, extinction and depolarization, J. Atmos. Ocean. Tech., 26, 2366–2378, 2009.
Ansmann, A., Riebesell, M., Wandinger, U., Weitkamp, C., Voss, E., Lahmann, W., and Michaelis, W.: Combined Raman elastic-backscatter LIDAR for vertical profiling of moisture, aerosol ex-tinction, backscatter, and LIDAR ratio, Appl Phys. B-Lasers O., 55, 18-28, 1992.
Baibakov, K., O’Neill, N. T., Firanski, B., and Strawbridge K.: Preliminary Analysis of Night-time Aerosol Optical Depth Re-trievals at a Rural, Near-urban Site in Southern Canada, in: Cur-rent Problems in Atmospheric Radiation (IRS2008) Proceedings of the International Radiation Symposium (IRC/IAMAS), AIP Conference Proceedings, Vol. 1100, Foz do Iguacu, Brazil, 3– 8 August 2008, 443–446, 2009.
Ben-Ami, Y., Koren, I., and Altaratz, O.: Patterns of North African dust transport over the Atlantic: winter vs. summer, based on CALIPSO first year data, Atmos. Chem. Phys., 9, 7867–7875, doi:10.5194/acp-9-7867-2009, 2009.
Bi, L., Yang, P., Kattawar, G. W., Baum, B. A., Hu, Y. X., Winker, D. M., Brock, R. S., and Lu, J. Q.: Simulation of the color ratio associated with the backscattering of radiation by ice particles at the wavelengths of 0.532 and 1.064 um, J. Geophys. Res., 114, D00H08, doi:10.1029/2009JD011759, 2009.
Brook, J. R., Strawbridge, K. B., Snyder, B. J., Boudries, H., Worsnop, D., Anlauf, K. G., Sharma, S., and Hayden, K.: To-wards an understanding of the fine particle variations in the LFV: Integration of chemical, physical and meteorological observa-tions, Atmos Environ., 38, 5775–5788, 2004.
Cottle, P., Strawbridge, K., McKendry, I., O’Neill, N., and Saha, A.: A pervasive and persistent Asian dust event over North America during spring 2010: lidar and sunphotometer ob-servations, Atmos. Chem. Phys. Discuss., 12, 30589–30618, doi:10.5194/acpd-12-30589-2012, 2012.
Daou, D., O’Neill, N. T., Strawbridge, K. B., and Travis, M.: Re-trieving fine and coarse mode extinction coefficient profiles from Lidar and sunphotometry synergy, in: Proceedings of the 26th International Laser Radar Conference, Porto Heli, Greece, 25– 29 June 2012, 30–11, 2012.
Dirksen, R. J., Folkert Boersma, K., de Laat, J., Stammes, P., van der Werf, G. R., Val Martin, M., and Kelder, H. M.: An aerosol boomerang: Rapid around-the-world transport of smoke from the December 2006 Australian forest fires observed from space, J. Geophys. Res., 114, D21201, doi:10.1029/2009JD012360, 2009. Eloranta, E.: High spectral resolution lidar, in: Lidar, Springer Se-ries in optical sciences, Weitkamp, C., Springer Berlin, Germany, 143–163, 2005.
Feingold, G., Eberhard, W. L., Veron, D. E., and Previdim M.: First measurements of the Twomey indirect effect using ground-based remote sensors, Geophy. Res. Lett., 30, 1287, doi:10.1029/2002GL016633, 2003.
Fischer, E. V., Perry, K. D., and Jaffe, D. A.: Optical and chemical properties of aerosols transported to Mount Bach-elor during spring 2010, J. Geophys. Res., 116, D18202, doi:10.1029/2011JD015932, 2011.
Gallagher, J. P., McKendry, I. G., Strawbridge, K., Macdonald, A. M., Leaitch, W. R., and Cottle, P.: Application of Lidar Data to Assist Airmass Discrimination at the Whistler Mountaintop Ob-servatory, J. Appl. Meteorol. Clim., 51, 1733–1739, 2012. Klett, J. D.: Stable analytical inversion solution for
pro-cessing LIDAR returns, Appl. Optics, 20, 211–220, doi:10.1364/AO.20.000211, 1981.
Klett, J. D.: Lidar inversion with variable backscatter to extinction ratios, Appl. Optics, 24, 1638–1645, 1985.
Komppula, M., Mielonen, T., Arola, A., Korhonen, K., Lihavainen, H., Hyv¨arinen, A.-P., Baars, H., Engelmann, R., Althausen, D., Ansmann, A., M¨uller, D., Panwar, T. S., Hooda, R. K., Sharma, V. P., Kerminen, V.-M., Lehtinen, K. E. J., and Viisanen, Y.: Technical Note: One year of Raman-lidar measurements in Gual Pahari EUCAARI site close to New Delhi in India – Seasonal characteristics of the aerosol vertical structure, Atmos. Chem. Phys., 12, 4513–4524, doi:10.5194/acp-12-4513-2012, 2012. Kunz, G. J., de Leeuw, G., Becker, E., and O’Dowd, C. D.:
816 K. B. Strawbridge: Developing a portable, autonomous aerosol backscatter lidar
sea spray aerosol plumes generation and transport at Mace Head, Ireland (PARFORCE experiment), J. Geophys. Res., 107, 8106, doi:10.1029/2001JD001240, 2002.
Lighty, J. S., Veranth, J. M., and Sarofim, A. F.: Combustion aerosols: factors governing their size and composition and impli-cations to human health, J. Air. Waste. Manage., 50, 1565–1618, 2000.
Liu, Z., Omar, A., Vaughan, M., Hair, J., Kittaka, C., Hu, Y., Powell, K., Trepte, C., Winker, D., Hostetler, C., Ferrare, R., and Pierce, R.: CALIPSO lidar observations of the optical properties of Sa-haran dust: A case study of long-range transport, J. Geophys. Res., 113, D07207, doi:10.1029/2007JD008878, 2008.
Mahowald, N. M., Ballantine, J. A., Feddema, J., and Ramankutty, N.: Global trends in visibility: implications for dust sources, At-mos. Chem. Phys., 7, 3309–3339, doi:10.5194/acp-7-3309-2007, 2007.
McKendry, I. G., Strawbridge, K. B., O’Neill, N. T., Macdonald, A. M., Liu, P. S. K., Leaitch, W. R., Anlauf, K. G., Jaegle, L., Fairlie, T. D., and Westphal, D. L.: Trans-Pacific transport of Saharan dust to western North America: A case study, J. Geophys. Res., 112, D01103, doi:10.1029/2006JD007129, 2007.
McKendry, I. G., van der Kamp, D., Strawbridge, K. B., Christen, A., and Crawford, B.: Simultaneous observations of boundary-layer aerosol boundary-layers with CL31 ceilometer and 1064/532 nm li-dar, Atmos. Environ., 43, 5847–5852, 2009.
McKendry, I., Strawbridge, K., Karumudi, M. L., O’Neill, N., Mac-donald, A. M., Leaitch, R., Jaffe, D., Cottle, P., Sharma, S., Sheri-dan, P., and Ogren, J.: Californian forest fire plumes over South-western British Columbia: lidar, sunphotometry, and mountain-top chemistry observations, Atmos. Chem. Phys., 11, 465–477, doi:10.5194/acp-11-465-2011, 2011.
Omar, A., Winker, D., Kittaka, C., Vaughan, M., Liu, Z., Hu, Y., Trepte, C., Rogers, R., Ferrare, R., Kuehn, R., and Hostetler, C.: The CALIPSO Automated Aerosol Classification and Lidar Ra-tio SelecRa-tion Algorithm, J. Atmos. Ocean. Tech., 26, 1994–2014, 2009.
O’Neill, N. T., Perro, C., Saha, A., Lesins, G., Duck, T. J., Eloranta, E. W., Nott, G. J., Hoffman, A., Karumudi, M. L., Ritter, C., Bourassa, A., Abboud, I., Carn, S. A., and Savastiouk, V.: Prop-erties of Sarychev sulphate aerosols over the Arctic, J. Geophys. Res., 117, D04203, doi:10.1029/2011JD016838, 2012.
Pierce, J. R., Leaitch, W. R., Liggio, J., Westervelt, D. M., Wain-wright, C. D., Abbatt, J. P. D., Ahlm, L., Al-Basheer, W., Cz-iczo, D. J., Hayden, K. L., Lee, A. K. Y., Li, S.-M., Rus-sell, L. M., Sjostedt, S. J., Strawbridge, K. B., Travis, M., Vlasenko, A., Wentzell, J. J. B., Wiebe, H. A., Wong, J. P. S., and Macdonald, A. M.: Nucleation and condensational growth to CCN sizes during a sustained pristine biogenic SOA event in a forested mountain valley, Atmos. Chem. Phys., 12, 3147–3163, doi:10.5194/acp-12-3147-2012, 2012.
Ramanathan, V., Crutzen, P. J., Kiehl, J. T., and Rosenfeld, D.: Aerosols, climate, and the hydrological cycle, Science, 294, 2119–2124, 2001.
Real, E., Orlandi, E., Law, K. S., Fierli, F., Josset, D., Cairo, F., Schlager, H., Borrmann, S., Kunkel, D., Volk, C. M., McQuaid, J. B., Stewart, D. J., Lee, J., Lewis, A. C., Hopkins, J. R., Raveg-nani, F., Ulanovski, A., and Liousse, C.: Cross-hemispheric transport of central African biomass burning pollutants: impli-cations for downwind ozone production, Atmos. Chem. Phys., 10, 3027–3046, doi:10.5194/acp-10-3027-2010, 2010.
Sassen, K.: The Polarization Lidar Technique for Cloud Research: A Review and Current Assessment, B. Am. Meteorol. Soc., 72, 1848–1866, 1991.
Schumann, U., Weinzierl, B., Reitebuch, O., Schlager, H., Minikin, A., Forster, C., Baumann, R., Sailer, T., Graf, K., Mannstein, H., Voigt, C., Rahm, S., Simmet, R., Scheibe, M., Lichtenstern, M., Stock, P., R¨uba, H., Sch¨auble, D., Tafferner, A., Rautenhaus, M., Gerz, T., Ziereis, H., Krautstrunk, M., Mallaun, C., Gayet, J.-F., Lieke, K., Kandler, K., Ebert, M., Weinbruch, S., Stohl, A., Gasteiger, J., Groß, S., Freudenthaler, V., Wiegner, M., Ansmann, A., Tesche, M., Olafsson, H., and Sturm, K.: Airborne observa-tions of the Eyjafjalla volcano ash cloud over Europe during air space closure in April and May 2010, Atmos. Chem. Phys., 11, 2245–2279, doi:10.5194/acp-11-2245-2011, 2011.
Spinhirne, J. D.: Micro pulse lidar, IEEE T. Geosci. Remote., 31, 48–55, 1993.
Strawbridge, K. B.: Scanning lidar: A means of characterizing the Noranda-Horne Smelter plume, Geochem.-Explor. Env. A., 6, 121–129, 2006.
Strawbridge, K. B. and Snyder, B. J.: Daytime and nighttime air-craft lidar measurements showing evidence of particulate matter Transport into the northeastern valleys of the Lower Fraser Val-ley, B.C., Atmos Environ., 38, 5873–5886, 2004.
Tao, Z., McCormick, M. P., Wu, D., Liu, Z., and Vaughan, M. A.: Measurements of cirrus cloud backscatter color ratio with a two-wavelength lidar, Appl. Optics, 47, 1478–1485, 2008.
Twomey, S.: The influence of pollution on the short wave albedo of clouds, J. Atmos. Sci., 34, 1149–1152, 1977.
Uno, I., Eguchi, K., Yumimoto, K., Takemura, T., Shimizu, A., Ue-matsu, M., Liu, Z., Wang, Z., Hara, Y., and Sugimoto, N.: Asian dust transported one full circuit around the globe, Nat. Geosci., 2, 557–560, 2009.
Wainwright, C. D., Pierce, J. R., Liggio, J., Strawbridge, K. B., Macdonald, A. M., and Leaitch, R. W.: The effect of model spa-tial resolution on Secondary Organic Aerosol predictions: a case study at Whistler, BC, Canada, Atmos. Chem. Phys., 12, 10911– 10923, doi:10.5194/acp-12-10911-2012, 2012.
Winker, D., Liu, Z., Omar, A., Tackett, J., and Fairlie, D.: CALIOP observations of the transport of ash from the Eyjafjal-laj¨okull volcano in April 2010, J. Geosphys. Res., 117, D00U15, doi:10.1029/2011JD016499, 2012.
Young, A. T.: Rayleigh scattering, Phys. Today, 35, 42–48, 1982. Yumimoto, K., Eguchi, K., Uno, I., Takemura, T., Liu, Z., Shimizu,