Search for Stop Pair Production at the LHC using the CMS Detector
Verena I. Martinez Outschoorn1,a, for the CMS Collaboration
1Fermi National Accelerator Laboratory,b, Batavia, IL, USA
Abstract.A search for pair production of top squark events in proton-proton collisions at a center-of-mass energy of √s =8 TeV is performed in a sample with a single isolated electron or muon, jets, large missing transverse energy and large transverse mass. The data sample used corresponds to an integrated luminosity of 19.5 fb−1collected by the CMS experiment. No significant excess in data is observed above the expectation from standard model processes. In the context of supersymmetric models with pair production of top squarks decaying to either a top quark and the lightest supersymmetric particle (LSP) or a bottom quark and a chargino that subsequently decays to a W boson and the LSP, the results probe top squarks with masses up to about 650 GeV for LSP masses up to about 250 GeV.
1 Introduction
A search for the pair production of top squarks is per-formed using the pp collision dataset at a center-of-mass
energy √s = 8 TeV collected by the Compact Muon
Solenoid (CMS) experiment [1] at the Large Hadron Col-lider (LHC) during 2012, corresponding to an integrated
luminosity of 19.5 fb−1. The gauge hierarchy problem has
received additional attention following the recent
discov-ery of a particle with mass of∼125 GeV consistent with
the Higgs boson [2–4]. Relatively light top squarks, with masses below several hundred GeV, are necessary if Su-persymmetry (SUSY) is to be the natural solution to the gauge hierarchy problem [5–9]. Searches for top squarks have also been performed by the ATLAS collaboration at the LHC [10–14], and by the CDF [15] and DØ [16] col-laborations at the Tevatron. The analysis described here is an extension of a previous analysis [17] and more details can be found in reference [18].
The search presented here focuses on a R-parity con-serving scenario, where SUSY particles are pair-produced, and the lightest SUSY particle (LSP) is stable and is a
candidate dark matter particle. The lightest neutralino ˜χ0
1
is considered to be the LSP, which escapes without de-tection. Two decay modes of the top squark (˜t) are
ex-amined: ˜t → t ˜χ01 and ˜t → b ˜χ+1 → bW+χ˜01, which are
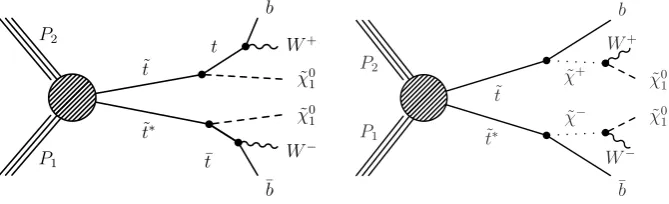
expected to have large branching fractions if kinemati-cally accessible. Figure 1 shows the two signal processes
of interest: pp → ˜t˜t∗ → ttχ˜0
1χ˜ 0
1 → bbW+W −χ˜0
1χ˜ 0 1 and
pp→˜t˜t∗→bbχ˜+
1χ˜ −
1 →bbW+W −χ˜0
1χ˜ 0 1.
ae-mail: [email protected]
bOperated by Fermi Research Alliance, LLC under Contract No.
De-AC02-07CH11359 with the United States Department of Energy.
2 Event selection
The analysis is based on events where one of theWbosons
decays leptonically and the other hadronically. The result-ing signature includes one isolated lepton, four jets, two of which originate from b quarks, and large missing
trans-verse energy (Emiss
T ) from the two neutralinos. Selected
events are thus required to contain one high transverse
momentum (pT) isolated lepton (electrone[19] or muon
µ [20]) and no additional isolated tracks or hadronic tau
candidates, which are indications of an additional lepton. The veto on additional leptons reduces the background
from tt events in which both W bosons decay
leptoni-cally (t¯t → `+`−). Events are also required to contain at
least four high-pTjets, where at least one jet is consistent
with containing the decay of a heavy-flavor hadron
(“b-tagged” [21]). In addition, the EmissT , defined as the
mag-nitude of the vector sum of the transverse momenta of all
the energy in the event, is required to beEmissT >100 GeV.
Background events containing a single leptonically
de-cayingWboson are suppressed by requiring that the
trans-verse mass, constructed from the lepton pT and theEmissT ,
is much larger than the W mass, MT > 120 GeV.
Addi-tional kinematic variables are used to discriminate signal
from background. A useful discriminant is the MT2W
vari-able [22], which is the minimum “mother” particle mass compatible with all the transverse momenta and
mass-shell constraints for a t¯t → `+`−event where the second
lepton is missed. This variable has an endpoint at the top
mass forttevents, while the signal does not satisfy such
a constraint. Two topological variables distinguish signal topologies where the LSPs are recoiling against the visible
objects in the event from backgroundtttopologies where
the two tops have high pT and are recoiling against each
other. The first is the minimum difference in azimuthal
an-gle between theEmissT vector and the two highest pT jets,
© Owned by the authors, published by EDP Sciences, 2013
P1
P2
˜ t⇤
˜ t
¯ t
t
¯ b
W
˜0
1
˜0
1
W+
b
3
P1 P2
˜ t∗ ˜ t
˜ χ−
W− ˜ χ+
W+
¯ b
˜ χ0
1 ˜ χ0
1 b
Figure 1.Diagram for top squark pair production for the ˜t→t ˜χ0
1(left) and ˜t→b ˜χ+1 (right) decay modes.
which tends to be lower for t¯t→`+jets events. The second
variable is theHratioT , defined as the fraction of the scalar
sum of the jet transverse energies (HT) in the same
hemi-sphere as theEmiss
T , i.e., within±90
◦ of theEmiss
T vector,
which is lower for signal events.
The dilepton ttbackground is suppressed in the ˜t →
t ˜χ0
1search by searching for a combination of three of the
jets in the event are consistent with a hadronic top decay
t→bW →bq¯q. ThepTspectrum of the leading b-tagged
jet is also a useful discriminant in two signal scenarios.
For the ˜t → b ˜χ+1 mode, where the bottom quarks arise
from the decay of the top squark, the bottom quark can
be harder than the fortt events where the bottom quark
comes from the decay of the top quark. For the ˜t → t ˜χ01
decay mode where the top quark is off-shell, thepT
spec-trum is softer than for the background where the top quark is on-shell. Finally an additional, related, discriminating variable is the geometrical separation between the leading b-tagged jet and the lepton.
Multiple signal regions (SRs) are defined in order to
target the ˜t→ t ˜χ01 and ˜t→ b ˜χ+1 decay scenarios and
dif-ferent signal kinematics that depend on the region of pa-rameter space defined by the SUSY particle masses. Two approaches are pursued to define SRs: an approach based on boosted decision tree (BDT) multivariate techniques and a cut-based approach. The cut-based SRs are defined by adding requirements on individual kinematic variables
and a range of Emiss
T requirements. The BDT combines
the kinematic variables into a single discriminant, and the BDT SRs are defined by requirements on the value of this discriminant. Despite adding some complexity, the BDT approach improves the sensitivity of the search by up to 40%. As a result, the primary result of the search is the BDT analysis, while the cut-based analysis serves as a cross-check.
In the BDT analysis, six SRs target the ˜t→t ˜χ01signal
model and four SRs target the ˜t→b ˜χ+1 signal model with
a parameterx =0.5 that specifies the chargino mass,
de-fined asmχ˜±
1 =x·m˜t+(1−x)·mχ˜01. Additional ˜t
→b ˜χ+1
signal regions targetting mass spectra withx = 0.25 and
0.75 have also been pursued [18]. The search sensitivity decreases as the chargino and neutralino masses are closer
to each other, orxdecreases.
3 Backgrounds
The SM backgrounds may be grouped into four categories,
which in order of importance are: (1) t¯t→`+`−where one
of the leptons is not identified, (2)ttproduction in which
one W boson decays leptonically and the other
hadroni-cally (t¯t→`+jets), as well as single-top production in the
s- and t-channels, referred to as “single-lepton top”, (3) a variety of SM processes with small cross sections, referred
to as the “rare” processes, includingttevents produced in
association with a vector boson (ttW, ttZ, ttγ), processes
with two (WW,WZ,ZZ) and three (WWW,WWZ,WZZ,
ZZZ) electroweak vector bosons, and single-top
produc-tion in the tW-channel mode, and (4) producproduc-tion of W
bosons with jets (W+jets). The multijet contribution to the
background is negligible in the signal regions due to the
requirement of a high-pTisolated lepton, largeMT, large
Emiss
T and the presence of a b-tagged jet.
Backgrounds are estimated from MC simulations, nor-malized to the number of events in data in the trans-verse mass peak region, which is dominated by SM back-grounds. This minimizes systematic uncertainties
associ-ated with the knowledge of the tt production cross
sec-tion, the integrated luminosity, the lepton efficiency, and
jet energy scale. The simulation is validated in control re-gions (CRs) intended to enrich the data sample in specific background sources while maintaining kinematical prop-erties that are similar to those in the SRs. Three CRs are
used: a sample dominated by t¯t → `+`−events obtained
by requiring the presence of two leptons (CR-2`), a
sam-ple dominated by a mixture oftt→`+jets and t¯t→`+`−
events obtained by requiring the presence of a lepton and an isolated track or hadronic tau candidate (CR-`t) and a
sample dominated byW+jets events obtained by requiring
no b-tagged jets in the event (CR-0b).
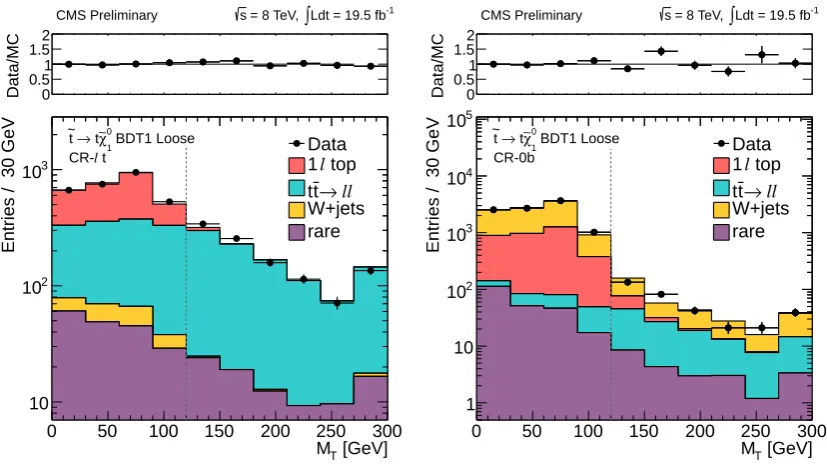
The CRs are used to validate the modeling of the main kinematical variables in the analysis. In particular, the
MT distribution of the control sample after applying the
SR-like requirements allows for a direct comparison of data and simulation. This provides a test of the ability of the method to correctly predict the SM background in the
SRs. Figure 2 shows the MT distribution in two control
regions, CR-`t and CR-0b, for events satisfying the BDT signal region requirement for the loosest (tightest) BDT
SRs for the ˜t→ t ˜χ0
1 decay mode, targeting low (high) m˜t
and small (large) mass differences∆m=m˜t−mχ˜0
1.
[GeV] T M
0 50 100 150 200 250 300
Entries / 30 GeV
10 2 10
3 10
Data top
l
1
ll → t t W+jets rare
BDT1 Loose 0
1 χ∼ t → t ~
t
l
CR--1 Ldt = 19.5 fb ∫
= 8 TeV, s CMS Preliminary
Data/MC 0 0.5 1 1.52
[GeV] T M
0 50 100 150 200 250 300
Entries / 30 GeV
1 10 2 10
3 10
4 10
5 10
Data top
l
1
ll → t t W+jets rare
BDT1 Loose 0
1 χ∼ t → t ~
CR-0b
-1 Ldt = 19.5 fb ∫
= 8 TeV, s CMS Preliminary
Data/MC 0 0.5 1 1.52
Figure 2. Data vs. MC simulation comparisons in the control regions CR-`t (left), and CR-0b (right) of the MT distribution after the signal-like requirement on the BDT discriminant is applied. The dashed lines in the right plots indicate theMT >120 GeV SR selection. For the plots in CR-0b, a scale factor is applied to the MC in theMTtail. For all plots, the last bin contains the overflow.
for the other control regions. After normalizing to the
MT peak region, the number of events in data and
simu-lation with MT >120 GeV, indicated by the dashed line,
can be directly compared. This comparison allows for the
derivation of data/MC scale factors to be applied to the
MC predictions. The only scale factor necessary is due to
an underestimation of theMTtail for single lepton top and
W+jets events.
In the case of CR-2` and CR-`t, the number of data
events with MT > 120 GeV is consistent with the MC
prediction. The level of agreement is used to assess a
sys-tematic uncertainty for the t¯t→`+`−background
predic-tion. The uncertainty ranges from 5% for the loosest sig-nal regions to 70% for the tightest sigsig-nal regions, reflecting the limited statistical precision of the control samples after the SR-like requirements are applied. Finally, background contributions from rare processes are taken directly from the simulated samples, where their rates are normalized to the corresponding NLO cross sections.
4 Results and Interpretation
The background expectations and the corresponding data
counts for BDT analysis for ˜t → t ˜χ01 and ˜t → b ˜χ+1 with
x = 0.5 are shown in Table 1. Similar results are
ob-tained for the ˜t→b ˜χ+1 BDT analysis for thex=0.25 and
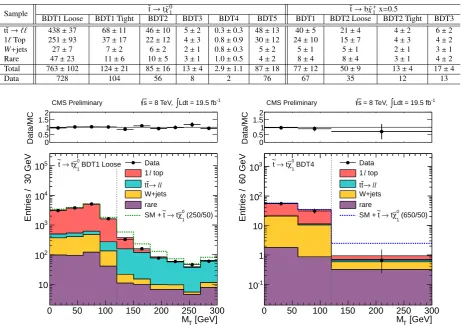
0.75 mass spectra and the cut-based analysis [18]. Fig-ure 3 shows a comparison of data and simulation of the
MT distributions after all other requirements are applied
for events satisfying the loosest and tightest ˜t→t ˜χ0
1BDT
SR requirements. The SRs are to the right of the dotted line that indicates the cut value. The observed and pre-dicted yields agree in all signal regions within about 1–1.5
standard deviations. Therefore, we observe no evidence for top-squark pair production. It may be noted that there is a tendency for the background predictions to lie some-what above the observed yields; however the yields and
background predictions in different signal regions are
cor-related.
The results of this search are interpreted in the con-text of the top squark pair production models where either
˜t → t ˜χ0
1 or ˜t → b ˜χ+1 → bWχ˜
0
1, each with 100%
branch-ing fraction (see Fig. 1). The model is parametrized by
the masses of the ˜t and the ˜χ0
1. For each model point in
the m˜tvs. mχ˜0
1parameter space, upper limits are set on the
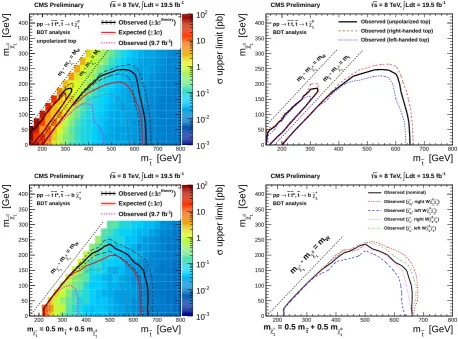
signal production cross section at 95% confidence level us-ing the SR with the best expected sensitivity at that point. Exclusion regions are defined by comparing these cross section upper limits to the theoretical predictions for the signal cross sections. The results from the BDT analysis
are shown in Fig. 4 (left) for the ˜t→t ˜χ01and ˜t→b ˜χ+1 with
x=0.5 scenarios. Depending on the model details, these
results probe top squarks with masses between
approxi-mately 150 and 650 GeV for ˜χ0
1with masses up to
approx-imately 250 GeV. The results are not sensitive to the model
points withm˜t−mχ1=mtin the ˜t→t ˜χ
0
1interpretation. In
this case the ˜χ0
1 is produced at rest in the top rest frame,
resulting in lowEmiss
T and lowMT. However, this analysis
is sensitive to signal scenarios withm˜t−mχ1<mtand with
top squarks lighter than the top, where the top quark in the
decay ˜t→t ˜χ0
1is off-shell.
The polarizations of the final and intermediate state
particles (top quarks in the ˜t→t ˜χ0
1scenario, and charginos
andW bosons in the ˜t →b ˜χ+1 case) are model dependent
1 1 1 χ˜1 = ˜t+ χ˜1
the individual background contributions, total background, and observed yields are indicated. The uncertainty includes both the statistical and systematic components.
Sample ˜t→t ˜χ
0
1 ˜t→b ˜χ+1 x=0.5
BDT1 Loose BDT1 Tight BDT2 BDT3 BDT4 BDT5 BDT1 BDT2 Loose BDT2 Tight BDT3 t¯t→`` 438±37 68±11 46±10 5±2 0.3±0.3 48±13 40±5 21±4 4±2 6±2 1`Top 251±93 37±17 22±12 4±3 0.8±0.9 30±12 24±10 15±7 4±3 4±2
W+jets 27±7 7±2 6±2 2±1 0.8±0.3 5±2 5±1 5±1 2±1 3±1
Rare 47±23 11±6 10±5 3±1 1.0±0.5 4±2 8±4 8±4 3±1 4±2 Total 763±102 124±21 85±16 13±4 2.9±1.1 87±18 77±12 50±9 13±4 17±4
Data 728 104 56 8 2 76 67 35 12 13
[GeV] T M
0 50 100 150 200 250 300
Entries / 30 GeV
10 2 10
3 10
4 10
5
10 Data
top
l
1
ll
→ t t W+jets rare
(250/50) 0 1 χ∼ t → t ~ SM + BDT1 Loose
0 1 χ∼ t → t ~
-1 Ldt = 19.5 fb ∫
= 8 TeV, s CMS Preliminary
Data/MC 0 0.5 1 1.5 2
[GeV] T M
0 50 100 150 200 250 300
Entries / 60 GeV
-1 10
1 10 2 10
3
10 Data
top
l
1
ll
→ t t W+jets rare
(650/50) 0 1 χ∼ t → t ~ SM + BDT4
0 1 χ∼ t → t ~
-1 Ldt = 19.5 fb ∫
= 8 TeV, s CMS Preliminary
Data/MC 0 0.5 1 1.5 2
Figure 3. Comparison of theMT distributions in data vs. MC simulation for events satisfying the loosest (left) and tightest (right) ˜t→t ˜χ0
1BDT signal region requirements. The distributions for the ˜t→t ˜χ 0
1model withmt˜=250 GeV andmχ˜0
1 =50 GeV (left) and m˜t=650 GeV andmχ˜0
1=50 GeV (right) are overlaid. The vertical dashed line indicates the SR requirement (MT>120 GeV). For the MTdistribution after the BDT4 requirement (right), the bin to the right of the vertical line contains all events withMT>120 GeV, and has been scaled by 1/3 to indicate the number of events per 60 GeV.
used in this interpretation are chosen to have no polar-ization. In order to examine the impact of this choice on the final result, the exclusion regions are compared under
different assumptions. The exclusion regions obtained in
the nominal ˜t→t ˜χ01scenario with unpolarized top quarks
are compared to those obtained with pure left-handed and pure right-handed top quarks in Fig. 4 (top right). In the
˜t → b ˜χ+1 scenario, the acceptance depends on the
polar-ization of the chargino, and on the nature of theWχ˜0
1χ˜ ± 1
coupling (left- or right-handed). In the nominal
interpre-tation for the ˜t→ b ˜χ+1 model presented in Fig. 4, the
sig-nal events have an unpolarized chargino and a left/
right-symmetricWχ˜0
1χ˜ ±
1 coupling. A comparison of various
lim-iting cases, shown in Fig. 4, indicates that the scenarios in which the results deviate the most from nominal corre-spond to right-handed charginos with either a right-handed
Wχ˜01χ˜±1 coupling (maximum sensitivity) or a left-handed
Wχ˜01χ˜±1 coupling (minimum sensitivity). These studies
show that for both decay modes, the limits on the top
squark and ˜χ0
1masses vary by±10–20 GeV depending on
the polarization assumption.
5 Summary
A search for the direct pair production of top squark pairs in the final state of a single isolated lepton, multiple jets,
large Emiss
T and large MT has been performed using the
CMS pp collision dataset at √s = 8 TeV. Signal regions
are defined with various kinematic discriminants target-ing a range of signal models and kinematics. No signif-icant excess is observed above the background predictions within the assessed uncertainties. The results are used to place constraints on the masses of top squarks in the mass range up to about 650 GeV, relevant for the natural SUSY solution to the gauge hierarchy problem.
References
[GeV] t ~ m
200 300 400 500 600 700 800
[GeV] 1 0 χ∼ m 0 50 100 150 200 250 300 350 400
upper limit [pb]
σ -3 10 -2 10 -1 10 1 10 2 10 unpolarized top BDT analysis 0 1 χ∼ t → t ~ *, t ~ t ~ →
pp Observed (±1σtheory)
) σ 1 ± Expected ( ) -1 Observed (9.7 fb
-1 Ldt = 19.5 fb
∫
= 8 TeV, s CMS Preliminary t = M 1 0 χ ∼
- mt
~ m W = M 1 0 χ ∼
- mt
~ m [GeV] t ~ m
200 300 400 500 600 700 800
[GeV]0 χ∼1
m 0 50 100 150 200 250 300 350 400 BDT analysis 0 1 χ∼ t → t ~ , t ~ t ~ →
pp Observed (unpolarized top) Observed (right-handed top)
Observed (left-handed top) -1 Ldt = 19.5 fb
∫
= 8 TeV, s CMS Preliminary t = m 0 1 χ ∼ - m t ~ m W = m 0 1 χ ∼ - m t ~ m [GeV] t ~ m
200 300 400 500 600 700 800
[GeV] 1 0 χ∼ m 0 50 100 150 200 250 300 350 400
upper limit [pb]
σ -3 10 -2 10 -1 10 1 10 2 10 BDT analysis + 1 χ∼ b → t ~ *, t ~ t ~ →
pp Observed (±1σtheory)
) σ 1 ± Expected ( ) -1 Observed (9.7 fb
0 1
χ∼
+ 0.5 m
t ~
= 0.5 m ± 1
χ∼
m
-1 Ldt = 19.5 fb
∫
= 8 TeV, s CMS Preliminary W = m 0 1 χ ∼ - m ± 1 χ ∼ m [GeV] t ~ m
200 300 400 500 600 700 800
[GeV]0 1
χ∼ m 0 50 100 150 200 250 300 350 400 BDT analysis + 1 χ∼ b → t ~ *, t ~ t ~ →
pp Observed (nominal)
) ± 1 χ∼ 0 1 χ∼ , right W R ± χ∼ Observed ( ) ± 1 χ∼ 0 1 χ∼ , left W R ± χ∼ Observed ( ) ± 1 χ∼ 0 1 χ∼ , right W L ± χ∼ Observed ( ) ± 1 χ∼ 0 1 χ∼ , left W L ±
χ∼ Observed (
-1 Ldt = 19.5 fb
∫
= 8 TeV, s CMS Preliminary
0 1
χ∼
+ 0.5 m
t ~
= 0.5 m
± 1 χ∼ m W = m 0 1 χ ∼ - m ± 1 χ ∼ m
Figure 4. Interpretations using the primary results from the BDT method for the (top left) ˜t → t ˜χ0
1 model, and for the ˜t → b ˜χ+1 model with chargino mass parameterx= 0.25 (bottom left). The color scale indicates the observed cross section upper limit. The observed, median expected and±1 standard deviation (σ) expected exclusion contours are indicated. The right distributions compare the exclusion regions for different assumptions of the polarization of the intermediate decay particles, showing the observed excluded regions for the ˜t→t ˜χ0
1model for the case of unpolarized top quarks, right-handed top quarks, and left-handed top quarks (top right) and the observed excluded regions for the ˜t→b ˜χ+1model withx=0.5 for the nominal scenario, right-handed ( ˜χ±
R) vs. left-handed ( ˜χ
±
L) charginos, and right-handed vs. left-handedWχ˜0
1χ˜
±
1 couplings (bottom right).
[2] M. W. Cahill-Rowley et al., Phys. Rev. D 86, 075015
(2012).
[3] CMS Collaboration, Phys. Lett. B 716, 30 (2012).
[4] ATLAS Collaboration, Phys. Lett. B 716, 1 (2012).
[5] R. Barbieri and G. Giudice, Nucl. Phys. B 306 63
(1988).
[6] B. de Carlos and J. Casas, Phys. Lett. B 309no. 3-4,
320 (1993).
[7] S. Dimopoulos and G. Giudice, Phys. Lett. B 357
no. 4, 573 (1995).
[8] R. Barbieri, G. Dvali, and L. J. Hall, Phys. Lett. B
377, 76 (1996).
[9] M. Papucci, J. T. Ruderman, and A. Weiler, JHEP
09, 035 (2012).
[10] ATLAS Collaboration, Phys. Rev. Lett. 109211802
(2012).
[11] ATLAS Collaboration, Phys. Rev. Lett. 109, 211803
(2012).
[12] ATLAS Collaboration, Eur. Phys. J. C72, 2237
(2012).
[13] ATLAS Collaboration, Phys. Lett. B720, 13 (2013).
[14] ATLAS Collaboration, JHEP 11, 094 (2012).
[15] CDF Collaboration, Phys. Rev. D 82092001 (2010).
[16] D0 Collaboration, Phys. Lett. B 696, 321 (2011).
[17] CMS Collaboration, CMS Physics Analysis Sum-mary CMS-PAS-SUS-12-023, (2012).
[18] CMS Collaboration, CMS Physics Analysis Sum-mary CMS-PAS-SUS-13-011, (2013).
[19] CMS Collaboration, CMS Physics Analysis Sum-mary CMS-PAS-EGM-10-004, (2010).
[20] CMS Collaboration, CMS Physics Analysis Sum-mary CMS-PAS-MUO-10-002, (2010).
[21] CMS Collaboration, JINST 8, P04013 (2013).
[22] Y. Bai et al., JHEP 07, 110 (2012).
[23] M. Perelstein and A. Weiler, JHEP 03141 (2009).