The Difference In The Effects Of
Longitudinal Effects Of Network Latency
On STEM And Non-STEM Students
H. Francis Bush, Lynchburg College, USA Vonda Walsh, The Virginia Military Institute, USA
Jay Sullivan, The Virginia Military Institute, USA James Squire, The Virginia Military Institute, USA
ABSTRACT
As enrollment in online courses increases faster than the overall enrollments in higher education, the differences in learning styles and academic disciplines need to be identified. Further, the focus on the demand for students pursuing degrees in the sciences, technology, engineering and mathematics (STEM) has gained prominence in the past decade. An experiment was conducted to study the interaction of objective learning and subjective learning, objective learning and enjoyment, and subjective learning and enjoyment on the longitudinal effects of network latency on students who were classified as STEM majors or non-STEM majors (humanities and social sciences). The findings indicate that students from different majors responded differently by the time students have progressed to their senior year in reference to their learning styles and sensitivity to network delays than it was when they were freshmen. The study suggests that the accumulation of experience and choice of major are important factors in mitigating the effects of network delay on learning.
Keywords: E-Learning; Latency; Network Delay; Pedagogical Efficacy; STEM
INTRODUCTION
llen (2010) indicates that enrollment in online courses has increased faster than the overall enrollments in higher education. Interactive web-based learning tools such as simulations and tutorials have become increasingly popular resources for undergraduate education, rivaling even the importance of textbooks in recent years, Reisel (2010), Dollar, (2007). Beyond the walls of conventional classrooms, web-based educational software has moved on-line courses into the main stream with 61% of two-year and four-year educational institutions offering on-line courses as of the 2006-2007 academic year, Parsad (2008). The Sloan Consortium Annual Report states that 3.9 million students were taking on-line courses in 2007, Allen (2008), and that by the fall semester of 2010 this number had risen to 6.1 million, Allen (2011). While the ranks of students involved in some form of web based education expands every year, the effects of the physical limitations of the internet, such as bandwidth combined with network delay, on learning is only partially understood.
Allen (2013) discussed the concerns facing online education in the United States in a ten year study on online education in the United States. Specifically, they reported three critical barriers when adopting online education. The need for online students to be more disciplined has been cited by 88.8 percent of academic leaders in their survey, which is approximately a 10 percent increase in their concern over ten years. Following from the first concern, the majority of chief academic officers perceived that the retention rate is lower for online courses. The last concern is focused on the acceptability of online degrees in the marketplace. Approximately forty percent of academic leaders indicate that potentials employers’ lack of acceptance of online degrees is a barrier to online education, which has not yet change. However, the study indicates that academic leaders see online education has a critical component to their long-term strategy is at an all-time high of 69.1 percent.
The increased focus on STEM education is illustrated by the variety of research studies on techniques to enhance the attraction and retention of STEM majors. Kelley (2010) argues forcefully the potential of STEM education, which the author identifies as an outgrowth of the Math, Science, and Technology movement from the early 1990s. Wankat (2011) identified in excess of 1,600 articles presented or published in 2009 alone. Schneider (2015) reports the effect of “living-learning communities” on attracting and supporting STEM majors from underrepresented groups and generation students. They reported the program success in recruiting and retaining underrepresented and first-generation students and enhanced their performance based on GPAs and critical thinking skills. McGonagle (2014) reports the success of the STRONG-CT program to support students from racial/ethnic minorities and first-generation students. STRONG-CT supports students in Connecticut academically and socially, and with career advising. Simon (2015) reports the effects on persistence and motivation for students in STEM program. They report that autonomy enhances persistence for males while perception, self-efficacy and achievement goals were stronger among females. Further, activities in STEM class need to be more enjoyable and relevant to enhance persistence. The breadth of the significance of STEM education is beyond higher education. Kennedy (2014) developed recommendations for secondary education and Han (2014) studied the attitude of middle school children towards STEM education in Korea. Eng (2013) identifies the need to differentiate between students. The author reminds us that career opportunities in STEM related fields is limited and is best served by those with skills and motivation. Ignoring the nature of the student causes more harm than good.
Four years ago, during the 2007-2008 academic year the authors began a systematic study on this topic using a web-based Fourier synthesis tutorial with an initial sample of 281 students to characterize the effects of network delay on learning, Sullivan (2013), Squire (2008), Walsh (2011), Bush (2008). Students were provided with one of eight possible versions of an interactive tutorial, each of which was coded with a particular delay. Students were then presented with a set of conceptual questions about Fourier synthesis and instructed to use their version of the tutorial interactively to answer the questions. Students were also queried as to their enjoyment of the learning experience, as well as how confident they were about their answers to the conceptual questions. Based on this data, an initial assessment as to the effect of network delays on objective learning scores, self-assessed learning and enjoyment were made. In general, it was found that the group as a whole was fairly intolerant to delay for objective learning, with scores falling off at delays of 60 ms; the smallest non-zero delay in the study. In contrast to the objective learning results, enjoyment declined gradually with increasing delays, and self-assessed learning ratings only decreased for delays greater than 300ms.
The purpose of this paper is to report on the outcomes of a longitudinal study started in the fall semester of 2008. Of the students who participated in the study during their freshmen year, 113 were enrolled in the spring semester of their senior year and willing to participate again in the study. Not all of the initial participants were enrolled at the institution and others were not enticed by the rewards, a free pizza and a chance for a fifty-dollar gift certificate at a local restaurant. Originally, each participant was randomly assigned a version of the Fourier synthesis tutorial and asked to use the tutorial to answer the same questions posed in the original study, Squire (2008). They were reintroduced to the Fourier synthesis tutorial as seniors, with each student receiving the identical version of the tutorial that they used as freshmen. As in the original study, students’ performance on the Fourier synthesis tutorial was assessed using measures of objective learning, subjective learning and enjoyment. In addition to examining the effect of delay time on these measures, the notion of a self-critique measure is introduced as a means to gage changes in the learning characteristics of the students over time.
RESULTS OF PREVIOUS WORK
In the original study (Squire, 2008), 281 students from four different universities participated. One hundred fifty-five students identified their major as STEM, 96 stated their major as humanities and 30 did not specify a single major. The age range of participants was 15-25 years of age, with a mean age of 19.15 years, and 86 percent of the students were male.
A C# interactive software application containing a hidden delay was created for the experiment, with eight different versions corresponding to delays of 0ms to 420ms in increments of 60ms. The program can be downloaded at:
Students were randomly assigned a version of the Fourier synthesis tutorial and then were given a questionnaire to work on interactively with the tutorial program. The questionnaire consisted of 6 personal information questions to establish information about the students such as their age, gender and academic major, as well as 11 questions concerning Fourier analysis concepts and two questions related to students’ enjoyment of the tutorial, and their confidence in the answers they gave. Data from questionnaires was tabulated using a Matlab program and used to calculate three measures of learning with the interactive tutorial:
• Objective learning: The percentage of 11 conceptual questions correctly answered.
• Subjective Learning: Student’s self-reported confidence on their ability to answer the conceptual questions. Scoring was based on a five-point Likert scale where 5 corresponded to “very confident” in their responses and 1 corresponded to “not sure at all”.
• Subjective Enjoyment: Student’s self-reported enjoyment from participating in the experiment. Scoring was based on a Likert scale with 5 representing the most enjoyment and 1 the least enjoyment.
In each case the mean values of these measures were calculated and plotted against the delay time. The error bars on each of the plots are given as +/- the standard deviation of the measurements. Bilinear models were fit to the data to identify the “elbows” of the various learning measures as a function of delay. In general objective learning scores were the most sensitive to network delays with a 10% drop for delays 60ms or higher. Subjective learning, (i.e. student confidence), was much less sensitive to delay, dropping steeply only for delays greater than 300 ms. Enjoyment on the other hand, decreases steadily from a high value of approximately 4.75 at 0ms delay, until it levels off at a value near 3.7 at a delay of 300ms. These results are interesting in that they point out that students may be somewhat confident about their answers and happy with the learning experience at delays which produce poor objective learning results. The study concluded that delay times must be minimized to meet objective learning goals.
Further, Bush (2008) reported that that the tolerance for screen update latencies were greater for students who were in non-STEM majors (humanities and social sciences) than those in STEM majors (engineering and sciences) in terms of objective learning, subjective learning, and enjoyment. The investigation of the change in the interaction of objective learning and subjective learning was identified in a preliminary investigation (Sullivan, 2013).
RESULTS OF THE LONGITUDINAL STUDY
The original experiment was expanded to collect data from entering freshmen for three years (2007 through 2009) and then again three years later in the spring of their senior year (2011 through 2013). Of the students who were tested originally, 113 students agreed to participate a second time motivated by a free pizza coupon and the chance to win a gift certificate to a local restaurant.
As freshmen, students were randomly assigned to an interactive software application based on the Fourier synthesis with an imbedded screen delay from 0 to 420 milliseconds in increments of 60 milliseconds. As seniors they were specifically assigned to the same group. Each time the students were provided the same tutorial and questionnaire which provided the responses for measuring objective learning, subjective learning and enjoyment.
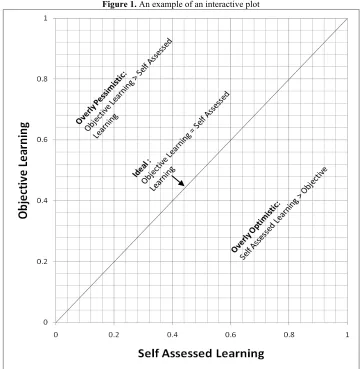
Sullivan (2013) developed data spaces to investigate the longitudinal impact of the different levels of screen update delayed on the interaction of objective learning and subjective learning, objective learning and enjoyment, and subjective learning and enjoyment. Sullivan (2013) provided the following example to further describe the data space approach to analysis. The objective learning and subjective learning data space appears in figure 1. Preferably, students’ perception of their learning should be correlated with their objective learning. Under this condition, the pair of scores from the objective learning questions and from the subjective learning after normalizing the Likert scale to 0 to 1 should form a line rising at 45 degrees from the origin.
The Interaction of Objective Learning and Subjective Learning
The relationship between objective learning and subjective learning cannot be assumed to be well matched (Bush, 1989). The importance of maintaining a balance between objective learning and subjective learning is demonstrated by deviations from the 45 degree line. Those individuals in the upper left-hand portion of the graph score higher than their perceptions indicate. This pessimistic view represents a lack of confidence in one’s ability. Such lack of confidence could be manifested in hesitation or unwillingness to make a decision. Those individual in the lower right-hand portion of the graph perceive their abilities to be above their actual nature. This overly optimistic view represents a confidence level in excess of one’s abilities. Such over confidence can lead to quick and perhaps faulty judgments. Using the data space for objective learning versus subjective learning, ideally, the observations would lie on the 45 degree line rising from the origin. (See figure 1.) Both situations are suboptimal. Overly optimistic learners are likely to make errors of commission by making choice from misunderstood knowledge, while overly pessimistic learners are likely to make errors of omission from failing to act from when they actually do understand the material.
Figure 1. An example of an interactive plot
effects are byproducts of the online experience. Such a shift if maintained would imply that these students would be less prepared for decision making or required additional repetition for reinforcement.
Figure 2. Interaction of objective learning and subjective learning plot over the longitudinal study
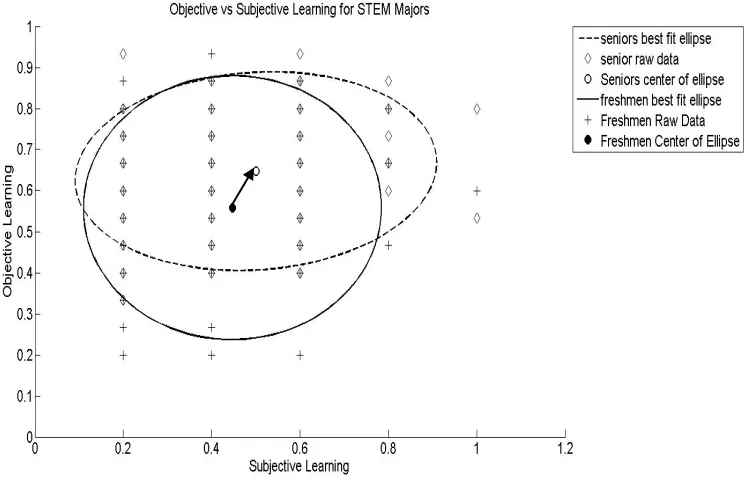
Figure 3. Interaction of objective learning and subjective learning plot over the longitudinal study – STEM
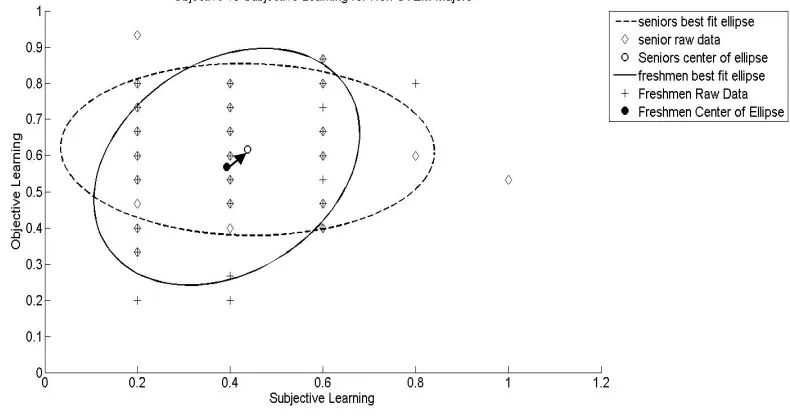
Figure 4. Interaction of objective learning and subjective learning plot over the longitudinal study – Non-STEM Majors
The Interaction of Objective Learning and Enjoyment
Allen (2013) identified two barriers which concerned academic leaders when adopting online learning approaches, the need for a more discipline student and the retention rates for online courses. The tasks with higher level of enjoyment are more likely to be completed. The level of enjoyment however, needs to be matched to the level of knowledge gained. Consequently, maintaining a balance between objective learning and enjoyment is critical to the success of online learning experiences. As with objectively learning versus subjective learning, the ideal relationship lies on the 45 degree line on the objective learning versus enjoyment plot.
The plot of the interaction of objective learning and enjoyment involves comparing a dimension which is unknown to the subject (objective learning) with one that is known (enjoyment), which measures a different dimension of the experience. Unlike objective versus subjective learning, where the subject is aware of subjective learning and unaware of the objective learning, the subject is still unaware of objective learning, but the subject is aware of enjoyment, a different dimension from learning. The 45 degree line still represents an ideal tradeoff between learning and enjoyment. Observations lying in the upper left-hand corner report are not enjoying the experience but are learning. However, if the experience is undesirable, it might not be applied regularly and appropriately. Observations in the lower right-hand corner report higher enjoyment but less objective learning. The enjoyment might lead to an unhealthy reliance on the technology. Neither situation is optional.
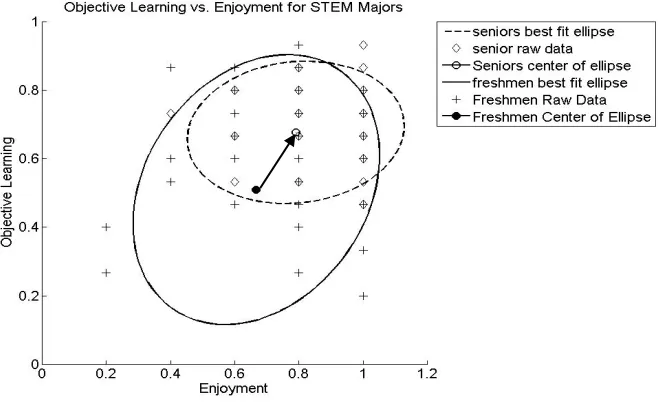
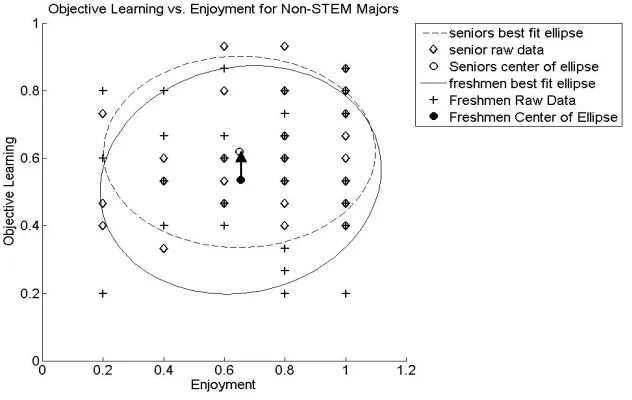
The plot comparing objective learning versus enjoyment, figure 5, reveals three effects of the three-year college experience. First, the students’ ability to understand the task has increased. The center of the ellipse has moved higher. Second, the center has also become closer to the 45 degree line. The greater increase in objective learning relative to the lesser increase in enjoyment reduces the risk associated with excess enjoyment, a greater interest in the technology than in the actual decision. Third, the area of the ellipse has decreased, indicating that the students have become less sensitive to delays in terms of the interaction of objective learning and enjoyment. The experienced gained in the three years has improved students’ interaction of objective learning and enjoyment as well as decreased their sensitivity to the delays.
Figure 5. Interaction of objective learning and enjoyment plot over the longitudinal study
Figure 6. Interaction of objective learning and enjoyment plot over the longitudinal study - STEM Majors
The Interaction of Subjective Learning and Enjoyment
Consequently, subjective learning and enjoyment ideally lie on the 45 degree line on the subjective learning versus enjoyment plot. The 45 degree line still represents an ideal tradeoff between subjective learning and enjoyment.
Using the data space for subjective learning versus enjoyment would suggest that subjective learning and enjoyment should lie along the 45 degree line rising from the origin. Observations lying in the upper left-hand corner report more subjective learning than enjoyment, while observations in the lower right-hand corner report higher enjoyment learning than subjective learning. Although deviations from the 45 degree line are less desirable they indicate the subject’s attitude. When the subjective learning is higher, upper left corner, the subject indicates that they feel they are mastering the materials but do not appreciate the medium. When enjoyment is higher, the subject is expressing a greater satisfaction in the technology than the task. Given a task based on Fourier series, the choice of majors should impact the results.
Figure 7. Interaction of objective learning and enjoyment plot over the longitudinal study – Non-STEM Majors
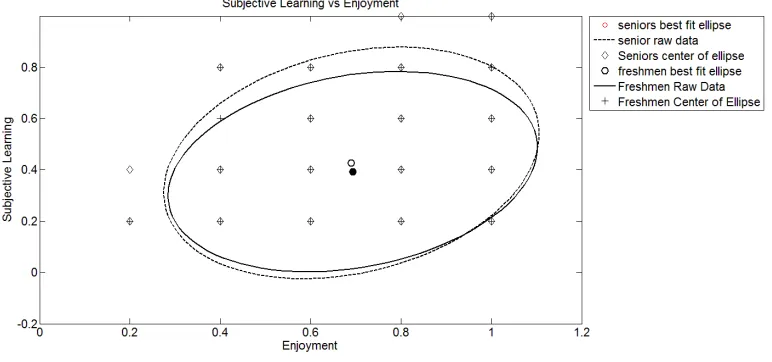
Figure 8. Interaction of subjective learning and enjoyment plot over the longitudinal study
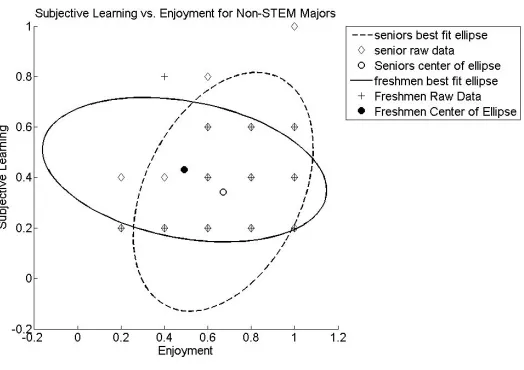
The difference between students who chose STEM majors and those who chose non-STEM majors are apparent in figures 9 and 10. The centers of all of the ellipses are in the lower right corner, indicating more enjoyment than confidence. Both groups’ centers move closer to the 45 degree line. However, the adjustment is very different. Students who chose STEM majors have gained more confidence while achieving a small increase in enjoyment. Students who chose non-STEM majors demonstrated a small increase in confidence but a greater decline in enjoyment. Given the nature of the task and the differences in their program, the decline in interest in the task is not unexpected.
Figure 9. Interaction of subjective learning and enjoyment plot over the longitudinal study - STEM Majors
Figure 10. Interaction of subjective learning and enjoyment plot over the longitudinal study – Non-STEM Majors
CONCLUSIONS AND LIMITATIONS
When the students were separated by their choice of major, STEM versus non-STEM differences became evident. In reference to the interaction of objective and subjective learning, students who chose a STEM major experienced a greater increase in their objective learning when compared to the perceptions. Students who chose a non-STEM major tended to proportional gains in their objective learning and their perception of its increase. In reference to the objective learning versus subjective learning, students who chose a STEM major had become less sensitive to the delays, while students who chose a non-STEM major became more sensitive to the delays. When the interaction between objective learning and enjoyment was studied based on the choice of major, only students who chose non-STEM majors change their level of enjoyment, which decreased. The differences between students who chose STEM majors and those that chose non-STEM majors were observed with the interaction of subjective learning and enjoyment. Students who chose STEM majors gained more confidence and enjoyment while students who chose non-STEM majors had only an increase in confidence and a decline in enjoyment. While students who chose STEM majors do not appear to be affected by the delays, students who chose non-STEM majors did reduce their sensitivity to delays. As online education progresses, the combination of the message and the type of audience will affect the amount of reinforcement to provide and what level of engagement needs to be maintained.
These observations must be considered along with four possible limitations which were inherent in the study. First, as indicated at various points in the discussion of the results, the nature of the task may have an impact on the results. These results could be driven by a task centered on Fourier series, a more familiar task for students choosing a STEM major. Further studies must investigate various tasks to determine what if any generalizations can be made across all of e-learning. Second, when considering the interactions of objective learning and subjective learning, further research would be warranted to verify that changes in confidence is caused by the additional online experiences gained during college. Shifts in confidence would have implications about the appropriateness of online experiences for leaning various types of tasks. Third, the impact of the enjoyment dimension might reflect the students’ perception of the experimental nature of the task as opposed to a real learning experience. Fourth, this study omits the process of reflection. Kolb (1976; 1981; 1984) and his associate Fry (Kolb and Fry 1975) explored the processes while making sense of concrete experiences and the different styles of learning that may be involved. Students may gain experience by performing various steps of a problem, but not have the ability to put the experience in words. Learning styles are often ignored in this type of experimental learning. While students were actively engaged in the “Network latency problem”, and the students were given an opportunity to contemplate their actions, and make an intellectual decision, they were not given the opportunity to express these actions in their own words. And while this experimental leaning model did take into account simulations, it does not apply to all different learning styles such as memorization. And this might have a significant effect on the results of STEM vs non-STEM majors. The use of online education must be appropriately understood to enhance decisions about its application and its development.
AUTHOR BIOGRAPHIES
Dr. H. Francis Bush is a Professor of Accounting at the Lynchburg College. He received a B.A. in Mathematics from the State University of New York at Buffalo, NY, his Masters of Accountancy from The Ohio State University and his PhD from the University of Florida. At VMI he teaches Principles and Intermediate Accounting, Financial Statements Analysis, and Statistics. Email: [email protected] (corresponding author)
Dr. Vonda K. Walsh is a retired† Professor of Applied Mathematics at Virginia Military Institute. She received her B.S. in Mathematics from the University of Virginia’s College at Wise, her M.S. in Pure Mathematics from Virginia Tech and her Ph.D. in Biostatistics from the Medical College of Virginia/Virginia Commonwealth University School of Medicine.
Dr. Jay Sullivan, Associate Professor of Mechanical Engineering at the Virginia Military Institute, received his B.S.M.E. from the University of Vermont and his Ph.D. from Rensselaer Polytechnic Institute. He has held teaching positions at the University of Michigan-Dearborn, and the University of Vermont. Prior to joining the faculty at the Virginia Military Institute in the fall of 2004, he was employed by JMAR Inc. where he was involved in research and development of X-ray lithography systems for the semiconductor industry. E-mail: [email protected]
as a Military Intelligence officer during Desert Storm. Although his PhD is in electrical engineering, he completed his doctoral work in a biomedical engineering laboratory at MIT and has interests in analog and digital instrumentation, signal processing, biomechanics, patent litigation, and cardiology. At VMI he teaches analog circuitry, continuous time and discrete time signal processing, and advises a variety of independent study projects. E-mail: [email protected]
REFERENCES
Allen, I.E., and Seaman, J. (2013). Changing Course: Ten Years of Tracking Online Education in the United States. Retrieved
from http://www.onlinelearningsurvey.com/reports/changingcourse.pdf.
Allen, I.E., and Seaman, J. (2011). Staying the Course: Online Education in the United States, 2011. Retrieved from
http://www.onlinelearningsurvey.com/reports/goingthedistance.pdf.
Allen, I.E., and Seaman, J. (2010). Class Differences: Online Education in the United States, 2010. Retrieved from
http://files.eric.ed.gov/fulltext/ED529952.pdf.
Allen, I.E., and Seaman, J. (2008). Staying the Course: Online Education in the United States, 2008. Retrieved from
http://www.sloan-c.org/publications/survey/staying_course.
Bush, H.F. (1989). The Use of Regression Models in Analytical Review Judgments: A Laboratory Experiment. The University of Florida.
Bush, H.F., Squire, J.C., Sullivan, G.A., Walsh, V. K., English, A., and Bolen, R. (2008) An Investigation of the Effect of Network Latency on Pedagogic Efficacy: A Comparison of Disciplines. Contemporary Issues in Education Research, 1(4), pp. 11-26.
Bush, H.F. and Walsh, V.K. (2014) The Effectiveness of Daily Assessments: A Preliminary Study in Principles of Financial Accounting. American Journal of Business Education , 7(3), pp. 237-244.
Dollar, A., and Steif, P.S. (2007). Enhancing Traditional Classroom Instruction With a Web-Based Statics Course. Frontiers in Education.
Eng, Norman. (2013). The Impact of Demographics on 21st Century Education. Society, 50(3), pp. 272-82.
Han, Sun Young, and Daniel Carpenter. (2014) Construct Validation of Student Attitude Toward Science, Technology, Engineering, and Mathematics Project-Based Learning: The Case of Korean Middle Grade Students. Middle Grades Research Journal, 9 (3), pp. 27-42.
Kelley, Todd. (2010). Staking the Claim for the 'T' in STEM." Journal of Technology Studies, 36 (1), pp. 2-11.
Kennedy, T. J., and M. R. L. Odell. (2014). Engaging Students in STEM Education. Science Education International, 25 (3), pp. 46-58.
Kolb, D. A. (1976). The Learning Style Inventory: Technical Manual, Boston, MA: McBer.
Kolb, D. A. (1981). Learning styles and disciplinary differences. in A. W. Chickering (ed.) The Modern American College, San Francisco: Jossey-Bass.
Kolb, D. A. (1984). Experiential Learning, Englewood Cliffs, NJ.: Prentice Hall.
Kolb. D. A. and Fry, R. (1975). Toward an applied theory of experiential learning. in C. Cooper (ed.) Theories of Group Process, London: John Wiley.
McGonagle, Alyssa K., et al. (2014) Evaluation of STRONG-CT: A Program Supporting Minority and First-Generation U.S. Science Students. Journal of STEM Education: Innovations & Research 15.1 (2014): 52-61. Print.
Parsad, B, and Lewis, L. (2008). Distance Education at Degree Granting Post-Secondary Institutions: 2006-2007. Institute of
Education Sciences. Retrieved from http://nces.ed.gov/pubs2009/2009044.pdf.
Reisel, John R., Jablonski, M., Hanson, E. and Hosseini, H. (2010) Evaluation of Factors Affecting the Success of Improving Math Course Placement for a Summer Bridge Program. Proceedings of the ASEE 2010 Annual Conference, Louisville Ky.
Schneider, Kimberly R., Amelia Bickel, and Alison Morrison-Shetlar. (2015). Planning and Implementing a Comprehensive Student-Centered Research Program for First-Year STEM Undergraduates. Journal of College Science Teaching, 44 (3), pp. 37-43.
Simon, Rebecca A., et al. (2015). Exploring Student Persistence in STEM Programs: A Motivational Model. Canadian Journal of Education, 38 (1), pp. 1-27.
Squire, J.C., Bush, H.F., Walsh, V.K., Sullivan, G.A., and English, A. (2008). Results from a Multi-Center Investigation of the Effects of Network Latency on Pedagogic Efficiency. Computers in Education Journal, 18 (4), pp. 103-112.
Sullivan, G.A., Bush, H.F., Squire, J.C., and Walsh, V.K. (2013). The Results of a Longitudinal Study of the Effects of Network Delays on Learning. Journal of College Teaching & Learning, pp. 189-202.
Walsh, V.K., Bush, H.F., Squire, J.C., Sullivan, G.A. (2011). A Multicenter Study of Students’ Sensitivity to Screen-Update Delay.” Contemporary Issues in Education Research, 4 (6), pp. 7-14.