http://www.sciencepublishinggroup.com/j/ijae doi: 10.11648/j.ijae.20190406.13
ISSN: 2575-3851 (Print); ISSN: 2575-3843 (Online)
Comparative Analysis of Improved Maize (
Zea mays
L.)
Seeds Adoption on Smallholder Farmers’ Performance in
Fako Division, South West Region, Cameroon
Fon Dorothy Engwali
1, *, Lema Yvette Dinga
1, Asafor Henry Chotangui
21
Department of Agricultural Economics, Faculty of Agronomy and Agricultural Sciences, University of Dschang, West Region Cameroon 2
Department of Crop Science, Faculty of Agronomy and Agricultural Sciences, University of Dschang, West Region Cameroon
Email address:
*
Corresponding author
To cite this article:
Fon Dorothy Engwali, Lema Yvette Dinga, Asafor Henry Chotangui. Comparative Analysis of Improved Maize (Zea mays L.) Seeds Adoption on Smallholder Farmers’ Performance in Fako Division, South West Region, Cameroon. International Journal of Agricultural Economics. Vol. 4, No. 6, 2019, pp. 267-274. doi: 10.11648/j.ijae.20190406.13
Received: October 15, 2019; Accepted: November 7, 2019; Published: November 15, 2019
Abstract: This paper describes the socio-economic characteristics of smallholder adopters and non-adopters of improved maize seeds;
compares the physical productivity (yield) level of improved maize seed adopters’ and non-adopters’; determines the differences in cost, revenue and gross margin between smallholder adopters and non-adopters of improved maize seeds in Fako division. To achieve these objectives, data were collected from 150 adopters and 150 non-adopters of improved maize seeds and analyzed with the use of descriptive and inferential statistical tools. The results of the study show that maize production is dominated by educated married women (76.67%) with average age of 48 years for adopters and 51 years for non-adopters of improved maize seeds in Fako Division. Results also show that the average family size is 4 persons who rely on agricultural production as their main source of income and have been farming for an average of 17 years for adopters and 21 years for non-adopters of improved maize seed although without any training in maize production. The result of physical productivity (yield) revealed the existence of productivity gap between adopters and non-adopters with a significant (P < 0.001) positive difference of 297.7kg, in favour of non-adopters. In the same light, a difference in gross margin of 44,329.28 FCFA (Franc de la Communauté Financière l’Afrique) was recorded in favour of adopters of improved maize seeds. Therefore, improved maize seed can be considered as one of the empowerment tools with the potential of boosting farm productivity, increasing farmers’ income, increase food security and welfare of farmers in the long run.Keywords: Improved Maize Seeds, Adoption, Smallholder Farmers, Productivity, Performance
1. Introduction
Cereals being one of the major sources of food contribute close to 50% of the total dietary energy supplies (kcal). Indeed, cereals are the basis of human food in Cameroon, providing 36.2% calorie intake and 40% protein intake. Maize being one of the main cereal crops, contributes to the entire country 19.5% and 22% of caloric and protein intakes respectively, showing its significance in the population’s nutrition [1]. According to “Association Citoyenne de Defense des Interets Collectifs” (ACDIC) maize is a very strategic crop in terms of food security and sovereignty and a major source of income for more than three million smallholders in Cameroon [2]. In family farms, maize
occupies a central place and determines the layout of associated crops. At the socioeconomic level, the maize market amounts to about 25 billion FCFA per year and is a source of employment for an increasingly high number of citizens [3, 4].
national dishes. Examples are koga in Cameroon, akamu in northern Nigeria, in jerain Ethiopia and ugali in Kenya [6]. It also serves as the first ingredient in the manufacture of cattle feed and is indispensable in aviculture accounting for 65% of the input for manufacturing poultry feed and also as raw material for brewing beer and for producing starch [7].
Nowadays, agriculture is practiced using simple and traditional farm implements. Under these conditions, most farmers cultivated maize without using the improved pure seeds and modern inputs. This explains the low crop yield of 1-2 t ha-1 (non-adopters) in traditional farms as compared to high yields of 3-10 t ha-1 (adopters) obtained in modern farms which use improve varieties of pure seeds [8, 9].
Productivity increases can reduce farmer’s poverty by increasing their income, reducing farm prices, and thereby enhancing increment in food consumption [10]. Increasing agricultural productivity and hence production using the improved agricultural technologies is a precondition for achieving food security in Cameroon without food aids. As long as farmers continue to use traditional low yielding crop varieties, agricultural productivity will remain low [3, 4].
Cameroon has a potential for increasing the production of maize in the country. However, it has been observed that despite the efforts made by the government and research institutes particularly through the introduction of new varieties of maize, the production of maize in the country does not meet national demand [11]. The low production is partly explained by an article published on the launching of March 2012 farming season in Cameroon (“Cameroun Tribune”) which stated that apart from some few mechanized industrial exploitations or farms, agriculture in Cameroon is essentially traditional. With subsistence agriculture, manual work, reduced cultivated surface area, traditional farming methods and low yields are insufficient to meet both domestic and external demand for food. This article reveals that Cameroon is forced to import large quantities of cereals (rice, maize) to fill the gap in production, feed its population and meet the demands of the brewing industries. This is backed by whose reports revealed that as of 2015, maize production stood at 2,148,679 metric tons with an increase of 4.2% as compared to 2014 but still does not satisfy local demand that stands at 3 million metric tons [11].
Cameroon’s maize production increased from 1572 (in 1000 metric tons) in 2011 to about 2200 (in 1000 metric tons) in 2017 [12]. Despite these increases in production, Cameroon maize yield per hectare fluctuated substantially in recent years with an estimated yield of 2222.4 kg ha-1 in 2006 dropping to about 1974.1 kg ha-1 in 2010 and back to 2024 kg ha-1 in 2011. The yield per hectare dropped in consecutive years right down to 1792.9 kg ha-1 in 2016. Despite the importance of maize, its yields in Cameroon are estimated at 2.1 t ha-1 which is much lower than the world average of 5 t ha-1 [13]. This production gap is partly due to the fact that maize output from traditional farmers remains low (1.5 to 2.6 t ha-1) and is generally lower by 50% to 80% than optimum yield, which is easily accessible with research-driven technology [4]. The low productivity of the crop requires the
country to meet the domestic deficits in demand with maize imports from other countries.
In this effect, several measures have been taken by the government to improve farm yield for maize. The government in the last five years through diverse programs including National Program support for maize sector (PNAFM) since 2006 has invested close to 60 billion FCFA in improved seed in order to boast maize production. This is estimated at 1.8 million metric tons against national demand of 2 million tons which is on a positive path to pursuing the goal of improve maize production in the country [14]. The outcome of this program has been a significant increase of improved seeds from 34 tons in 2013 to 183 tons in 2014. In spite of these significant increases, some farmers still hold on firm to their traditional methods even when most of them may be aware of the potentials of this input to increase yield [14].
In order to prevent food importation arising from these food shortages from using up an important proportion of the nation’s foreign exchange and make the country self-reliant in food production, various research institutes have embarked on developing high yielding varieties of crops and livestock, in order to increase yield per unit area of land. The government through extension services has been playing active role of assisting the farmers to adopt these new technologies [3, 4]. Various researchers working under different agro-climatic condition reported that productivity levels can be enhanced through the use of improved technology and improvement in the technical efficiency of resource use like improved seeds [15-17].
In this regard, the Cameroon government in collaboration with the Ministry of Agriculture and Rural Development, South West Development Authority (SOWEDA), Institute of Agricultural Research for Development (IRAD) and other organizations such as CIMMYT and IITA embarked on providing farmers with improved maize varieties through the NCRE (National Cereals Research and Extension) team in 1990 to increase maize output. Some of the improved varieties include; “Cameroon Maize Series (CMS)”9015, 8602, 8806, 8503, 8501, 8507, 8710, 8704, 8509, Kasai variety, ATP variety, Coca variety and PANA variety with a potential mean yield of 7 t ha-1 exposing a productivity gap between improved seed users and non-users.
This study sought to evaluate the differences in performance due to improved maize seed adoption by smallholder farmers in Fako division and especially to describe the socio-economic characteristics of smallholder adopters and non-adopters of improved maize seeds. Also, it aimed at comparing the physical productivity (yield) and determining the difference in cost, revenue and gross margin between smallholder adopters and non-adopters of improved maize seeds
2. Methodology
2.1. Presentation of the Study Area
zone of Cameroon which administratively covers the West region, North West region and South West region of the country. The Southwest region of Cameroon covers an area of 24.910Km2 representing 5.2% of the surface area of the country [18]. The different divisions of the South West region include; Manyu, Lebialem, Ndian, Meme, Kupe-Manenguba and Fako division. Fakodivisionthe study area has five subdivisions which includes; Muyuka, Buea, Tiko, Limbe and Idenau (UK Survey report, 2009). It has a total population of 534,854 inhabitants as of 2001 and covers a total space of 2093km2 [19].
The main economic activity of the people of Fako Division of the South West region is agriculture occupying approximately 60% of its population [3, 4]. Fako division practice both food and cash crop cultivation. Some of the cultivated varieties include; Colocasia esculenta (cocoyam), Musa paradisiaca (plantains), Manihot esculenta (cassava), Zea mays (maize), vegetables, Musa acuminate (banana), Theobroma cacao (cocoa), Coffea Arabica (coffee), Dacroydes edulis (plums), Phaseolus vulgaris (beans), Elaeis guineensis (oil palm), Dioscorea alata (yams), Camellia sinensis (tea), Hevea brasiliensis (rubber) etc.
2.2. Sampling Technique and Sample Size
The study focused on smallholder maize farmers in Fako division of the South West region who are estimated to be about 1000 in number with unit of analysis being adopters and non- adopters of improved maize seeds in the locality. In
this study, qualitative and quantitative data were collected from both primary and secondary sources. The data were collected through the use of a face-to-face interview and well-structured questionnaires. The questionnaire was elaborated around a list of precise points that are related to the topic under study consisting of open and close-ended questions. In order to constitute this sample, a multi-stage random sampling technique was used.
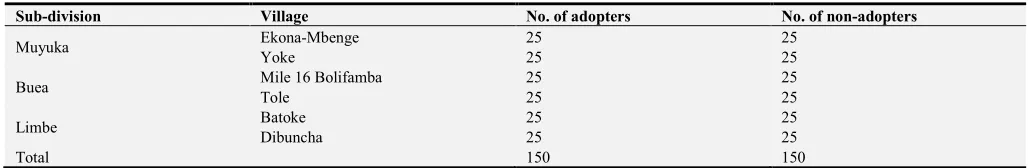
Firstly, a random sampling of three maize producing sub-divisions in Fako (Muyuka, Buea, and Limbe) was carried out. For each sub-division, a random sampling was done by collecting a list of farmers cultivating maize either from MINADER, Sub- divisional Delegation of Agriculture, SOWEDA, and IRAD, chief of post or extension agents depending on which is easily accessible in the area. The list was further separated into adopters and non-adopters with the help of the worker in charge of any of the above-mentioned structures. Secondly, two villages were randomly selected from each subdivision namely; Ekona-Mbenge and Yoke in Muyuka out of eighteen villages; Mile 16 Bolifamba and Tole out of 67 villages in Buea; Batokeand Dibunchamaking a total of six villages for this study. These villages were selected based on accessibility and the availability of farmers, constant rainfall and year round maize production (the case of Dibuncha). Lastly, 50 maize-producing farmers were randomly selected from each of the six villages comprising 25 adopters and 25 non-adopters making a total of 300 farmers (150 adopters and 150 non-adopters) (Table 1).
Table 1. Geographic distribution of respondents.
Sub-division Village No. of adopters No. of non-adopters
Muyuka Ekona-Mbenge 25 25
Yoke 25 25
Buea Mile 16 Bolifamba 25 25
Tole 25 25
Limbe Batoke 25 25
Dibuncha 25 25
Total 150 150
2.3. Data Analysis
The methods adopted in this study consisted of both descriptive and inferential methods of analysis. The descriptive statistics consisted of the use of percentages, frequency tables and gross margin analysis. The inferential statistics consisted of the student ‘t’ mean comparative test [20-23].
2.3.1. Mathematical Expression for Physical Productivity (Yield)
The physical productivity (yield) of individual farmers was calculated by dividing the total production (TP) of each individual farmer by the total area cultivated for adopters and non-adopters. Furthermore, the mean physical productivity was computed for the two sets of farmers (adopters and non-adopters) of improved maize seeds. The mathematical equation for physical productivity is given as;
ℎ = /
(kgha-1) (1)
Mean comparison test was carried and the hypothesis tested.
The hypotheses of this test are;
H0=Average yield for adopters=Average yield for non adopters
Ha=Average yield for adopters>Average yield for non-adopters
2.3.2. Mathematical Expression for Gross Margin
farm]. This is consistent with the approach used by [23, 20]. It is mathematically expressed in equation 2
GM=TR–TVC (2)
In this study, the variable cost for maize production includes; land rent (PX1X1), improved seed cost (adopters)/local seed cost (non-adopters) (PX2X2); mineral
fertilizer cost (PX3X3); animal manure cost (PX4X4); pesticide cost (PX5X5); tilling, sowing, fertilizer application, insecticide application and weeding labour cost (PX6X6); harvesting (PX7X7) and post harvest labour cost (transport, drying, storage cost) (PX8X8)
Hence, TVC are mathematically expressed for adopters and non-adopters as
TVC=PX1X1+PX2X2+PX3X3+PX4X4+PX5X5+PX6X6+PX7X7+PX8X8+...+PXnXn (3)
Note:
PX2X2 is the cost of improved maize seeds for the case of adopters or the cost of local seeds for the case of non-adopters.
In equation 2, the total revenue (TR) is equal to the price of maize times the quantity (PyY). Hence, the producers’ gross margin (GM) computed by replacing the TVC expression of equation 3 into equation 2 is
GM=PyY-PX1X1+PX2X2+PX3X3+PX4X4+PX5X5+PX6X6+PX7X7+PX8X8+...+PXnXn. (4)
Where;
X1, X2, X3, X4, X5, X6, X7, X8 are the intensities of input X1 to X8 with X1: land area, X2: Improved seed/Local seed, X3: Mineral fertilizer, X4: Animal manure, X5: Pesticide, X6: Tillage, sowing, fertilize application, insecticide application and weeding labour, X7: Harvesting labour, X8: Post harvest labour (transport, drying, storage cost); PX1, PX2, PX3, PX4, PX5, PX6, PX7, PX8: Prices of inputs X1 to X8; Y: Maize quantity (in kilograms); Py: Maize price (in FCFA); GM: Gross margin of producer; TVC: Total variable costs.
After estimating the gross margin, comparison was carried out between adopters and non adopters of improved maize seeds using the mean comparison test as shown below; In order to carry out a mean comparison test, the average of a series of gross margin was calculated for the two categories of producers (adopters and non-adopters of improved maize seed).
The hypotheses of this test are;
H0=Average (mean) gross margin for adopters=Average gross margin for non adopters
Ha=Average (mean) gross margin for adopters>Average gross margin for non-adopters
3. Results and Discussion
3.1. Socio-Economic Characteristics of Respondents
Generally, results revealed the dominance of women (76.67%) amongst farmers involved in maize production in Fako division. For adopters, the male gender made up 31.33% of the overall respondents while 68.67% were females. Similarly, for non-adopters men made up only 15.33% while 84.67% were women (Table 2). The dominance of the female sex in maize production is in conformity with previous results that indicated the predominance of women in the maize production sector in the North West region of Cameroon [24, 25]. This can be explained by the fact that women consider farming as a full time job through which they can assist their families. Also, the result corroborates findings that women carry out the bulk of the production processes in Sub-Saharan Africa [26]. This could be explained by the fact that men are less involved in maize
production because most men in Fako division do not take farming as a primary activity. However, this result is contrary to some research results that identified a number of potential sources of underestimation of female employment in labour markets, and in agriculture in particular and noted that women in Latin America consider their home as their primary responsibility, even if they are heavily engaged in agriculture [27].
Only 18% of the respondents where aged below 40years showing that most of the farmers were above the active working age with mean age of 48.77 and 51.66 for improved maize seed adopters and non-adopters, respectively (Table 2). Majority of adopter farmers are aged between 40-49 and 50-59 (26.67% and 35.67% respectively). Results also revealed that 56% of the respondents are aged above 50 years (Table 2). This is in accordance with some results which revealed that the heads of the sample households were of average age 43 years and old aged respondents were observed to adopt the new varieties with a positive correlation between adoption and the experience gained by age [28]. This finding is contradictory to findings that young farmers are more likely to adopt a new technology because they have had more schooling and are more open to attitude change than older farmers [29]. In addition, a relatively large proportion of youths are not involved in maize production and can be justified by the tendency of youths to migrate from the rural areas to urban centres and foreign land either in search of greener pastures to better off their lives or for educational purposes. While others get more involved in non-agricultural activities such as; motorcycle riding, taxi driving and petty trade for the males; phone booth business and petty trade for the females. This therefore reduces the proportion of the active (younger) age group involved in agricultural activities.
the ability to understand agricultural production systems and techniques, and so they have the capacity to undertake agricultural production activities with fewer constraints [25]. Other results reported that farmers who are more educated are generally more open to innovative ideas and new technologies that promote technical change. The result also
indicates that only 6.66% of the non-adopters have no formal education against 93.33% who have undergone formal education. Their non-adoption of improve maize varieties can be explained by the fact that some farmers still hold on their traditional beliefs and perception to changes [30].
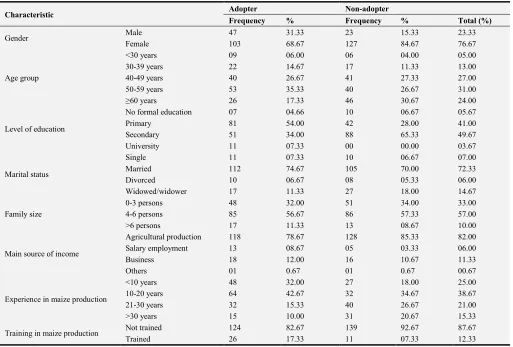
Table 2. Socio-economic characteristics of surveyed improved maize seed adopters and non-adopters in Fako Division.
Characteristic Adopter Non-adopter
Frequency % Frequency % Total (%)
Gender Male 47 31.33 23 15.33 23.33
Female 103 68.67 127 84.67 76.67
Age group
<30 years 09 06.00 06 04.00 05.00
30-39 years 22 14.67 17 11.33 13.00
40-49 years 40 26.67 41 27.33 27.00
50-59 years 53 35.33 40 26.67 31.00
≥60 years 26 17.33 46 30.67 24.00
Level of education
No formal education 07 04.66 10 06.67 05.67
Primary 81 54.00 42 28.00 41.00
Secondary 51 34.00 88 65.33 49.67
University 11 07.33 00 00.00 03.67
Marital status
Single 11 07.33 10 06.67 07.00
Married 112 74.67 105 70.00 72.33
Divorced 10 06.67 08 05.33 06.00
Widowed/widower 17 11.33 27 18.00 14.67
Family size
0-3 persons 48 32.00 51 34.00 33.00
4-6 persons 85 56.67 86 57.33 57.00
>6 persons 17 11.33 13 08.67 10.00
Main source of income
Agricultural production 118 78.67 128 85.33 82.00
Salary employment 13 08.67 05 03.33 06.00
Business 18 12.00 16 10.67 11.33
Others 01 0.67 01 0.67 00.67
Experience in maize production
<10 years 48 32.00 27 18.00 25.00
10-20 years 64 42.67 32 34.67 38.67
21-30 years 32 15.33 40 26.67 21.00
>30 years 15 10.00 31 20.67 15.33
Training in maize production Not trained 124 82.67 139 92.67 87.67
Trained 26 17.33 11 07.33 12.33
The survey for marital status indicated that 72.33% of respondents are married against 27.67% who are not (single, widow/widower and divorced). The results further revealed that 74.67% of adopters are married against 25.33% non-married (single, widow/widower and divorced) while 70% of non-adopters are married against 30% non-married (single, widow/widower and divorced). This greater proportion of married farmers can be attributed to the fact that the farmers want to reduce labour cost as the larger the family size the larger the labour force hence reduction in the labour cost.
The findings of respondent family size revealed that 57% of the respondents have a family size between 4-6 persons with mean family size of 4.32 and 4.33 for adopters and non-adopters respectively. This implies that the relatively large household size may likely enhance family labour supply on the farms, hence reducing cost of production and increasing yield. On this basis, it can be concluded that the farmers’ families are large enough to supply on-farm labour.
The result of income size indicates that 82% of the respondent’s main source of income is agricultural
production. For improved maize seed adopters 78.67% of the respondents have agricultural production as their main source of income. Others are involved in trade and business, civil servants, hair-dressing, craft work, livestock farming and driving. The results for non-adopters indicate that 85.33% of the respondents have agricultural production as their main source of income with others involved in trade and business, civil servants, hair-dressing, craft work, livestock farming and driving (Table 2).
increasing years of farming, farmers gain experience to the advantage of increasing productivity [31]. This also helps to identify the respondents as farmers who have perhaps lived all or most of their lives in farming.
Moreover, the result presented in table 2 indicates that only 12.33% of respondent had training in maize production. 17.33% of improved maize seed adopters have had training in maize production and 82.67% have no training while only 7.33% of the non-adopters have had training in maize production. It can be observed that a higher percentage of adopters were trained than non-adopters. This could partly be the reason for their adoption. It could also be due to the fact that the farmers are not able and willing to form groups such as CIG’s, (Common Initiative Groups), cooperatives through which they could obtain training services from the various organisations.
3.2. Disparity in Physical Productivity Levels Between Improved Maize Seed Adopters and Non-adopters
Physical productivity is one of the important indicators of agricultural performance. In order to compare the performance of adopters and non-adopters in this study, the physical productivity was used as one of the important measurements of performance.
The result pertaining to analysis are presented in table 3 which confirms that there exist a significant (P < 0.001) productivity gap between improved maize seed adopters and non-adopters with a positive difference of 297.7 kg (Table 3).
Table 3. Physical productivity gap between improved maize seed adopters and non-adopters.
Categories Mean yield (kg ha-1)
Improved seed adopters 1391.88
Non adopters 1094.17
Difference (Productivity gap) 297.70
Ho: difference = 0
T-value= 5.45 Significant at 1% level
Results show that there exists a significant difference in mean productivity in favour of adopters. This result is in conformity with that in Uganda’s maize sub-sector which revealed that farmers who applied fertilizer on market sourced improved (MSI) seeds obtained a higher average yield [32]. It is also in line with the findings of a study which revealed that hybrid maize seed users alongside several other key descriptors experienced a mean yield over three times as much per farm compared to non-users [33].
3.3. Cost, Revenue and Gross Margin Gaps Between Adopters and Non-adopters
3.3.1. Cost Gap Between Improved Seed Adopters and Non-adopters
The results pertaining to this analysis are presented in table 4 and indicates that the average total production cost for improved seed adopters is 239,112.7 FCFA whereas that of non-adopters stands at 125,952.3 FCFA giving a difference
of 113,160.3 FCFA. Therefore, the cost level for improved seed adopters and non-adopters are not the same. With the t-value of 5.56, it is obvious that the average production cost for an improved seed user is significantly greater than that of a non-user at P < 0.001 (Table 4).
Table 4. Cost gap between improved maize seed adopters and non-adopters.
Categories Mean cost values (FCFA)
Improved seed adopters 239112.7
Non adopters 125952.3
Difference (cost gap) 113160.3
Ho: difference = 0
t-value= 5.5661 Significant at 1% level 1 US$ = 598 FCFA
This can be explained by the fact that most adopters make use of more advance farm inputs, which are very costly, like fertilizers, insecticide and herbicide as previously reported by [23]. The results revealed that, the consumption budget for maize crop for the producers of maize seeds and producers of maize for consumption in total spent on purchasing of input is 245,825 FCFA/ha and 157,675 FCFA/ha respectively. This result is in the same light with the results that adopters of farm technologies had more output, made more expenditure and generated more income and net profit than the non-adopters of the selected farm technologies [20, 34].
3.3.2. Revenue Gap Between Improved Maize Seed Adopters and Non-adopters
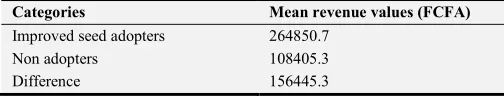
The results in table 5 indicate that the average total revenue for improved seed users is 264,850.7 FCFA whereas that of non-adopters stands at 108,405.3 FCFA hence depicting a difference of 156,445.3 FCFA. The test therefore shows that the revenue level for improved seed adopters and non-adopters are not the same. The average total revenue for an improved seed user is significantly (P < 0.001) greater than that of a non-user. These results corroborate the findings whose analysis of costs and returns revealed that the average variable cost per hectare for adopters was N47, 11.5, and gross revenue was N95, 462.9 with a gross margin of N48, 351.40 per hectare in favour of adopters [20, 34].
Table 5. Revenue gap between improved maize seed adopters and non-adopters.
Categories Mean revenue values (FCFA)
Improved seed adopters 264850.7
Non adopters 108405.3
Difference 156445.3
Ho: difference = 0
t-value= 6.2476 Significant at 1% level
3.3.3. Gross Margin Gap Between Improved Seed Adopters and Non-adopters
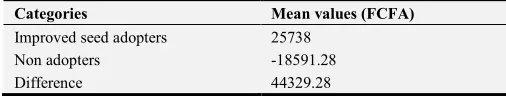
Table 6. Gross margin gap between improved maize seed adopters and non-adopters.
Categories Mean values (FCFA)
Improved seed adopters 25738
Non adopters -18591.28
Difference 44329.28
Ho: difference = 0
t-value= 6.3058 Significant at 1% level
The results presented in table 6 indicate that the average gross margin for improved seed users is significantly greater than that (25,738 FCFA) of non-adopters. The test therefore shows that on average, improved seed users make a gain whereas non-users incur losses. Hence, the gross margin or profit level for improved seed adopters and non-adopters are not the same corroborating previous findings by [20, 34].
4. Conclusion
After investigations and analyses, the study concludes that smallholder adopters and non-adopters of improved maize seed are affected differently by the socio-economic characteristics that were chosen in the study. Firstly, the percentage of female respondents were higher than males with higher percentages of secondary and higher education for adopters which could like be a contributing factor for their adoption. In addition, adopters of improved maize seeds were younger with a greater diversity of income source than non-adopters. Although, there was no difference in the family size and marital status for improved maize seed adopters and non-adopters, non-adopters of improved seeds proved to have a higher experience in farming compared to adopters.
There exists significant difference in physical productivity, cost, revenue and gross margin in favour of improved maize seed adopters. It is important to note that the non adopters of improved seeds tend to spent 18,591FCFA more during investment which they are unable to recover after production. Therefore, improved maize seed can be considered as one of the empowerment tools with the potential of boosting farm productivity, as a yield difference of 297kg ha-1 indicates and, increasing farmers’ income as revealed by a gross margin difference of 156,445FCFA ha-1. There could also be alongside these
indicated positive results, an increase in food security and welfare of farmers in the long run.
References
[1] Food and Agriculture Organization (FAO), (2012). The State of Food Insecurity in the World Economic growth is necessary but not sufficient to accelerate reduction of hunger and malnutrition. Page 1-5.
[2] Association Citoyenne de Defense des InteretsCollectifs (ACDIC), (2009). Accroître la production de maïs pour éviter la crisealimentaire–ONG locale. IRIN, the Inside story on emergencies Page 2-4.
[3] Ministère de l’Agriculture et du Développement Rural (MINADER) (2005). Evolution des productions agricoles au Cameroun au cours de la dernièredécennie (1993/94-2003/04). Actions menéesetmesuresenvisagées. Rapport d’étude.
[4] Ministère de l’Agricultureet du Développement Rural (MINADER) (2006). Stratégie de Développement du SecteurRural: Synthèse du volet agriculture et développement rural. Document de travail, République du Cameroun.
[5] International Institute of Tropical Agricultural (IITA). (2007a). Maize. IITA Research to Nourish Africa. Accessed throughwww.iita.org on the 15/07/2017.
[6] International Institute of Tropical Agricultural (IITA). (2007b). Doubling maize production in Nigeria in two years. Accessed through www.iita.org on the 15/07/2017.
[7] International Institute of Tropical Agricultural (IITA). (2008). Increasing maize production in West Africa. Accessed through www.iita.org on the 15/07/2017.
[8] Etoundi, S. M. and Kamgnia D. B. (2008). Determinants of the adoption of improved varieties of Maize in Cameroon: case of CMS 8704. Proceedings of the African Economic Conference., Chap. 17, pp 397-413.
[9] Awotide D. O. and Mafouasson, H. N. (2014). Small-scale Seed production in West and Central Africa: Profitability, Constraints and Options. American Journal for Agriculture. Forest. Vol; 3, 1, 1-10.
[10] Diagne, Alia, Wopereis, Saito, Nakelse and Seck, (2009). Impact of Rice Research on income, poverty and food security in Africa: An Ex-ante Analysis. African Rice Center Cotonou, Benin.
[11] World Bank (WB), (2016). Cameroon-Cereal yield (kg per hectare) in Cameroon was reported at 1644 in 2016, according to the World Bank collection of development indicators, compiled from officially recognized sources. Page 1-2. [12] United State Department of Agriculture (USDA), (2017).
Cameroon Corn Production by Year (1000MT). Index Mundi.
https://www.indexmundi.com/agriculture/?country=cm...co rn&graph=production. Chart and table showing historical data - Cameroon Corn Production by Year (1000 MT). [13] World Bank, (2015). Annual report of world Agricultural
Gross Domestic Product (GDP) overview FAO.
[14] Institut de RechercheAgricole pour le Développement (IRAD), (2015). Rapport Annuel D’ activites de l’Institut de Recherche Agricole pour le Développement.
[15] Langyintuo, A. S., Mwangi, W., Diallo, A. O., MacRobert, J., Dixon, J. and Bänziger, M. (2008). An analysis of the bottlenecks affecting the production and deployment of maize seed in eastern and southern Africa. Harare, Zimbabwe, CIMMYT.112pp.
[17] Musa H. A., Kassahun M. G., Aemro T. and Eden A., (2017). The Impact of Improved Maize Varieties on Farm Productivity and Wellbeing: Evidence from the East Hararghe Zone of Ethiopia. Pages 9-21 | received 21 Apr 2017, Accepted 30 Oct 2017, Published online: 04 Dec 2017. Journal Development Studies Research An Open Access Journal Volume 4.
[18] Besong Manfred, (2011). Improving Agricultural Production and Productivity of Smallholders Farmers through Increased Access to Improved Planting Materials: Evidence from Southwest Region, Cameroon. Agricultural economist Senior Research Officer.
[19] National Geospatial Intelligence Agency and Department of Defense Combact Support Agency, (2012) report. Cvuv.cm/national/index.php/fr/carte-communale/region-du- sud/142-association/carte-administrative/sud-ouest/fako/404-buea
[20] Abdullahi A., (2012), Comparative Economic Analysis of Rice Production by Adopters and Non-Adopters of Improved Varieties among Farmer in Paikoro Local Government Area of Niger State. Nigerian Journal of Basic and Applied Science, 20 (2).
[21] Berihun, Bihon and Kibrom, (2014). Adoption and Impact of Agricultural Technologies on Farm Income: Evidence from Southern Tigray, Northern Ethiopia. International Journal of Food and Agricultural Economics ISSN 2147-8988 Vol. 2 No. 4, pp. 91-106.
[22] Awotide, Abdoulaye, Arega and Manyong (2015). Adoption of Drought Tolerance Maize Varieties for Africa, Productivity, Food Security and Welfare in Nigeria: An Ex-Post Impact Assessment. Department of Agricultural Economics, University of Ibadan, Nigeria. International Institute of Tropical Agriculture (IITA), Ibadan, Nigeria. International Institute of Tropical Agricultural, Lilongwe, Malawi. International Institute of Tropical Agricultural, Dar Es Salam, Tanzania.
[23] Jaza, F. A. J. (2007). The use of compost for the cultivation of foodstuff crops and vegetables in the villages surrounding Yaoundé (Cameroon): descriptive and production function approaches of analysis. Quarterly Journal of International Agriculture 46, No. 3: P. 221-239.
[24] Conte S., Fusillier J-L., (1993). Analyse économique de la filièremaïs au Cameroun. Direction des enquêtes agro-économiqueset de la planificationagricole, ministère de l'Agriculture.
[25] Manu, I. N., Tarla, D. N., and Chefor, G. F., (2014). Effects of improved maize (Zea mays L.) varieties on household food security in the North West Region of Cameroon. Scholarly Journal of Agricultural Science Vol. 4 (5), pp. 265-272. [26] Fon D. and Edokat T. (2012): Marginalization of Women’s
Role in Sub-Saharan Africa towards Crop Production: A Review, Agricultural Science Research Journals, Vol. 2 (9), pp. 499-505.
[27] Deere, C. D. (2005). The Feminization of Agriculture? Economic Restructuring in Rural Latin America. United National Research Institute for Social Development (UNRISD), Occasional Paper 1.
[28] Abadi T., Damas P and MotiJaleta (2015) Factors that affect the adoption of improved maize varieties by smallholder farmers in Central Oromia, Ethiopia. Developing Country Studies Vol. 5, No. 15, Pp 50-58.
[29] Visser, S. P., and Krosnick, J. A. (1998). Development strength over the life cycle: surge and decline. Journal of personality and social psychology, 75, 1389-1410.
[30] Weir, S. and Knight, J. (2000). Education externalities in rural Ethiopia: evidence from average and stochastic frontier production functions. Oxford: CSAE, Mimeo.
[31] Oyewole, S. O. and Ojeleye, O. A. (2015) Factors Influencing the Use of Improved Farm Practices among Small-Scale Farmers in Kano State of Nigeria. Net Journal of Agricultural Science, 3, 1-4.
[32] Okoboi Geofrey (2010). Of What Merit Is Improved Inputs Use In Uganda’s Maize Productivity? Contributed Paper presented at the Joint 3rd African Association of Agricultural Economists (AAAE) and 48th Agricultural Economists Association of South Africa (AEASA) Conference, Cape Town, South Africa, September 19-23, 2010.
[33] Smale Melinda, Derek Byerlee and Thom Jayne, (2013) An African Green Revolution: Maize Revolutions in Sub Saharan Africa. pp. 165-195.