Prostate cancer is the second most common cause of cancer mortality in the male population[1]. The current
treatment for prostate cancer is a combination of surgery, chemotherapy and radiation[2]. It is a hormone
dependent disease and blockade of androgen action is the foundation of most popular therapies[3]. Androgens, acting through the androgen receptor (AR), are
required for prostate development and normal prostate function[4]. AR expression is observed in primary
prostate cancer and can be detected throughout progression in both hormone-sensitive and hormone refractory cancers[5]. It is obvious that either androgen
ablation and/or application of AR antagonists lead to a reduction of tumor volume and an improvement in symptoms in most of the prostate cancer patients[3,6-12].
In recent years, a number of androgen receptor antagonists have appeared[10,13]. Among them,
synthesized ionone based chalcones derivatives act as potent antiprostate cancer compounds. Some compounds showed significant cytotoxicity against human prostate cancer cell line androgen-dependent
LNCaP as well as antiandrogenic activity was also evaluated in LNCaP cells, transfected with wild-type AR[14]. In addition, the X-ray crystal structures of
AR have been determined which provide useful information about the interaction with the residues near the binding site[15].
To date, no report on molecular modeling has been established on ionone based chalcones for anti-prostate cancer. The most popular QSAR methods, comparative
molecular field analysis (CoMFA) and comparative similarity indices analysis (CoMSIA) studies incorporate
3D information for the ligands by searching for sites on
molecules capable of being modified into better specific
ligands while hologram quantitative structure activity
relationship (HQSAR)a fingerprints technique offers
Research
Paper
CoMFA, CoMSIA, HQSAR and Molecular Docking
Analysis of Ionone-based Chalcone Derivatives as
Antiprostate Cancer Activity
R. SHARMA*, N. DHINGRA1 AND S. PATIL
School of Pharmacy, Devi Ahilya Vishwavidyalaya, Takshashila Campus, 1School of Life Sciences, Devi Ahilya Vishwavidyalaya, Takshashila Campus, Indore-452 001, India
Sharma, et al.: QSAR and Docking Study of Ionone Based Chalcones Derivatives
Androgen receptor has been proved to be effective site for treatment of prostate cancer. Molecular modeling methods performed on forty-three ionone based chalcones derivatives as anti-prostate cancer activity. The designed comparative molecular field analysis, comparative similarity indices analysis and hologram quantitative structure activity relationship models produced statistically significant results with the cross-validated correlation coefficients (q2) of 0.527, 0.550 and 0.670, non-cross-validated correlation coefficients (r2) 0.636, 0.671 and 0.746 and predicted r2 (Pred r2) of 0.621, 0.563 and 0.732, respectively. Furthermore, bioactive conformation was explored and explained by docking of the potent compound 25 into the binding site of androgen receptor. Present study deals with comparative molecular field analysis, comparative similarity indices analysis and hologram quantitative structure activity relationship and molecular docking studies of the ionone-based chalcones and their derivatives, obtained from literature. The model obtained could be effectively used as a channeling tool for further structure modification and designing of some novel potent anti-prostate cancer compounds.
Key words: Prostate cancer, CoMFA, CoMSIA, HQSAR, MOLCAD docking
*Address for correspondence
E-mail: [email protected]
This is an open access article distributed under the terms of the Creative Commons Attribution-NonCommercial-ShareAlike 3.0 License, which allows others to remix, tweak, and build upon the work non-commercially, as long as the author is credited and the new creations are licensed under the identical terms.
For reprints contact: [email protected]
sub-structural features in datasets of molecules that are important to biological activity[16-18]. Furthermore the
molecular docking analysis can offer vivid interaction picture between a ligand and receptor[19-21]. Combined
3D-QSAR and docking study could offer more information to understand the structural features of binding site of protein and the detail of protein–ligand interactions for purposive directing the design of new potential molecules.
MATERIALS AND METHODS
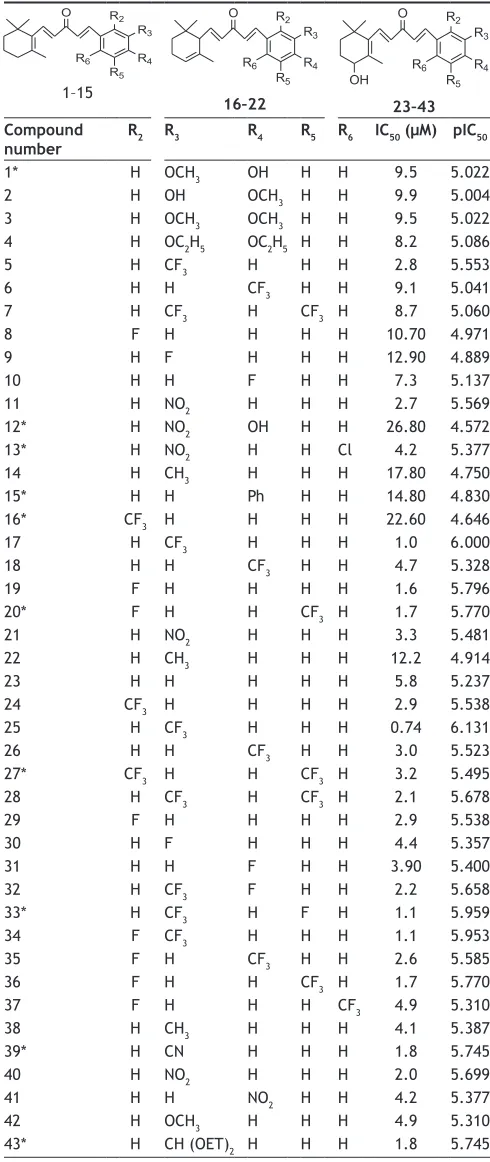
The molecular sketching and modeling calculations were performed using Sybyl X 2.0. A set of forty three anti-prostate cancer derivatives with reported IC50 μM values were taken from previous literature[14].
These activity values were converted to corresponding pIC50 (ranging from 6.131-4.572) and used as
dependent variable in QSAR studies for development of model. The structures of the compounds and their biological data are given in Table 1. In extend to examine the predictive power of the QSAR models, the dataset divided into the test set of 10 molecules
(1, 12, 13, 15, 16, 20, 27, 33, 39 and 43) and
remaining in training set were selected by diversity method in such a way that the structural diversity and wide range of biological activity in the data set were added. The structures of compounds used in training and test set shown in Table 1.
The molecular geometry of molecule was minimized by Tripos molecular mechanics force field with 0.01 kcal/molÅ energy, Gasteiger-Huckel partial atomic charges were calculated and energy minimizations were performed using the Powell method 1000 iterations. The accuracy of the prediction power based on QSAR model docking and reliability depend on contour maps according to alignment rule[22,23]. In order to obtain the best possible
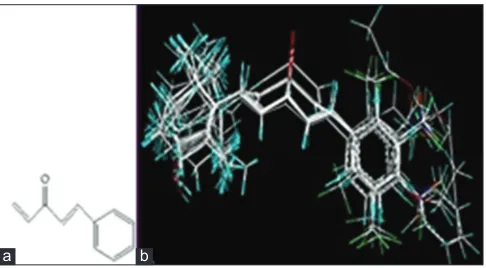
3D-QSAR statistical model all compounds were aligned using a 1-phenylpenta-1,4-dien-3-one nucleus, of compound 25 using as the template (fig. 1a) for
the alignment, because it is one of the most active compounds in dataset. An automatic alignment was carried out on dataset by using database alignment
module and aligned molecules are shown in fig.1b.
Comparative molecular field analysis:
The standard CoMFA and CoMSIA procedure applied on Sybyl X 2.0. In the CoMFA analysis, the steric
(S) and electrostatic (E) fields were calculated at
each lattice with a grid size of 2 Å using a sp3
hybridized carbon atom with +1 charge serving as a TABLE 1: STRUCTURAL FEATURES AND INHIBITORY ACTIVITY VALUES
1–15
16–22 23–43
Compound
number R2 R3 R4 R5 R6 IC50 (µM) pIC50
1* H OCH3 OH H H 9.5 5.022
2 H OH OCH3 H H 9.9 5.004
3 H OCH3 OCH3 H H 9.5 5.022
4 H OC2H5 OC2H5 H H 8.2 5.086
5 H CF3 H H H 2.8 5.553
6 H H CF3 H H 9.1 5.041
7 H CF3 H CF3 H 8.7 5.060
8 F H H H H 10.70 4.971
9 H F H H H 12.90 4.889
10 H H F H H 7.3 5.137
11 H NO2 H H H 2.7 5.569
12* H NO2 OH H H 26.80 4.572
13* H NO2 H H Cl 4.2 5.377
14 H CH3 H H H 17.80 4.750
15* H H Ph H H 14.80 4.830
16* CF3 H H H H 22.60 4.646
17 H CF3 H H H 1.0 6.000
18 H H CF3 H H 4.7 5.328
19 F H H H H 1.6 5.796
20* F H H CF3 H 1.7 5.770
21 H NO2 H H H 3.3 5.481
22 H CH3 H H H 12.2 4.914
23 H H H H H 5.8 5.237
24 CF3 H H H H 2.9 5.538
25 H CF3 H H H 0.74 6.131
26 H H CF3 H H 3.0 5.523
27* CF3 H H CF3 H 3.2 5.495
28 H CF3 H CF3 H 2.1 5.678
29 F H H H H 2.9 5.538
30 H F H H H 4.4 5.357
31 H H F H H 3.90 5.400
32 H CF3 F H H 2.2 5.658
33* H CF3 H F H 1.1 5.959
34 F CF3 H H H 1.1 5.953
35 F H CF3 H H 2.6 5.585
36 F H H CF3 H 1.7 5.770
37 F H H H CF3 4.9 5.310
38 H CH3 H H H 4.1 5.387
39* H CN H H H 1.8 5.745
40 H NO2 H H H 2.0 5.699
41 H H NO2 H H 4.2 5.377
42 H OCH3 H H H 4.9 5.310
43* H CH (OET)2 H H H 1.8 5.745
probe atom and default energy cutoff of 30 kcal/mol. The Gasteiger, Gasteiger–Hückel, MMFF, Del-Re and Pullman charges were used to generate the partial charges on the studied molecules and explored models[24].
Comparative molecular similarity index analysis:
The CoMSIA descriptors, steric (S), electrostatic (E), hydrophobic (H), hydrogen bond donor (D), and hydrogen bond acceptor (A), were generated using a
sp3 hybridized carbon atomwith +1 charge with the
attenuation factor 0.3 and a van der Waals radius of 1.4 Å; CoMSIA similarity indices (AF.K) between a
molecule j and atoms i at a grid point were calculated
by using Eqn (1) as follows
- 2
probe,k ik =1
( ) =−
∑
n Wq a
F,k iq
i
A J W e r
where q represents the grid point, i is the summation index, over all atoms of the molecule j under computation, Wik is the actual value of the physicochemical property k of atom i, and Wprobe.k is the value of the probe atom[25-27].
Hologram quantitative structure–activity relationship:
Hologram QSAR (HQSAR) is an emerging QSAR
technique. With the transformation of the chemical representation of a molecule into its corresponding molecular hologram, this method requires no explicit 3D information for the ligands. In this study, the HQSAR method with its default parameters compiled in Sybyl X 2.0 was performed by the following procedure: At first, a predefined set of rules was used to has a molecule into a molecular fingerprint that encoded the frequency of occurrence of various molecular fragment types; then, the molecular
fingerprint was cut into strings at a fixed interval
as specified by a hologram length (HL) parameter;
and at last, all of the generated strings were hashed into a fixed length array. HQSAR does not require 3D alignment for model generation and is sensitive to three parameters concerning hologram generation, including hologram length, fragment size and fragment
distinction. The distinct fragments are atoms (A), bonds (B), connections (C), hydrogen atoms (H), chirality (Ch), and donor and acceptor (DA). Initially,
various models were developed by using the default fragment size of 4–7, then based on the different fragment distinctions determined by the first step, the models were developed using different fragment sizes[11]. The better statistical results were obtained
in fragment size 4–7 and A/B/C distinct. The A/B/C distinct fragment was applied successfully to different fragment sizes[28,29].
PLS calculations and validations:
The partial least squares (PLS) methodology analysis
was carried out to determine the optimal number of components[26]. The cross-validated coefficient q2,
as an internal statistical index of predictive power, was subsequently obtained. In order to test the real predictive ability of the best model derived by the training set, biological activities of the test set were predicted. The quality of the external prediction was documented using the standard deviation of error prediction (R2). Q2 and R2 are calculated according to
the formula[30].
1− −
− ∑
∑
2 obs CVpred 2
2 obs mean (Y Y ) Q =
(Y Y )
1− −
− ∑ ∑
2 obs pred 2
2 obs mean (Y Y ) R =
(Y Y )
Where Ymean means average activity value of the entire data set, while Yobs, Ypred and YCVpred represent observed, predicted and cross-validated activity values, respectively[31].
The CoMFA/CoMSIA results were graphically interpreted by field contribution maps using field type “stdev*coeff”, and the contour levels were set to default values.
Predicted r2:
To validate the derived CoMFA, CoMSIA and HQSAR models, biological activities of an external Fig. 1: Template and data set alignment.
Template 1-phenylpenta-1, 4-dien-3-one (a) used for the and molecular alignment (b) of the dataset.
test set of ten compounds were predicted using models derived from the training set. The predictive r2 value is based on only the test set molecules, which may be defined as shown in Eqn, r2
pred=SD-PRESS/
SD. Where SD is the sum of squared deviation between the biological activities of the test set molecules to the mean activity of the training set molecules, while PRESS is the sum of squared deviations between the observed and the predicted activities of the test molecules. The predictive ability of the models is expressed by the predicted r2 (Predr2)
value, which is analogous to the cross-validated r2
value (q2), as given in Table 2[30,31].
Model acceptability criteria:
According to Alexander Tropsha and Alexander Golbraikh, a predictive model must satisfy a set of statistical criteria. A QSAR model was considered predictive if the following conditions are satisfied
(i) q2>0.50; (ii) r2>0.60[32,33].
Molecular docking:
To determine the possible binding interaction, conformations and to suggest more insight into the understanding of the binding affinity of androgen receptor antagonists, molecular docking analysis
was carried out using the Surflex Dock in Sybyl X
2.0. The crystal structure of AR was retrieved from
RCSB Protein Data Bank (PDB entry code: 1T65).
All attached ligands and water molecules have been removed at first, the polar hydrogen atoms and AMBER7FF99 charges were added. Protomol, a computational representation of the intended inhibitor
5-α dihydrotestosterone (DHT) binding site, is used
to guide molecular docking and predicted binding mode of AR antagonists in the antagonistic model[15].
The protomol bloat value was set as 1 and the protomol threshold value as 0.5 when a reasonable
binding pocket was obtained. Other parameters are established by default in software[34,35]. To visualize
the binding affinity mode between the antiprostate cancer derivatives and protomol site, the MOLCAD programme was employed to color coded display of
electrostatic potential (EP), lipophilic potential (LP) and cavity depth (CD) to validate QSAR models.
RESULTS AND DISCUSSION
The β-ionone-based chalcones 1–15, α-ionone-based chalcones 16–22 and 4-hydroxy-β-ionone-based
chalcones 23–43 showed considerable cytotoxicity in LNCaP cell line as antiprostate activity (Table 1).
Compound 25 was most potent; 5, 11, 34, 39 and 40 were moderate and 9, 17, 21 and 30 were least active ionone based chalcone compounds compared to parent analogue 25 which have electron-withdrawing group at the meta position. On displacement of -CF3 from
the meta position to the para position (6, 18 and 26)
or elimination of -CF3 with –NO2 (11, 21 and 40), –F (9 and 30), electron donating group -CH3 (14, 22 and
38) have substantially weakened the cytotoxicity in
prostate cancer cells in comparison to compound 25.
Using the series of ionone based chalcones derivatives possessing antiprostate cancer activity, 3D-QSAR models were derived. The CoMFA and CoMSIA models were developed using common substructure-based based alignment scheme. During 3D-QSAR analyses, we selected 10 compounds as the testing set for model validation (1, 12, 13, 15, 16,
20, 27, 33, 39 and 43) and remaining in training set
were selected by diversity method in such a way that the structural diversity and wide range of biological activity in the data set were added. The structures of compounds used in training and test set shown in Table 1.
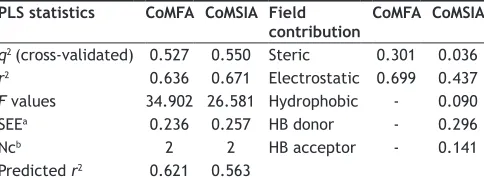
The results of the PLS statistical analyses for the alignment approaches are summarized in Table 2. The CoMFA statistical model using steric and electrostatics contribution fields were 30.1% and 69.9% respectively, gave a cross-validated correlation coefficient (q2) of 0.527, non-cross-validated correlation coefficient (r2) of 0.636, F value of 34.902, low standard error estimate (SEE) of 0.236
with an optimum number of components 2 and Pred r2 of 0.621 was obtained. The predicted activities for
the inhibitors along with the experimental activities
TABLE 2: PARTIAL LEAST SQUARES STATISTICAL ANALYSIS OF COMFA AND COMSIA MODEL
PLS statistics CoMFA CoMSIA Field
contribution CoMFA CoMSIA
q2 (cross‑validated) 0.527 0.550 Steric 0.301 0.036
r2 0.636 0.671 Electrostatic 0.699 0.437
F values 34.902 26.581 Hydrophobic ‑ 0.090
SEEa 0.236 0.257 HB donor ‑ 0.296
Ncb 2 2 HB acceptor ‑ 0.141
Predicted r2 0.621 0.563
aStandard error of estimate, bOptimum number of components, HB: Hydrogen
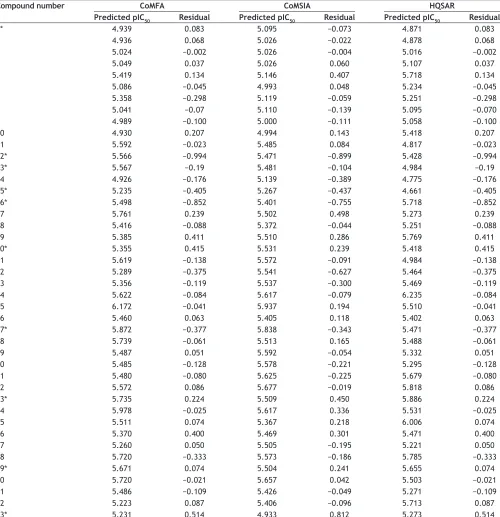
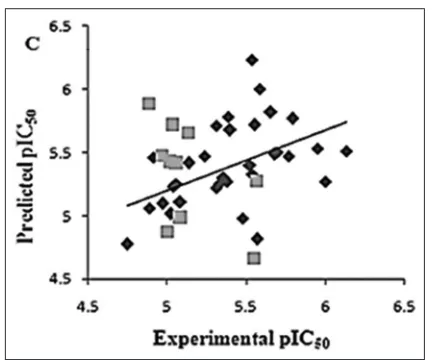
and residual values are listed in Table 3. The scatter plot for the actual pIC50 versus predicted pIC50 values for the training and test sets is depicted in
fig. 2a. Activities predicted by CoMFA model are in
agreement with the experimental data. PLS analysis and predicted activities suggest that a reliable CoMFA model was developed.
In CoMSIA analysis, hydrophobic, hydrogen-bond
donor and hydrogen-bond acceptor fields in addition
to steric and electrostatic fields were calculated. A combination of various fields was employed to obtain the optimum result. Using compounds of the training set and a combination of steric, electrostatic and hydrogen-bond acceptor fields; a model with
TABLE 3: PREDICTED AND RESIDUAL VALUE OF COMFA, COMSIA AND HQSAR RELATIONSHIP MODEL
Compound number CoMFA CoMSIA HQSAR
Predicted pIC50 Residual Predicted pIC50 Residual Predicted pIC50 Residual
1* 4.939 0.083 5.095 −0.073 4.871 0.083
2 4.936 0.068 5.026 −0.022 4.878 0.068
3 5.024 −0.002 5.026 −0.004 5.016 −0.002
4 5.049 0.037 5.026 0.060 5.107 0.037
5 5.419 0.134 5.146 0.407 5.718 0.134
6 5.086 −0.045 4.993 0.048 5.234 −0.045
7 5.358 −0.298 5.119 −0.059 5.251 −0.298
8 5.041 −0.07 5.110 −0.139 5.095 −0.070
9 4.989 −0.100 5.000 −0.111 5.058 −0.100
10 4.930 0.207 4.994 0.143 5.418 0.207
11 5.592 −0.023 5.485 0.084 4.817 −0.023
12* 5.566 −0.994 5.471 −0.899 5.428 −0.994
13* 5.567 −0.19 5.481 −0.104 4.984 −0.19
14 4.926 −0.176 5.139 −0.389 4.775 −0.176
15* 5.235 −0.405 5.267 −0.437 4.661 −0.405
16* 5.498 −0.852 5.401 −0.755 5.718 −0.852
17 5.761 0.239 5.502 0.498 5.273 0.239
18 5.416 −0.088 5.372 −0.044 5.251 −0.088
19 5.385 0.411 5.510 0.286 5.769 0.411
20* 5.355 0.415 5.531 0.239 5.418 0.415
21 5.619 −0.138 5.572 −0.091 4.984 −0.138
22 5.289 −0.375 5.541 −0.627 5.464 −0.375
23 5.356 −0.119 5.537 −0.300 5.469 −0.119
24 5.622 −0.084 5.617 −0.079 6.235 −0.084
25 6.172 −0.041 5.937 0.194 5.510 −0.041
26 5.460 0.063 5.405 0.118 5.402 0.063
27* 5.872 −0.377 5.838 −0.343 5.471 −0.377
28 5.739 −0.061 5.513 0.165 5.488 −0.061
29 5.487 0.051 5.592 −0.054 5.332 0.051
30 5.485 −0.128 5.578 −0.221 5.295 −0.128
31 5.480 −0.080 5.625 −0.225 5.679 −0.080
32 5.572 0.086 5.677 −0.019 5.818 0.086
33* 5.735 0.224 5.509 0.450 5.886 0.224
34 5.978 −0.025 5.617 0.336 5.531 −0.025
35 5.511 0.074 5.367 0.218 6.006 0.074
36 5.370 0.400 5.469 0.301 5.471 0.400
37 5.260 0.050 5.505 −0.195 5.221 0.050
38 5.720 −0.333 5.573 −0.186 5.785 −0.333
39* 5.671 0.074 5.504 0.241 5.655 0.074
40 5.720 −0.021 5.657 0.042 5.503 −0.021
41 5.486 −0.109 5.426 −0.049 5.271 −0.109
42 5.223 0.087 5.406 −0.096 5.713 0.087
43* 5.231 0.514 4.933 0.812 5.273 0.514
cross-validated correlation coefficient (q2) of 0.550, non-cross-validated correlation coefficient (r2) of 0.671, F value of 26.581, low standard error estimate (SEE)
of 0.257 with an optimized component of 2 and Pred r2 of 0.563 was obtained. The field contributions of
steric, electrostatic hydrophobic, hydrogen bond donor
and hydrogen bond acceptor fields were 0.036, 0.437,
0.090, 0.296 and 0.141, respectively.
The statistical parameters are summarized in Table 2. The predicted and experimental activities for inhibitors with their residues are listed in Table 3 and the scatter plot for the actual pIC50 versus predicted pIC50 values for the training and test sets is displayed
in fig. 2b. The predicted activities are in accordance
with the experimental data, indicating that a reliable CoMSIA model was developed.
3D coefficient contour maps were generated to visualize the results of the 3D-QSAR models. The CoMFA and CoMSIA results were graphically interpreted by the field contribution maps using the STDEV*COEFF field type. The contour maps
of CoMFA (steric and electrostatic), and CoMSIA
(steric, electrostatic, hydrophobic, hydrogen-bond
donor and acceptor fields) are shown in figs. 3 and 4,
respectively. Compound 25 was labelled and displayed in the map in aid of visualization.
In fig. 3a, the contour map of the steric field of CoMFA model, a large green contour polyhedron located around the hydroxy group suggested that appropriately bulky groups had favourable steric interactions. This may be the reason why compounds with –CF3 substituent (5, 7, 25, 28, 32 and 34) in R3
region showed potent antiprostate cancer activity than molecules with and without any substituent at this
particular position R3. Two yellow colour contours indicated that bulky groups were steric unfavourable in this direction as steric clash might occur. A small Fig. 3: Contour maps for CoMFA model.
Contour maps of compound 25 for CoMFA model (a) steric and (b) electrostatic.
Fig. 2: Correlation plot of CoMFA and CoMSIA.
Correlation between the experimental and predicted activities of (a) CoMFA and (b) and CoMSIA. ♦- Training set, ■- test set. b
a
b a
Fig. 4: Contour maps for CoMSIA model.
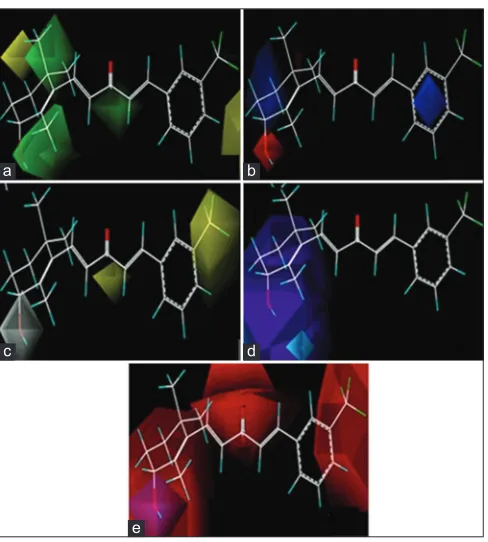
Contour maps of compound 25 for CoMSIA model (a) steric, (b) electrostatic, (c) hydrophobic, (d) hydrogen donor and (e) hydrogen acceptor contour maps for compound 25.
a b
d c
green contour beside ring was consistent with the light increase in activity.
The electrostatic contour map of CoMFA model can
be seen clearly from the fig. 3b. The blue contours
indicate that electropositive substituents would increase the AR antagonist activity with protein, while red colour indicates that they should be the electron rich groups decreased. Since the red contours were found near the hydroxy group of compound 25, which is an electron rich functionality and thus exhibit high AR antprostate cancer activity.
The steric and electrostatic contours of the CoMSIA model were similar to the CoMFA contours fig. 4.
However, in the steric field there was a green colour
and blue colour is favoured while the yellow and red coloured is disfavoured near the functional group. Yellow colour below the phenyl ring shows the requirement of less bulky substituents, while near the cyclic ring green coloured preferred for bulky
substituents (fig. 4a). For electrostatic Blue coloured
near the phenyl ring shows that electron donating group is required at that position. This contour map was similar with CoMFA model. As for the
electrostatic field, the main blue and red polyhedrons were similar with that in CoMFA model (fig. 4b).
In the hydrophobic interaction yellow colour shows that the phenyl ring is active and contributing in the lipophilicity, while white coloured near unsaturated
cyclic ring is disfavouring lipophilicity (fig 4c). In
the hydrogen bond donor interaction analysis cyan and purple coloured shows favouring and disfavouring nature with respect to biological activity near
unsaturated cyclic ring (fig 4d). In the hydrogen bond
acceptor interaction study red coloured disfavoured the acceptor group attached with unsaturated ring and contributing less in the biological activity while magenta colour near unsaturated cyclic ring favours
biological activity fig. 4e.
HQSAR analyses were executed by screening the 12 default series of hologram length values ranging from 53–401 bins, initially using the fragment size
default (4–7) on different distinct fragments as
A/B/C, A/B/H, A/B/Ch, A/B/DA, A/B/C/H, A/B/C/ Ch, A/B/C/DA, A/B/H/Ch, A/B/H/DA, A/B/Ch/DA, A/B/C/H/DA, A/B/C/H/DA, A/B/C/H/DA and A/C/H/ Ch/DA. The patterns of fragment count from the
training set inhibitors were related to the experimental biological activity using PLS analysis. The best statistical parameter was obtained from PLS analyses with A/B/C. The influence of fragment size is of fundamental importance in the generation of HQSAR models, as this parameter controls the minimum and maximum lengths of fragments to be encoded in the
hologram fingerprint.
The HQSAR statistical model generated using default
fragment size (4-7) with fragment distinct (A/B/C) gave a cross-validated correlation coefficient (q2) of 0.670, non-cross-validated correlation coefficient (r2) of 0.746, low standard error estimate (SEE) of 0.203
with an optimized component of 4, and Pred r2 of
0.732 was obtained (Table 4). Thus, the HQSAR
model obtained here was reliable. The predictive and residual pIC50 values of data based on the HQSAR model are listed in Table 3. The scatter plot for the actual pIC50 versus predicted pIC50 values for the
training and test sets is displayed in fig. 5.
HQSAR graphically provides information on the atomic or fragment contributions to the activities as different colours. The colours at the
green end (yellow, green-blue and green) reflect
positive contribution, colours at the red end of
the spectrum (red, red-orange and orange) reflect
negative contribution and neutral contributions are coloured in white. The most active molecular fragments of compound 25, most potent antiprostate
cancer compound of the data set are shown in fig. 6.
According to the contribution maps, the molecular fragments corresponding to the unsaturated ring are
strongly related to biological affinity at C1, C2 and C6 (coloured in green and yellow).
The regions that negatively contribute to biological activity include the methyl group attached to phenyl ring at R3, and also found that the electron-donating groups reduces activity and could be replaced by
TABLE 4: RESULTS OF HOLOGRAM QUANTITATIVE STRUCTURE ACTIVITY RELATIONSHIP ANALYSES ON THE KEY STATISTICAL PARAMETERS USING FRAGMENT-SIZE DEFAULT
Model Fragment
size Fragment distinct q
2 r2 Predicted
r2 SEE HL n 1 4–7 A/B/C 0.670 0.746 0.732 0.203 199 4
q2: Cross‑validated correlation coefficient, r2: non cross‑validated correlation
coefficient, SEE: cross‑validated standard error, HL: hologram length,
electron-withdrawing substituents with different structural and physicochemical features with the aim
to increase the affinity and potency of the compounds
studied in this work.
The predictive powers of the CoMFA and CoMSIA models were validated by the external test set of 14 compounds. The predicted pIC50 values of the test compounds are in agreement with the experimental data within an acceptable error range. The r2 pred
values were calculated to be 0.621 and 0.563 for CoMFA and CoMSIA models, respectively. A test set of 10 compounds excluded from the construction of 3D-QSAR models were used to further validate the predictive ability of the obtained models. The
correlation coefficient r2 (r2pred) of the CoMFA and
CoMSIA models were 0.621 and 0.563, respectively indicating a good predictive ability. External validation using Tropsha’s validation methods was performed to further assess the predictive ability of the CoMFA and CoMSIA models[32,33]. This validation
was performed using the 10 test set compounds not included in the development of the model.
CoMFA and CoMSIA models satisfied the following conditions (i) q2=0.53>0.50; (ii) r2=0.64>0.60 and (i) q2=0.55>0.50; (ii) r2=0.67>0.60.
The residual value obtained from observed and predicted activities of the training and test set by the
best CoMFA (SE), CoMSIA (SEHDA) and HQSAR model (A/B/C). The connected HQSAR model
showed good external predictive ability in comparison with the CoMFA model and the CoMSIA models for
the external test set. These statistical results for the
test set molecules provide powerful verification that
the CoMFA, CoMSIA and HQSAR models so derived are able to predict well the anti prostate activity of structurally varied data set. The validation results indicate that the derived 3D-QSAR models could be used to predict the inhibitory activities and to design ionone-based chalcones in LNCaP cell line as antiprostate activity.
Docking was employed to explore the binding mode between these ionone based chalcone derivatives
and the androgen receptor protein inhibitor 5-α dihydrotestosterone (protomol) site, to examine the
stability of QSAR models which were previously generated.
We selected the most potent compound 25 in the docking experiment to perform the deeper docking analysis. According to the best docking conformation of the most potent compound 25 the –CF3 at R3
established key interaction with the THR 877, fluorine
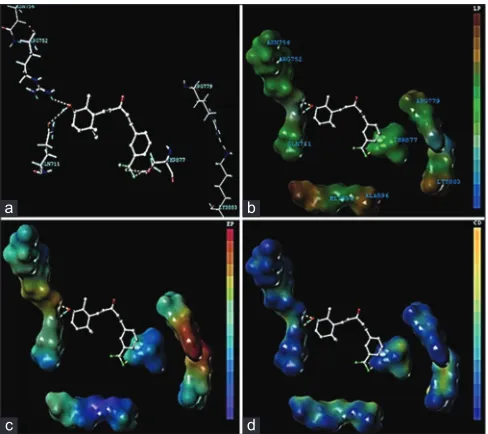
atom acted as a hydrogen bond acceptor and forming H-bonds with the –H atom of THR 877. The THR 877 amino acid was required for the growth of androgen receptor. The required THR 877 amino acid inhibition was achieved with the –NH2 functional group of the ionone based chalcones derivatives. The –OH group appeared too involved in a net of both hydrogen bond acceptor and hydrogen bond donor interaction. The oxy of -OH formed hydrogen donor interaction with NH2 of ARG 752; -OH of H atom created hydrogen bond donor interaction with oxy of GLN 711 amino acid and
dock score was found to be -3.183 kcal/mol (fig. 7a). Fig. 5: Correlation plot of HQSAR.
Correlation between the experimental and predicted activities of
HQSAR model. ♦- Training set, ■- test set.
To visualize the secondary structure element of the binding, the MOLCAD was applied with inhibitor site. In most active compound 25, aromatic ring present on the slight electrostatic potential, in highly lipophilic region and in deeper cavity. The R3 portion suspend on the slight electrostatic potential region, slight lipophilic region and upper region of cavity
depth. The MOLCAD surface of inhibitor 5-α dihydrotestosterone (DHT) binding site was created
as protomol and map displayed with electrostatic
potential (EP) to examine and validate the CoMFA
electrostatic contour map.
The MOLCAD surface of the DHT was also created and displayed with lipophilic potential
(LP) to examine the CoMSIA hydrophobic contour map (fig. 7b). The ramp for LP displays from red (lipophilic area) to blue (hydrophilic area) color
to examine CoMSIA contours map. The R3 side chain and aliphatic chain was in green and R3 aromatic phenyl ring in red area, which suggested that slight hydrophobic and more hydrophobic groups respectively would increase potency.
The EP contour map binding affinity confirmed and
validates the CoMFA model fig. 7c. The docking of compound 25 into the DHT site; the red color shows the electron-withdrawing area and purple color shows the electron-donating area. The observations
taken from fig. 7 significantly related those of the CoMFA electrostatic contour map. In detail, the R3 region were in the blue region, which suggested that an electron-withdrawing substituent would be favorable; the R4, R5 position was in a red region, which indicated that electron-donating groups may enhance potency.
The color ramp for cavity depth ranges from orange
(highest cavity depth) to blue (lowest cavity depth).
The R3 (-CF3) side chain was in the brown color,
which recommended that part in deeper cavity region groups would increase potency; the phenyl, -C=O and C1 of unsaturated ring was in a blue color which
demonstrated the region of upper cavity (fig. 7d).
The important key finding obtained from CoMFA, CoMSIA, HQSAR and docking interaction analysis promotes us to suggest some novel antiprostate cancer compounds. The molecular modelling analysis provided adequate information regarding the structural requirements for enhanced antiprostate activity. The CoMFA, CoMSIA and HQSAR contours contribution maps guide us to optimize the accessible scaffold. Furthermore docking estimated the binding affinity of the most active compound. Based on the molecular modelling recommendation in detail, less bulky, electron withdrawing, electron donating, hydrogen bond donor and acceptor groups at the R2 position enhance activity; bulky, electron-withdrawing and hydrophobic substituent are favored at R3; and minor, fewer bulky substituents at R4, R5 and R6 assistance potency through CoMFA and CoMSIA. Moreover HQSAR advise that unsaturated and linked aliphatic side chain showed positive contribution. The group -CF3, and -OH were essential for binding to
the inhibitors site cavity (protomol). The
structure-activity relationship explored by this study is presented in fig. 8. Based on this suggestion, we designed a series of novel antiprostate molecules. These designed molecules were aligned in the database by align database module, and their pIC50 values were predicted by the previously established CoMFA, CoMSIA, HQSAR models and docking scores.
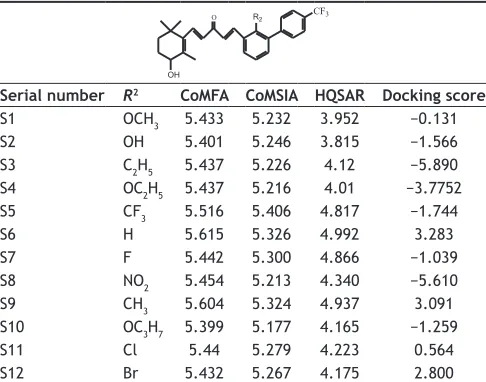
According to the predictions, twelve structures of newly designed derivatives, predicted pIC50 values their and dock score are shown in Table 5, most of the designed derivatives showed better potencies but Fig. 7: Binding conformations of the compound 25 with receptor.
Binding conformations of the compound 25 (a) at the inhibitor binding site of androgen receptor (PDB code 1T65), (b) more insight of docking analysis by a MOLCAD lipophilic potential binding, (c) electrostatic potential and (d) cavity depth.
b
d c
compounds S6 and S9, which were the most active
derivatives in the database and verified in comparison to compound 25. These results confirm the
structure-activity relationship obtained from QSAR and docking studies, we thought that the designed molecules
testified by us impart antiprostate cancer and remains
leads for forthcoming research.
In the present study, QSAR analysis and docking have been applied to a set of ionone based chalcones derivatives. The models generated have confirmed to be statistically precise with higher q2 and r2.
Molecular modeling methods were performed to understand the structural features responsible for the
affinity of the ligands for AR. The bulky, negatively
charged substituents and H-bond acceptors at R2, R3, R4, R5 and R6 position would increase the activity; the substitution at the phenyl position is very important
for improved activity. The hydrophobic substituent at the position of the linker would increase the activity. Cylic rings at the both sides of ionone based chalcones derivatives are required for the cytotoxic of AR antagonist. Here, the hydrophobic property of phenyl ring plays a key role in the anti-prostate cancer activities. These results provided important clues that were used to design twelve novels anti-prostate cancer compounds with high predicted activity.
Acknowledgements:
The authors are thankful to the Head, School of Pharmacy for providing facilities.
Financial support and sponsorship:
Naveen Dhingra is thankful for providing INSPIRE
Fellowship, DST, New Delhi (Ref No. IF110047) and
Swaraj Patil for UGC fellowship.
Conflicts of interest:
There are no conflicts of interest.
REFERENCES
1. Siegel R, Ward E, Brawley O, Jemal A. Cancer statistics, 2011: The impact of eliminating socioeconomic and racial disparities on premature cancer deaths. CA Cancer J Clin 2011;61:212-36.
2. Lin L, Shi Q, Nyarko AK, Bastow KF, Wu CC, Su CY, et al.
Antitumor agents 250. Design and synthesis of new curcumin analogues as potential anti-prostate cancer agents. J Med Chem 2006;49:3963-72. 3. Henderson LC, Altimari JM, Dyson G, Servinis L, Niranjan B,
Risbridger GP. A comparative assessment of a-lipoic acid N-phenylamides as non-steroidal androgen receptor antagonists both on and off gold nanoparticles. Bioorg Chem 2012;40:1-5.
4. Roy AK, Lavrovsky Y, Song CS, Chen S, Jung MH, Velu NK, et al.
Regulation of androgen action. Vitam Horm 1999;55:309-52.
5. Sadi MV, Walsh PC, Barrack ER. Immunohistochemical study of androgen receptors in metastatic prostate cancer. Comparison of receptor content and response to hormonal therapy. Cancer 1991;67:3057-64.
6. Culig Z, Hobisch A, Hittmair A, Cronauer MV, Radmayr C, Zhang J,
et al. Synergistic activation of androgen receptor by androgen and luteinizing hormone-releasing hormone in prostatic carcinoma cells. Prostate 1997;32:106-14.
7. Balk SP. Androgen receptor as a target in androgen-independent prostate cancer. Urology 2002;60 3 Suppl 1:132-8.
8. Culig Z, Klocker H, Bartsch G, Hobisch A. Androgen receptors in
prostate cancer. Endocr Relat Cancer 2002;9:155-70.
9. Supriya S, Anil S. 2D-QSAR of purine-scaffold novel class of Hsp90 binders that inhibit the proliferation of cancer cells. Med Chem Res 2008;17:290-6.
10. Zhou J, Geng G, Shi Q, Sauriol F, Wu JH. Design and synthesis of
androgen receptor antagonists with bulky side chains for overcoming antiandrogen resistance. J Med Chem 2009;52:5546-50.
11. Kirby M, Hirst C, Crawford ED. Characterising the castration-resistant prostate cancer population: A systematic review. Int J Clin Pract 2011;65:1180-92.
12. Chen N, Liu CK, Zhao Z, Zhang B. 3D-QSAR study of
multi-target-Fig. 8: Structure-activity relationship revealed by QSAR and docking.
EW: Electron withdrawing; ED: Electron donating.
TABLE 5: PREDICTED PIC50 VALUES AND DOCKING
SCORES OF NEWLY DESIGNED ANTIPROSTATE
DERIVATIVES
Serial number R2 CoMFA CoMSIA HQSAR Docking score
S1 OCH3 5.433 5.232 3.952 −0.131
S2 OH 5.401 5.246 3.815 −1.566
S3 C2H5 5.437 5.226 4.12 −5.890
S4 OC2H5 5.437 5.216 4.01 −3.7752
S5 CF3 5.516 5.406 4.817 −1.744
S6 H 5.615 5.326 4.992 3.283
S7 F 5.442 5.300 4.866 −1.039
S8 NO2 5.454 5.213 4.340 −5.610
S9 CH3 5.604 5.324 4.937 3.091
S10 OC3H7 5.399 5.177 4.165 −1.259
S11 Cl 5.44 5.279 4.223 0.564
S12 Br 5.432 5.267 4.175 2.800
HQSAR: Hologram quantitative structure activity relationship, CoMFA: comparative molecular field analysis, CoMSIA: comparative similarity indices analysis,
directed AchE inhibitors based on autodocking. Med Chem Res 2012;21:245-56.
13. Modi R, Shah J, Patel J, Suthar M, Chauhan F, Patel J. Design, synthesis, and QSAR study of novel
2-(2,3-dioxo-2,3-dihydro-1H-indol-1-yl)-N-phenylacetamide derivatives as cytotoxic agents. Med Chem
Res 2011;20:615-25.
14. Zhou J, Geng G, Batist G, Wu JH. Syntheses and potential anti-prostate
cancer activities of ionone-based chalcones. Bioorg Med Chem Lett 2009;19:1183-6.
15. Estébanez-Perpiñá E, Moore JM, Mar E, Delgado-Rodrigues E, Nguyen P, Baxter JD, et al. The molecular mechanisms of coactivator utilization in ligand-dependent transactivation by the androgen receptor. J Biol Chem 2005;280:8060-8.
16. Cramer RD, Patterson DE, Bunce JD. Comparative molecular field
analysis (CoMFA). 1. Effect of shape on binding of steroids to carrier
proteins. J Am Chem Soc 1988;110:5959-67.
17. Klebe G, Abraham U, Mietzner T. Molecular similarity indices in a
comparative analysis (CoMSIA) of drug molecules to correlate and
predict their biological activity. J Med Chem 1994;37:4130-46. 18. Turner B, Tyrrell M, Willett P. Rapid qualification of molecular
diversity for selective database acquisition. J Chem Inf Comput Sci 1997;37:18-22.
19. Liao SY, Qian L, Miao TF, Lu HL, Zheng KC. CoMFA and docking
studies of 2-phenylindole derivatives with anticancer activity. Eur J Med Chem 2009;44:2822-7.
20. Desai C, Chhabaria T, Amit D, Ajit B, Baldaniya B. Synthesis, characterization, anticancer activity, and QSAR-studies of some new tetrahydropyrimidines. Med Chem Res 2011;20:1331-9.
21. Yi P, Qiu M. 3D-QSAR and docking studies of aminopyridine carboxamide inhibitors of c-Jun N-terminal kinase-1. Eur J Med Chem 2008;43:604-13.
22. Sharma S, Sahu K, Jain P, Mourya K, Agrawal K. QSAR study of 1,3-dioxo-4-methyl-2,3-dihydro-1h-pyrrolo [3,4-c] quinolines as caspase-3 inhibitors. Med Chem Res 2008;17:399-411.
23. Cho SJ, Tropsha A. Cross-validated R2-guided region selection for comparative molecular field analysis: A simple method to achieve consistent results. J Med Chem 1995;38:1060-6.
24. Srivastava V, Gupta SP, Siddiqi MI, Mishra BN. 3D-QSAR studies on quinazoline antifolate thymidylate synthase inhibitors by CoMFA and CoMSIA models. Eur J Med Chem 2010;45:1560-71.
25. Pirhadi S, Ghasemi JB. 3D-QSAR analysis of human immunodeficiency
virus entry-1 inhibitors by CoMFA and CoMSIA. Eur J Med Chem 2010;45:4897-903.
26. Zhao X, Chen M, Huang B, Ji H, Yuan M. Comparative molecular field analysis (CoMFA) and comparative molecular similarity indices analysis (CoMSIA) studies on a(1A)-adrenergic receptor antagonists based on
pharmacophore molecular alignment. Int J Mol Sci 2011;12:7022-37. 27. Telvekar N, Chaudhari K. 3D-QSAR and docking-based combined
In silico study on C-5 methyl substituted 4-arylthio and
4-aryloxy-3-iodopyridin-2-(1H)-one as HIV-1 RT inhibitors. Med Chem Res
2012;21:2032-43.
28. Madhavan T, Kothandan G, Gadhe G, Cho S. QSAR analysis on PfPK7 inhibitors using HQSAR, CoMFA, and CoMSIA. Med Chem Res 2012;21:681-93.
29. Reihaneh S, Jahan B, Ghasemi Q. 4D-QSAR and 3D-QSAR study of
the pan class I phosphoinositide-3-kinase (PI3K) inhibitors. Med Chem
Res 2013;22:1587-97.
30. Vong R, Geladi P, Wold S, Esbensen K. Source contributions to ambient aerosol calculated by discriminat partial least squares
regression (PLS). J Chemom 1988;2:281-96.
31. Gao J, Cheng H, Cui W, Chen Q, Zhang S, Du G. 3D-QSAR and
molecular docking studies of hydroxamic acids as peptide deformylase inhibitors. Med Chem Res 2012;21:1597-610.
32. Golbraikh A, Tropsha A. Beware of q2! J Mol Graph Model 2002;20:269-76.
33. Tropsha A, Gramatica P, Gombar K. The importance of being earnest: Validation is the absolute essential for successful application and interpretation of QSPR models. QSAR Comb Sci 2003;22:69-77. 34. Ai Y, Wang T, Sun H, Song J. Combined 3D-QSAR modeling and
molecular docking studies on pyrrole-indolin-2-ones as aurora a kinase inhibitor. Int J Mol Sci 2011;12:1605-24.