1
Analysis of the daylight performance of a glazing system
1with Parallel Slat Transparent Insulation Material
2(PS-TIM)
34
Yanyi Sun, Yupeng Wu* and Robin Wilson
5 6
Department of Architecture and Built Environment, Faculty of Engineering, The University of
7
Nottingham, University Park, Nottingham, NG7 2RD, UK
8
*Corresponding author: Tel: +44 (0) 115 74 84011; emails: [email protected],
9
10
Abstract:
11
Daylight plays an important role in the energy efficiency and indoor environmental 12
quality of an office building. An innovative façade system where parallel 13
transparent/translucent plastic slats are sandwiched between glass panes to form a Parallel 14
Slat Transparent Insulation Material (PS-TIM) is proposed as a strategy to effectively 15
increase the thermal resistance of window systems, while providing better daylight 16
performance. In this paper, the optical performance (as defined by Bidirectional Scattering 17
Distribution Function) of a double glazed window containing PS-TIM systems with 18
different slat pitches (the distance between neighbouring slats), slat tilt angles, as well as 19
the slat materials (transparent and translucent) was obtained using a ray-tracing technique. 20
Then, the annual daylight performance of a typical office building with various PS-TIM 21
applied under different climatic conditions and at different orientations was investigated 22
using RADIANCE. The simulation results show that PS-TIMs with translucent slats offer 23
better daylight performance than conventional double glazing: it can increase the 24
percentage of annual working hours under daylight, where the illuminance lies in the useful 25
range of up to 79%. It also achieves a homogenous distribution of daylight within the 26
internal working space and effectively reduces the possibility of glare. When applying PS-27
TIM at higher site latitude, smaller slat pitches are required to maximise useful daylight. 28
Optimised PS-TIM geometry is also affected by local prevailing sky conditions. 29
Keywords: Parallel Slat Transparent Insulation Material (PS-TIM); RADIANCE; daylight 30
2
1.
Introduction
1
The quantity, quality and distribution of daylight that passes through a window 2
system and illuminates a space, plays an important role in energy efficiency and achieving a 3
comfortable indoor environment. It influences lighting, heating and cooling energy 4
consumption, as well as the thermal and visual comfort perceived by a building’s occupants 5
[1]. Additionally, the comfort level provided by daylighting has also been proven to affect 6
human health, mood, activity and work efficiency [2]. Thus, a good design of window 7
system becomes increasingly important. This requires that significant attention is given to 8
designing an effective system that offers a balanced strategy incorporating advances in both 9
thermal and optical thinking, as well as effective use of building prediction methods to 10
quantify performance when applying these novel systems to buildings. 11
The use of Transparent Insulation Materials (TIM) sandwiched between the panes 12
of a double-glazed window unit is proposed as a strategy for, offering the potential to 13
increase the thermal resistance of a double glazed window, to maintain access to solar light 14
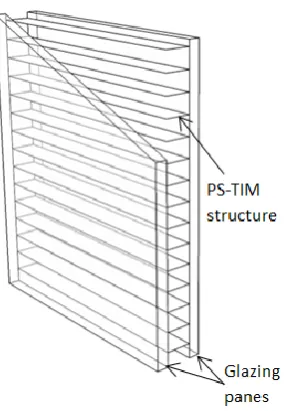
and heat, and to provide a comfortable pattern of daylight distribution. Parallel slat TIM 15
(PS-TIM), as illustrated in Figure 1, divides the air cavity between two glazing panes into 16
small horizontal, linear cells. The slats themselves provide additional viscous resistance to 17
the onset of free convection and in addition interfere with the thermal radiation transferred 18
from one pane of the double glazed unit to the other. As demonstrated by Sun et al. [3], the 19
employment of PS-TIM can reduce the heat transfer coefficient of a double-glazed unit, and 20
in so doing, improve the thermal behaviour of buildings they are employed in. The 21
employment of PS-TIM does, however, reduce the amount of daylight transmitted through 22
the window system as well as modify the daylight distribution within the space it serves. 23
3
on indoor illuminance level can ultimately affect the overall energy efficiency of the 1
building. The daylight aspect of PS-TIM behaviour serves as the focus of this paper. 2
[image:3.595.245.388.126.332.2]3
Figure 1: PS-TIM in a double glazed unit
4
In seeking to evaluate the quantity, quality and distribution of daylight accurately, 5
traditional approaches, which are mainly based on the use of rule of thumb or simplified 6
calculation methods (e.g. daylight factor (DF)) are increasingly deemed inadequate [2]. In a 7
move to improve the objectivity and accuracy when evaluating daylight strategies, a 8
number of new and refined metrics, such as useful daylight illuminance (UDI), daylight 9
glare probability (DGP) etc., have been proposed [4-6] and are becoming increasingly 10
common in the literature [7-11]. These sophisticated metrics are evaluated using dynamic 11
simulation tools (e.g. RADIANCE [12-15]) in conjunction with a Bidirectional Scattering 12
Distribution Function (BSDF) to represent the optical performance of complex window 13
systems [12, 16-18]. 14
This paper provides a comprehensive picture of daylight performance when 15
applying PS-TIMs to window system through the use of dynamic metrics. RADIANCE has 16
been used to determine the dynamic daylighting performance of a notional double glazed 17
window system with and without PS-TIM installed in a typical office, using a “Three-phase 18
4
In the simulation, a cellular office room with various window systems is modelled, and the 1
illuminance distribution calculated for 1 hour time-step over the course of a year. The 2
predicted illuminances during working hours were analysed using advanced metrics (e.g. 3
UDI, DGP and UR). The influence of slat pitch (the distance between neighbouring slats), 4
slat tilt angle, as well as the optical performance of the slat material itself for the PS-TIMs 5
are also investigated to understand their effects on the overall daylight performance. The 6
chosen PS-TIMs have also been investigated under different climate conditions and 7
different building orientations to provide an indication of how site-specific variables 8
influence performance. 9
It is worth noting that although PS-TIM has the potential to offer improved 10
performance of daylight distribution, the designer would have to consider the extent to 11
which they interrupt view out of and in to building. This study looks only at daylight 12
behaviour and does not consider the effect that PS-TIM has on view. 13
14
5
2.
Daylight performance assessment metrics
1
The use of “rule of thumb” methods [19], such as window area to floor area ratios 2
to verify the daylighting sufficiency, or calculation of daylight factor (DF), which is 3
defined as the ratio between indoor to outdoor illuminance and can be used to estimate the 4
adequacy of daylight provision, are wide spread throughout many countries. Although, 5
these methods are frequently formalised within national standards and form part of the 6
standard set of tools used by designers [2], their accuracy can be limited as they frequently 7
fail to take into account the specificity of building site (e.g. orientation, surrounding 8
conditions etc.), local climate and, related to this, the effect of direct sunlight [20]. When 9
working with complex fenestration systems, which cause redirection and scattering of 10
daylight, availability of more accurate methods and more advanced metrics becomes even 11
more pressing. Key static metrics as well as dynamic metrics that are based on annual 12
climate data, encompassing both daylight availability and user comfort levels in a room, are 13
6
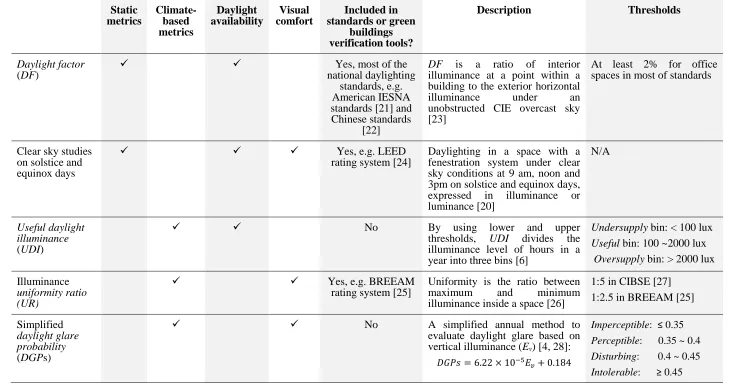
Table 1 Comparison of daylight metrics used in this paper
1 Static metrics Climate-based metrics Daylight availability Visual comfort Included in standards or green
buildings verification tools?
Description Thresholds
Daylight factor
(DF)
Yes, most of the
national daylighting standards, e.g. American IESNA standards [21] and Chinese standards
[22]
DF is a ratio of interior illuminance at a point within a building to the exterior horizontal
illuminance under an
unobstructed CIE overcast sky [23]
At least 2% for office spaces in most of standards
Clear sky studies on solstice and equinox days
Yes, e.g. LEED
rating system [24]
Daylighting in a space with a fenestration system under clear sky conditions at 9 am, noon and 3pm on solstice and equinox days, expressed in illuminance or luminance [20]
N/A
Useful daylight illuminance
(UDI)
No By using lower and upper
thresholds, UDI divides the illuminance level of hours in a year into three bins [6]
Undersupply bin: < 100 lux
Useful bin: 100 ~2000 lux
Oversupply bin: > 2000 lux
Illuminance
uniformity ratio (UR)
Yes, e.g. BREEAM
rating system [25]
Uniformity is the ratio between
maximum and minimum
illuminance inside a space [26]
1:5 in CIBSE [27] 1:2.5 in BREEAM [25]
Simplified
daylight glare probability
(DGPs)
No A simplified annual method to
evaluate daylight glare based on vertical illuminance (Ev) [4, 28]:
𝐷𝐺𝑃𝑠 = 6.22 × 10⁻⁵𝐸
𝑣+ 0.184
Imperceptible: ≤ 0.35
Perceptible: 0.35 ~ 0.4
Disturbing: 0.4 ~ 0.45
Intolerable: ≥ 0.45
7
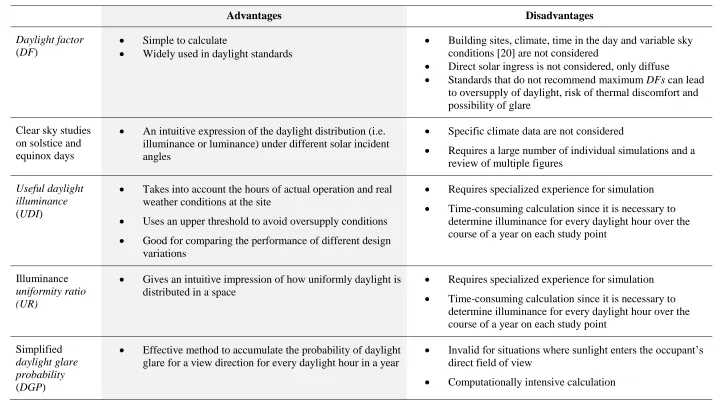
Table 2: Comparison of daylight metrics used in this paper (continued)
1
Advantages Disadvantages
Daylight factor
(DF)
Simple to calculate
Widely used in daylight standards
Building sites, climate, time in the day and variable sky conditions [20] are not considered
Direct solar ingress is not considered, only diffuse
Standards that do not recommend maximum DFs can lead to oversupply of daylight, risk of thermal discomfort and possibility of glare
Clear sky studies on solstice and equinox days
An intuitive expression of the daylight distribution (i.e. illuminance or luminance) under different solar incident angles
Specific climate data are not considered
Requires a large number of individual simulations and a review of multiple figures
Useful daylight illuminance
(UDI)
Takes into account the hours of actual operation and real weather conditions at the site
Uses an upper threshold to avoid oversupply conditions Good for comparing the performance of different design
variations
Requires specialized experience for simulation Time-consuming calculation since it is necessary to
determine illuminance for every daylight hour over the course of a year on each study point
Illuminance
uniformity ratio (UR)
Gives an intuitive impression of how uniformly daylight is distributed in a space
Requires specialized experience for simulation Time-consuming calculation since it is necessary to
determine illuminance for every daylight hour over the course of a year on each study point
Simplified
daylight glare probability
(DGP)
Effective method to accumulate the probability of daylight glare for a view direction for every daylight hour in a year
Invalid for situations where sunlight enters the occupant’s direct field of view
8
3.
Simulation method
1
The generation of daylight performance metrics can be performed using annual 2
hourly simulation results obtained from RADIANCE [29]. RAIDANCE is a software tool 3
based on a backward ray-tracing algorithm, which means that the rays are emitted from the 4
point of interest and traced backwards until they either hit a light source or another object [30]. 5
The accuracy of this research-grade simulation tool has been validated by several studies [12-6
15]. 7
For a dynamic daylight simulation of a space, hourly based annual climate data, which 8
includes direct sunlight and diffuse skylight, are required for the daylight performance 9
prediction. For a space illuminated via a complex fenestration system, such as PS-TIM, the 10
multiple inter-reflections that occur within the system become a further challenge for dynamic 11
annual simulation. Swapping these complex interactions with a pre-calculated transmission 12
matrix, (T), which characterizes flux output as a function of input for a particular 13
configuration of light source and receiver, provides a simple but effective description of 14
complex fenestration system in RADIANCE [12]. In addition, a daylight matrix, (D), and a 15
view matrix, (V), that describe the external and internal conditions respectively, may also be 16
calculated using a modified daylight coefficient method in advance of annual simulation [16]. 17
Flux transfer represented by these three matrices forms a “Three-phase method”, where the 18
matrices are used in a multiple inner time-step loop with an assigned value for the sky 19
condition (sky vector (s) or sky matrix (S)). This is proposed as a means of effectively and 20
accurately performing annual daylight simulations of systems where complex fenestration 21
systems are applied [12, 16, 31]. The results, which can be illuminance or luminance at any 22
point of interest for a single time step (i) or for a time series (I), are computed using the 23
following equations: 24
9
I=VTDS (6-2) 1
where the sky vector (s) is generated by dividing the whole sky into discrete patches, with 2
each patch being assigned an average radiance value for a given time and sky condition, while 3
the sky matrix (S) is a time series of sky vectors. An annual sky matrix is generated from 4
hourly input weather data for the 8760 hours in a year. 5
In this research, the ‘Three-phase method’ was used to conduct the dynamic annual 6
daylight simulation of PS-TIM window systems in an office. The daylight matrix and view 7
matrix were obtained based on the model’s orientation, surrounding environment, geometry 8
and surface properties of the indoor space (details can be found in section 3.3) using an 9
embedded command in RADIANCE. Sky matrices were obtained from IWEC (International 10
Weather for Energy Calculation) weather data for five cities with different latitudes and 11
climates (details can be found in section 3.2). The transmission matrix for the window 12
systems with PS-TIM was expressed using Bidirectional Scattering Distribution Functions 13
(BSDFs) (details can be found in section 3.1). 14
3.1
BSDF for a window system with PS-TIM
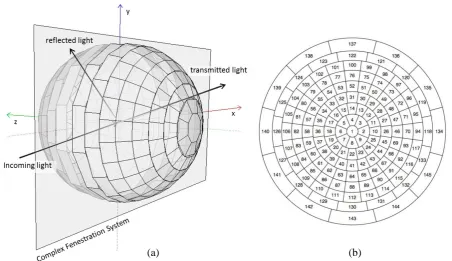
15A BSDF file defines coefficients to allocate light from each exterior direction to each 16
interior direction. In so doing, the angularly resolved transmissions and reflections for a 17
complex window system are included in the annual calculation process. The BSDF based on 18
Klems angle basis is a primary format for RADIANCE. As shown in Figure 2, it comprises 19
145 × 145 matrices for fenestration systems, which can account for the transformations that 20
occur to both solar and optical spectra. Each matrix describes reflectance or transmittance 21
10 1
Figure 2: (a) schematic diagram of BSDF and (b) Klems 145-patch hemispherical basis with numbered subdivisions
2
The BSDF can be obtained by two methods: measurement using goniophotometric 3
equipment [32-34] or calculation using validated ray-tracing methods [33-35]. A ray-tracing 4
program genBSDF in RADIANCE [29], which has been validated by McNeil et al. [35], was 5
used in this research to calculate BSDF of different interstitial PS-TIM structures based on 6
their geometry and material properties. 7
The BSDF data was calculated by RADIANCE for PS-TIM systems with 4 slat 8
pitches (15mm 10mm 7.5mm and 5mm), at 7 different slat orientation angles (0°, 30°, 45°, 9
60°, -30°, -45° and -60°) and 2 different slat materials (transparent and Lambertian diffuse 10
translucent with 50% transmission). Examples of the investigated PS-TIM with different slat 11
pitches are shown in Figure 3 (a), PS-TIM with different tilt angles are shown in Figure 3 (b) 12
and PS-TIM with different slat materials are shown in Figure 3 (c). 13
14
[image:10.595.73.526.73.334.2]11
Transparent
Lambertian translucent 10 mm_0° 5 mm_0° 15 mm_30° 7.5 mm_-30°
[image:11.595.79.512.72.280.2](a) (b) (c)
Figure 3: Schematic diagram of variables: (a) slat pitch (d mm); (b) tilt angle (Φ °) and (c) slat material
1
3.2
Weather data
2To investigate the performance of the proposed PS-TIMs under different geographical 3
and weather conditions, five cities: Stockholm; London; Beijing; Hong Kong and Singapore 4
were selected. The latitude, longitude and solar radiation conditions for these cities are shown 5
in Table 3. The simulations were run at 1-hour time-steps for an entire year using IWEC 6
weather file for the site. The diurnal direct and diffuse solar radiation of these five cities can 7
be found in Appendix A. 8
Table 3: Latitude, longitude and annual average solar irradiance for five case study cities
9
Latitude Longitude
Noon solar altitude
summer solstice equinox winter solstice
Stockholm 59.3° N 18° E 53.1° 28.7° 6.7°
London 51.5° N 0° W 62.1° 37.6° 15.2°
Beijing 39.9° N 116° E 70.7° 48.6° 25.7°
Hong Kong 22.3° N 114.2° E 77.2° 62.2° 42.5°
Singapore 1.3° N 103.8° E 67.8° 88.6° 65.2°
3.3
Model geometry and material properties
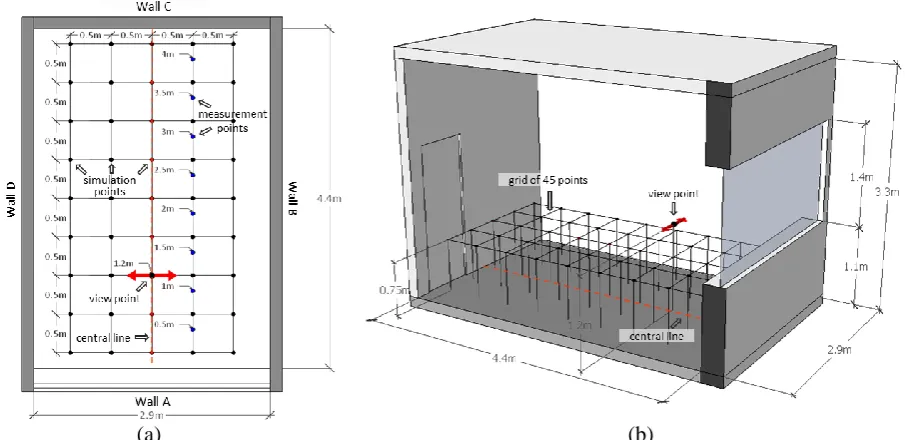
10A side lit cellular office with dimensions 2.9 m (width) × 4.4 m (depth) × 3.3 m 11
(height), which is based on a real room in the Energy Technologies Building in the University 12
[image:11.595.67.523.522.642.2]12
perfectly diffuse with typical visible reflectances of 30% (floor), 80% (walls) and 80% 1
(ceiling). In order to clearly describe the geometry of the room, the four walls are represented 2
by A, B, C and D as illustrated in Figure 4. A window with dimensions 1.4 m (height) × 2.9 3
m (width) is located in wall A with a sill height of 1.1 m above the floor. Four window 4
orientations: South, East, West and North are considered in the studies. The original double 5
glazed window has a visible light transmission of 78%. The furniture inside the room was 6
modelled according to the layout of the prototype office. It was assumed there were no 7
surrounding buildings, vegetation or other obstructions outside the office. An exterior ground 8
with RGB reflectance of (0.4, 0.4 and 0.1) [29] was used to represent a grass green colour in 9
the external environment. The enclosing surfaces of the room, all the furniture and exterior 10
ground were built up directly in RADIANCE. 11
A 9 × 5 grid comprising 45 points at 0.5 m centres was used to estimate the 12
illuminance distribution on a working plane positioned at a height of 0.75 m above floor level 13
as illustrated in Figure 4. The grid was located centrally on plan, 0.2m away from wall A and 14
C and 0.45 m away from wall B and D. The room was assumed to be used as a private office 15
for two people, with one positioned near the window and the second at the back of the room. 16
As glare caused by daylight is less likely to be an issue at the back of the room, the glare 17
evaluation was based on a view point representing the occupant near the window. This was 18
located at a distance of 1.2 m from the window and at a height of 1.2 m above the floor on the 19
13 1
Figure 4: Selected points for evaluating illuminance distribution in the office space (a) Plan view and (b) sectional
2
view
3
3.4
Simulation conditions and rendering parameters
4The room is schedule assumed occupancy schedule between 8:00 and 17:00. Within 5
[image:13.595.40.534.56.798.2]this study, the following rendering parameters for RADIANCE were used: 6
Table 4: RADIANCE simulation parameters
7
Ambient bounces
(-ab)
Ambient divisions
(-ad)
Ambient supersamples
(-as)
Ambient resolution
(-ar)
Ambient accuracy
(-aa)
Direct sampling
(-ds)
12 50000 512 256 0.13 0.2
According to investigations undertaken by Wienold and McNeil [4, 31], these settings 8
seem to deliver reliable values for the given scenes. 9
3.5
Model validation
10The accuracy of the RADIANCE algorithm, daylight coefficient method and Perez 11
sky model have been discreetly validated under over 10,000 sky conditions including overcast 12
skies, clear skies and partly cloudy skies by Reinhart [14, 36] and Mardaljevic [37, 38]. They 13
used the data from a sky scanner to describe the luminance distribution of the celestial 14
hemisphere including the sun in their simulation model, and then compared the simulated 15
[image:13.595.72.525.78.298.2]14
results of indoor illuminance level under each sky condition with the measured results under 1
the same condition. The results indicated a high level of reliability in the use of RADIANCE 2
to predict the annual indoor illuminance distribution in a space based on the building 3
geometry, optical properties of the material surfaces and direct and diffuse irradiances. In this 4
research, to provide confidence of accurately using RADIANCE for PS-TIM prediction, the 5
illuminances for the prototype room were measured and compared with illuminances from 6
simulation under the same conditions. The illuminance measurement method was a simplified 7
version of the validated method for illuminance measurement developed by Reinhart [14, 36] 8
and Mardaljevic [37, 38]. The measurements were conducted on two overcast days in October 9
2015. As the sky conditions were totally overcast and there was no direct irradiance, the 10
luminance distribution of the celestial hemisphere was assumed to be uniform in the 11
simulation. The external non-obscured horizontal illuminance and indoor illuminances at the 12
selected 8 measurement points (along the centre line of the room between the window and the 13
end wall) were measured using calibrated chromameters, CL-200A (with an accuracy of ± 2% 14
or ±1 the smallest digit of the displayed value). Comparison was made between the simulated 15
indoor illuminance and the measured illuminance on the working plane (shown in Figure 4). 16
The simulation assumed a typical double glazing (window without TIM) under two external 17
illuminance levels: one with 10,000 lux and the other with 2,500 lux. In order to avoid the 18
influence of a neighbouring building and vegetation on the measured illuminance, the study 19
was based on an office on the top floor of the building. 20
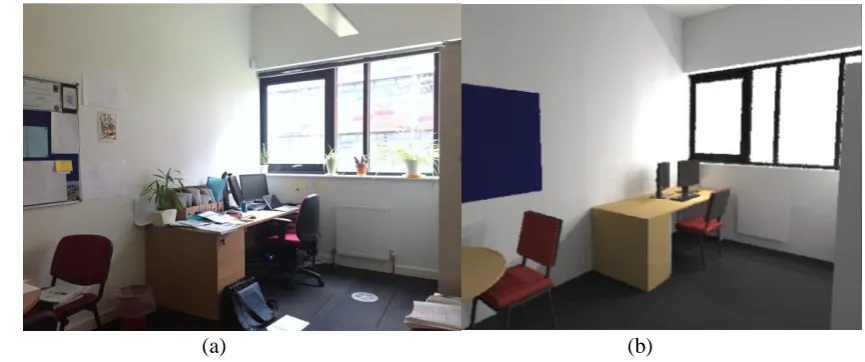
Figure 5 shows a comparison between measured and simulated values. The results 21
agree reasonably well with the greatest deviation (13.5%) occurring 0.5m away from the 22
window when the external horizontal illuminance was 10000 lux. This is due to the presence 23
of a small window sill and an incompletely rolled up blind near top of the window (see Figure 24
15
in the simulation. A photo of the prototype office room, which is taken during an overcast day, 1
and a simulated render of the model are shown in Figure 6. 2
[image:15.595.76.509.456.637.2]3
Figure 5: Comparison between measured illuminance and illuminance calculated using Radiance
4
at the selected 8 points in the room
5
6
Figure 1: (a) Photo of test room and (b) rendered image
7
0 200 400 600 800 1000 1200 1400
0.5 1 1.5 2 2.5 3 3.5 4
Il
lum
inanc
e (
lux)
Distancefrom window (m)
Test 1: outdoor illumiance ≈10000 lux Test 2: outdoor illumiance ≈2500 lux
RADIANCE simulation: outdoor illuminance =10000 lux
RADIANCE simulation: outdoor illuminance =2500 lux
16
4.
Results and discussion of the effect of different PS-TIM on
1
indoor daylight performance
2
The criterion for identifying the optimised PS-TIM configuration was based on 3
attaining a balance between the daylight availability and daylight comfort level. 4
4.1
The effects of slat pitch on daylight performance
5Simulations were undertaken for the PS-TIM with Lambertian diffuse translucent slats 6
placed horizontally between two glazing panes, at various slat pitch of 15 mm, 10 mm, 7.5 7
mm and 5 mm, (labelled as ‘15 mm PS-TIM’, ‘10 mm PS-TIM’, ‘7.5 mm PS-TIM’ and ‘5 8
mm PS-TIM’ respectively in preceding discussions). For the results presented in this section, 9
the office is assumed to be located in London with the window facing south. 10
The useful daylight illuminance (UDI) (see Table 1 and 2 for more information) was 11
determined by sorting the simulated hourly illuminance at the points of interest into 3 bins: 12
1) an undersupplied bin (illuminance value < 100 lux); 13
2) a useful bin (100 lux < illuminance value < 2000 lux); 14
3) an oversupplied bin (illuminance value > 2000 lux). 15
In this study, a more detailed picture of the middle 100 ~ 2000 lux bin is generated by 16
splitting it into two ranges: 17
1) A desired range (500 ~ 2000 lux), where a typical office design illuminance is met and is 18
not exceeded to the point where glare is highly likely [20]; 19
2) A sub-desired range (100 ~ 500 lux) where there is an increasing likelihood that 20
occupants will resort to supplementary lighting to meet their illumination needs. 21
17
1) illuminance in the range of 2000 ~ 3000 lux, in which range occupants may tolerate the 1
strong daylight; 2
2) illuminance greater than 3000 lux, in which blinds or shades might be lowered [39]. 3
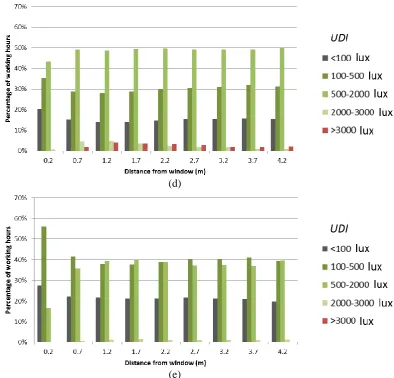
Predictions were made for the window without PS-TIM and with translucent PS-TIM 4
at 4 different slat pitches. Figure 7 shows the UDI predicted at points along the centre line of 5
the room between the window and the end wall. As illustrated in Figure 7 (a), for the double 6
glazing system, the period when there is an oversupply of daylight (UDI>3000 lux) accounts for 7
a high proportion (i.e approximately 45% of working hours) at locations within 2.2 m of the 8
window and it gradually reduces to less than 10%, for points further than 3.2 m from the 9
window. This oversupply of daylight can be reduced to less than 20%, 10% 5% and 0% of 10
working hours by integrating PS-TIM structure with slat pitches of 15 mm, 10 mm. 7.5 mm 11
and 5 mm, respectively, as shown in Figure 7 (b), (c), (d) and (e). While the 5 mm PS-TIM 12
can completely eliminate oversupply of daylight, the percentage of undersupplied daylight 13
hours (UDI< 100 lux) increases from less than 10% for conventional double glazing to more than 14
20%. The remaining 3 configurations of PS-TIM give rise to undersupplied daylight hours in 15
the range of 10% to 20% of working hours. 16
The average percentage of hours where the UDI is in the most desired range ( UDI500-17
2000 lux) increase from 36% for conventional double glazing to 46 % and 50 % when applying 18
PS-TIM with 15 mm slat pitch and 10 mm slat pitch respectively. The integration of PS-TIM 19
improves the daylighting quality of the room, especially within the region that is close to the 20
window where over illumination is frequently a problem with conventional glazing. Instead, 21
more hours are predicted within the most desired range of UDI (UDI 500-2000 lux), these being 22
relatively evenly distributed throughout the room depth for PS-TIM with slat pitches of 10mm 23
18
Significant improvement over conventional double glazing is achieved by applying 1
PS-TIM with 10 mm slat pitch and 7.5 mm slat pitch, which raises the average percentage of 2
useful UDI (UDI100-500 lux and UDI500-2000 lux) from 47% to approximately 76% and 79%, 3
respectively. 4
(a)
(b)
19
Figure 7: UDI bins for points located along the central line of an office from window to the end wall for the window
1
system with and without PS-TIM: (a) DG; (b) 15 mm PS-TIM; (c) 10 mm PS-TIM; (d) 7.5 mm PS-TIM and (e) 5mm
2
PS-TIM. Simulations are based on a London IWEC weather file.
3
(d)
20
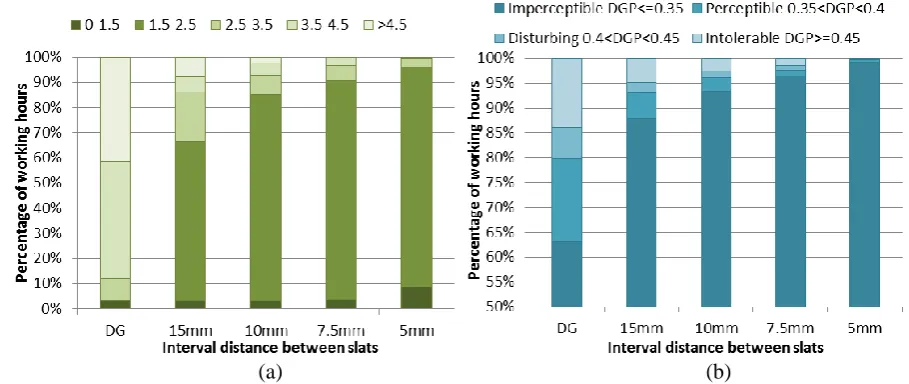
The results for additional two metrics, uniformity ratio (UR) (see Table 1 and 2 for 1
more information) and daylight glare probability (DGP) (see Table 1 and 2 for more 2
information), which were used to assess the daylight comfort level are presented in Figure 8. 3
As with the previous analysis, the data are derived from the London climate data file. 4
At this latitude, 3% of the working hours occur before sunrise or after sunset and so have no 5
daylight at all: for 3% of the time therefore, the UR equals 0. For conventional double glazing, 6
the daylight transmitted into the room produces extreme contrasts of illumination on the 7
working plane: 42% of the annual working hours have a UR larger than 1:4.5 (labelled as > 8
4.5 in Figure 8 (a)) and of working hours 47% fall into the range between 1:3.5 and 1:4.5 9
(labelled as 3.5 - 4.5). The application of PS-TIM integrated double glazing improves the 10
predicted illuminance uniformity. UR over 1:2.5 (the sum of the data labelled as 2.5-3.5, 3.5-11
4.5 and > 4.5), reduces to 34%, 15%, 10% and 4% of annual working hours for PS-TIM with 12
slat pitches of 15mm, 10mm, 7.5mm and 5mm, respectively. 13
The daylight glare probability (DGP) is calculated based on a simplified annual 14
simulation method for the assumed occupant position near the window (1.2 m away from 15
window at 1.2 m height) [4, 5]. As shown in Figure 8 (b), for the normal double glazed 16
window, the intolerable glare (DGP ≥ 0.45), disturbing glare (0.4 < DGP < 0.45), and 17
perceptible glare (0.35 < DGP < 0.4) account for 13.9%, 6.4% and 16.6% of working hours, 18
respectively. When diffuse translucent PS-TIM structures are applied, significant 19
improvement of the percentage of imperceptible glare (DGP ≤ 3.5) is achieved. This increases 20
from 63.1% of working hours for DG to 87.8%, 93.4%, 96.5% and 99.2% with the application 21
of PS-TIM with slat pitches of 15 mm, 10 mm, 7.5 mm and 5 mm, respectively. According to 22
the Wienold’s criteria [4] for categorising glare conditions in a room, when 7.5 mm PS-TIM 23
and 5 mm PS-TIM are applied, the room has a ‘Best’ classification for over 95% of office 24
21
offers a ‘Good’ classification as over 95% of office working hours the glare is perceptible and 1
the 15 mm PS-TIM has a ‘Reasonable’ classification as fewer than 5% of office working 2
hours have intolerable glare. 3
4
Figure 8: (a) Illuminance uniformity ratio (UR) (b) daylight glare probability (DGP) of window without and with diffuse
5
translucent PS-TIM with 4 different slat pitches
6
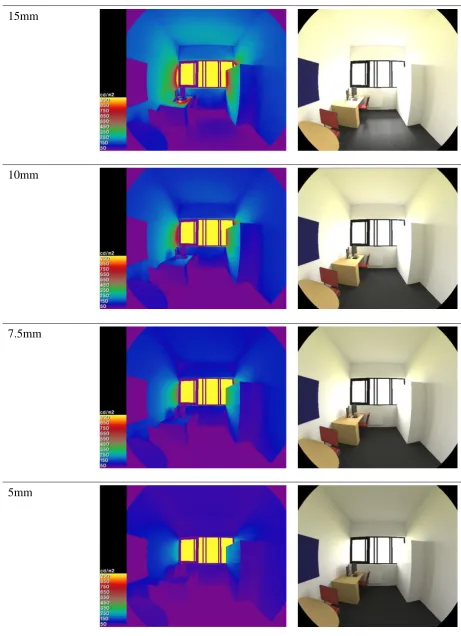
In order to provide a more intuitive impression of the daylight distribution and glare in 7
the office to accompany these metrics, false colour and true colour visualisations for noon on 8
the 21st March were generated and are shown in Figure 9. The presence of PS-TIM results in a 9
more homogenous distribution of daylight and the level of homogeneity increases as the slat 10
pitch gets smaller. 11
Equinox (March) 12pm
DG
[image:21.595.67.522.166.358.2]22 15mm
10mm
7.5mm
[image:22.595.63.525.71.708.2]5mm
Figure 9: RADIANCE false colour and visualizations and associated DGPs for window with and without PS-TIM with
1
different slat pitches for London on 21st March at 12pm under a CIE clear sky.
23
4.2
The effects of slat tilt angle on daylight performance
1In this section, simulation was undertaken for the PS-TIM with Lambertian diffuse 2
translucent slats placed with fixed slat pitch and the slat tilt angles, (φ), was varied between -3
60° and 60°, (labelled as ‘-60°’, ‘-45°’, ‘-30°’, ‘0°’, ‘30°’, ‘45°’ and ‘60°’ respectively in
4
preceding discussions). Figure 10 shows the variation of illuminance UR and DGP for a 15 5
mm PS-TIM at different tilt angles. This PS-TIM slat pitch was selected because it is the least 6
effective of the non-tilted configurations studied in section 4.1 (see Figure 10), therefore, 7
further investigations have been carried out to explore whether varying tilt angle has the 8
potential to improve its performance. 9
It can be seen in Figure 10 (a) and (b), that with the slats tilted at positive angles 10
relative to the sky vault (i.e. φ= 30°, 45° and 60°), the performance was worse than that of the 11
PS-TIM with non-tilted slats in terms of both daylight UR and DGP. Improved performance 12
can be observed in the data for slats with negative tilt angles if UR < 3.5 and DGP < 0.4 are 13
used as metrics. The percentage of working hours with UR below 1:2.5 improves from 66% 14
when slats are horizontally placed to 80% when slats are tilted at -30° and working hours with 15
DGP below 0.35 improves from 87% when slats are horizontally placed to around 90% when 16
24
1
2
Figure 10: (a) Illuminance uniformity ratio (UR), (b) daylight glare probability (DGP) for a window with diffuse
3
translucent PS-TIM with slat pitch of 15mm at 7 different tilt angles, and (c) definition of tilt angles, φ.
4
In terms of improving daylight comfort levels, Figure 10 also suggests that only PS-5
TIM with a tilt angle of -30° offers improved comfort over horizontally placed slats. Section 6
4.1 indicated that the 7.5 mm PS-TIM was the optimised pitch configuration for improving 7
both daylight availability and daylight comfort. On this basis, the performance of the 7.5 mm 8
PS-TIM with -30° tilted slats and 7.5 mm PS-TIM with non-tilted slats (labelled as 0°) were 9
compared in terms of daylight availability (i.e. UDI100-2000 lux and UDI500-2000 lux) as shown in 10
Figure 11. When evaluating the UDI in the range from 100 to 2000 lux, there is no significant 11
difference between the 7.5 mm PS-TIM system with slats tilted at angles of 0° and -30°. For 12
(a)
(b)
[image:24.595.61.510.97.518.2]25
the most desired daylight range of 500 to 2000 lux, the UDI values of these two tilt angles are 1
almost the same in the region close to the window (i.e. up to 1.7 m into the room). However, 2
at locations deeper within the room, the UDI values for PS-TIM with non-tilted slats remain 3
constant at around 50% of working hours, while those for the -30° tilted slats show a steady 4
decrease with only 30% of working hours indicating a favoured UDI. It can be concluded that 5
for the PS-TIM with slat pitch of 7.5 mm, 30° tilted slats do not provide significant 6
improvement of daylight availability when compared with non-tilted slats. 7
8
Figure 11: UDI100-2000 lux and UDI500-2000 lux for diffuse translucent PS-TIM with 7.5 mm slat pitch at 0° and -30° tilt
9
angles
10
4.3
The effects of slat material properties on daylight performance
11Sections 4.1 and 4.2 discussed the performance of PS-TIM with Lambertian diffuse 12
translucent slats located in the air cavity between the two panes of a double glazing unit. The 13
analysis was performed for various slat pitches ( i.e. 15 mm, 10 mm, 7.5 mm and 5 mm) and 14
various tilt angles ( i.e. -60°, -45°, -30°, 0°, 30°, 45° and 60° ) in a south facing office using 15
the climatic data for London. This section repeats part of this analysis (i.e. UDI, UR and DGP) 16
but replaces the PS-TIM diffusing slats with a transparent material. 17
The results of using UDI, UR and DGP to evaluate the performance of various 18
[image:25.595.85.501.273.468.2]26
Figure 12 (a) indicates that applying translucent PS-TIMs could increase the percentage of 1
working hours when the metrics lie in their desirable ranges (i.e. UDI in useful bin, uniformity 2
below 2.5 and DGP below 0.35) when compared with a standard double glazed window. 3
Figure 12 (b) shows the reduced percentage of working hours when the metrics lie in their 4
undesirable ranges (i.e. UDI in oversupplied bin, uniformity over 4.5 and DGP over 0.45) as 5
compared with the data for a standard double glazed window. As can be seen in Figure 12 (a), 6
the percentage of working hours during which the average UDI lies in the range of 100-2000 7
lux, DGP ≤ 3.5 and UR ≤ 1: 2.5 were 47%, 3% and 63% for standard double glazing unit. 8
These metrics can be increased by between 18 ~ 29% (UDI), up to 97% (UR) and 25 ~ 37% 9
(DGP), respectively, when PS-TIMs are applied. In addition, for the undesired ranges of these 10
metrics, as shown in Figure 12 (b), the percentage of working hours when the average UDI is 11
over 2000 lux is 41% for the double glazing unit, and it can be reduced by between 21% and 12
40%, depending on the type of PS-TIM used. There are 42% of working hours where the UR 13
is higher than 1: 4.5 and 14% of working hours where the DGP is higher than 0.45 when 14
using a standard double glazing unit: these two undesired situations can be completely 15
eliminated by integrating translucent PS-TIMs. 16
[image:26.595.100.347.528.760.2]27 1
Figure 12: Summary of performance metrics for PS-TIMs with translucent slats in (a) desirable ranges and (b)
2
undesirable ranges.
3
Figure 13 shows the UR and DGP after applying various configurations of PS-TIMs 4
with transparent slats, and Table 5 shows the percentage of working hours where the UDI is in 5
the range of 100-2000 lux. As can be seen from Table 5 and Figure 13, when comparing PS-6
TIMs with non-tilted transparent slats to standard double glazing, the 5 mm PS-TIM provides 7
the best performance in terms of reducing the percentage of working hours where the UR is 8
over 1: 4.5 (i.e. dropping from 42% to 24%). It also increases the percentage of working hours 9
with DGP below 3.5 from 63% to 69%, and slightly improves the percentage of working 10
hours from 50% to 51% where the desirable UDI100-2000 lux occurs. 11
On the basis of these results, the slats with 5 mm pitch were then investigated at 12
various tilt angles (-60°, -45°, -30°, 30°, 45°, and 60°) to identify an optimised configuration. 13
However, the results indicated that there was no obvious improvement in UR or DGP as 14
compared with the results for the non-tilted slats. Tilt angle has a slight impact on the 15
illuminance distribution. The -60° tilted slats, which have the best overall performance, can 16
improve the UDI100-2000lux by between 5% - 9% of working hours and improve the 17
[image:27.595.111.471.81.325.2]28
imperceptible DGP ≤ 3.5 by 11.5% of working hours as compared with the PS-TIM with 1
horizontal slats. However, the window with transparent PS-TIMs does not yield significant 2
improvement in either UDI distribution, UR or DGP as compared with the standard double 3
glazed unit, the results for each being very similar. 4
5
6
Figure 13: (a) Illuminance uniformity ratio (UR) (b) daylight glare probability (DGP) for a window with and without
7
transparent PS-TIM for 4 different slat pitches at 7 different tilt angles.
8
9
10
11
Various PS-TIM configurations
(b)
Various PS-TIM configurations
[image:28.595.102.432.190.599.2]29
Table 5: UDI100-2000lux for a window with and without transparent PS-TIM for 4 different slat pitches at 7 different tilt
1
angles.
2
0.2 0.7 1.2 1.7 2.2 2.7 3.2 3.7 4.2
DG 47% 30% 34% 42% 48% 55% 61% 66% 68%
15 mm_0° 48% 31% 36% 42% 48% 55% 60% 65% 67%
10 mm_0° 49% 32% 37% 43% 48% 55% 60% 65% 67%
7.5 mm_0° 50% 33% 38% 43% 48% 55% 60% 65% 67%
5 mm_0° 51% 34% 38% 43% 49% 55% 61% 65% 67%
5 mm_30° 50% 32% 36% 42% 49% 53% 59% 63% 64%
5 mm_45° 46% 32% 37% 42% 50% 56% 63% 67% 69%
5 mm_60° 48% 33% 40% 43% 50% 58% 66% 70% 71%
5 mm_-30° 54% 35% 39% 43% 50% 57% 65% 69% 71%
5 mm_-45° 55% 37% 41% 44% 52% 59% 66% 72% 74%
5 mm_-60° 55% 38% 42% 46% 53% 61% 68% 75% 76%
30
5.
Results and discussion of applying PS-TIM at different climates
1
and for different room orientations
2
The performance of the PS-TIM window systems is likely to be influenced by the 3
latitude of the site which they are used on and the orientation of the glazing relative to the sun 4
path. In addition, climatic influences that dictate the balance between clear skies with direct 5
sunlight and overcast skies with diffuse light also influence performance. 6
This section explores the daylight performance obtained from simulating PS-TIM 7
performance using IWEC weather data for five cities viz Stockholm, London, Beijing, Hong 8
Kong and Singapore. These represent different geographical locations and weather/solar 9
conditions. In addition, the daylight performance for the prototype office facing four different 10
orientations (East, West, South and North) located at London (a relatively high latitude site 11
outside the Tropics) and Singapore (located within the Tropics, close to the equator) is also 12
studied. In these studies, the PS-TIM comprises diffused translucent non-tilted slats contained 13
within a double glazing unit. From section 4, slat pitch rather than slat tile angle showed the 14
most significant effect on the daylight performance, therefore, the sole PS-TIM variable 15
explored in this section. As in the previous sections, the useful daylight illuminance (UDI) 16
was predicted at regular points located along the centre line of the room between the window 17
to the end wall as indicated in Figure 4. The other two metrics, UR and DGP, were not 18
considered because PS-TIMs with all proposed slat pitches showed significant improvement 19
of daylight performance in these two metrics. 20
5.1
The application of PS-TIM in different climates
21Figure 14 (a) ~ (e) shows the distribution of standard UDI bins used to quantify 22
performance for the five different climates considered (these span a latitude range between 23
31
bin size (UDI500-2000 lux), which captures only data that meet the design illuminance of at least 1
500 lux. This provide greater detail than using the UDI100-2000 lux bin alone. 2
The standard double glazed system shows similar daylight performance for each of the 3
cities considered. In the region close to the window, a significant proportion of the working 4
hours shows over illumination (i.e. appearing in the UDI>2000 bin). As a consequence, only a 5
small number of hours fall into the desirable levels of illumination (i.e. appearing in the 6
UDI500-2000 lux bin). The inclusion of PS-TIM improves the luminous environment in the region 7
close to the window by reducing the hours of over illumination and in so doing provides a 8
more uniform illumination of the working plane. As can be seen in Figure 14 (a) and (b), the 9
application of PS-TIMs with 7.5 mm and 5 mm slat pitch can provide relatively even 10
distribution of UDI100-2000 lux and improve its proportion to approximately 70% and 80% of 11
working hours in Stockholm and London, respectively. When using the additional criteria 12
UDI500-2000 lux (as shown in Figure 14 (f) and (g)), it can be seen that with a decrease the slat 13
pitch from 7.5 mm to 5 mm, the percentage of working hours with illuminance in the most 14
desired range reduced. Thus, PS-TIM with a 7.5 mm slat pitch provides the best all round 15
performance in Stockholm and London. For Beijing, as shown in Figure 14 (c) and (h), the 16
PS-TIM with a 5 mm slat pitch can improve the UDI100-2000 lux to around 90% of working 17
hours and achieve a homogenous light distribution. However, when compared with PS-TIM 18
with a 10 mm or 7.5 mm slat pitch, it performs worse in the illuminance range of 500-2000 19
lux, with a greater proportion of working hours falling in the range of 100-500 lux. The 20
application of PS-TIMs with 7.5 mm and 5 mm slat pitch provide a relatively even 21
distribution of UDI100-2000 lux and improve the metric to around 90% of working hours. PS-TIM 22
with a 10 mm slat pitch offer the best performance of UDI500-2000 lux in Hong Kong (as shown 23
32
the range of 100-2000 lux to 90% of working hours in Singapore and PS-TIM with a 10 mm 1
slat pitch performed best in the additional UDI500-2000 lux criteria.
2
Generally, as latitude increases a smaller slat pitch is required to achieve optimised 3
performance and evenly distribute the daylight. For example, the 7.5mm slat pitch PS-TIM 4
can provide relatively even distribution of UDI500-2000 lux and UDI100-2000 luxwhen applied in 5
London, and PS-TIM with a 10mm slat pitch can achieve similar effect when used in 6
Singapore. This is a consequence of the relationship between solar altitude and the pass angle 7
for the PS-TIM (i.e. tan-1 (slat pitch / cavity width)). This dictates whether direct solar 8
radiation can reach the working plane in the region close to the window or whether this light 9
is incident on the slat and diffused. It is worth noting that for Beijing, only the PS-TIM with a 10
5 mm slat pitch can achieve a homogenous distribution of UDI100-2000 lux. This is because the 11
direct solar irradiation is strong in the year of IWEC weather data (as shown in Appendix A) 12
and leads to significant numbers of hours of over supply (i.e. UDI> 2000lux) despite undergoing 13
attenuation in the diffusing PS-TIM. 14
To conclude, both the solar irradiation intensity and the solar altitude angle affect the 15
process of selecting an optimal slat pitch for a window integrating with PS-TIM. 16
17
18
19
20
21
22
33
(a) Stockholm UDIbins (f) Stockholm UDI500-2000lux
(b) London UDI bins (g) London UDI500-2000lux
34
(d) Hong Kong UDI bins (i) Hong Kong UDI500-2000lux
(e) Singapore UDI bins (j) Singapore UDI500-2000lux
Figure 14: (a-e) standard three UDI bins and (f-j) UDI500-2000 lux bin at points along central line from south-facing
1
window to end wall with and without PS-TIM with 4 different slat pitches under 5 different climate conditions: (a)
2
and (f) Stockholm, (b) and (g) London, (c) and (h) Beijing, (d) and (i) Hong Kong, and (e) and (j) Singapore,
3
[image:34.595.78.528.80.439.2]35
5.2
The application of PS-TIM to windows with differing orientation
1The studies thus far in this paper have focused on equator facing facades. These are 2
subject to highest altitude direct solar irradiation in the sun path. This section explores glazing 3
positioned in east and west facades, where lower altitude morning and evening sun 4
predominates, as well as north facing facades, where for the sites chosen in this study, diffuse 5
light tends to dominate. 6
In this section, only the useful bin (100 ~ 2000 lux) of common three bins UDI metric 7
is explored to provide an approximate picture of daylight performance. For a south facing 8
window in London, as shown in Figure 15 (a), the 7.5 mm PS-TIM provides an even 9
distribution and the highest percentage of operating hours (80%) with a useful UDI100-2000 lux. 10
The north-facing façade mainly receives diffuse skylight rather than direct sunlight, thus, as 11
shown in Figure 15 (b), PS-TIM with any slat pitch can provide a homogenous distribution of 12
UDI100-2000 lux with the 15mm slat pitch providing the highest percentage of UDI100-2000 lux 13
being met. For the east and west orientation, the direct solar radiation is incident on the façade 14
at low altitude angles for a short period after sunrise or before sunset and the radiation is not 15
generally as strong as radiation incident on the south façade at noon. Under these conditons, 16
10 mm PS-TIM is sufficient to achieve a homogenous distribution of light and the highest 17
level of UDI100-2000 lux (Figure 15 (c) and (d)). Summarising, for cities with relatively high 18
latitude (e.g. London), the south facing façade requires the smallest PS-TIM slat pitch to 19
maximise useful daylight levels and distribution. Larger slat pitches can be used on the east 20
and west facing façades, while the north facing façade can achieve comfortable daylight using 21
the PS-TIM with largest slat pitch (in this case the 15 mm slat pitch). 22
23
36 1
2
[image:36.595.46.494.74.488.2]3
Figure 15: UDI bins for points along central line from window to end wall with (a) south, (b) north, (c) west, and (d)
4
east window orientations with and without PS-TIM with 3 different slat pitches under London climate condition.
5
Singapore (see Figure 16), lies in the Tropics near the equator. As a consequence, the 6
noon solar altitude is high (i.e. over 65°) all over the year and the sunlight is incident on the 7
north and south facades depending on the season. Similar to the conditions in London, the 8
sunlight with relatively low solar altitude is incident on east and west facades in the early 9
morning and late afternoon respectively and has the potential to penetrate deeper into rooms, 10
often with high irradiation levels. Thus, compared with south and north facing façades, where 11
PS-TIM with a 10mm slat pitch is sufficient to deliver a homogenous distribution of UDI100-12
2000 lux, the east and west facing façades require PS-TIM with 7.5 mm slat pitch to achieve 13
similar effect. It can be concluded that, for cities with relatively low latitude (e.g. Singapore), 14
Distance from window (m)
(a) SOUTH orientation
Distance from window (m)
(b) NORTH orientation
* *
Distance from window (m)
(c) WEST orientation
Distance from window (m)
(d) EAST orientation
* *
37
PS-TIM applied to east and west facing façades, requires smaller slat pitches than PS-TIMs 1
applied to south and north facing façades. 2
3
4
5
[image:37.595.45.492.104.528.2]6
Figure 16: UDI bins at points along central line from window to end wall with (a) south, (b) north, (c) west, and (d)
7
east window orientations with and without PS-TIM with 3 different slat pitches under Singapore climate condition.
8
* : Window position
Distance from window (m)
(a) SOUTH orientation
Distance from window (m)
(b) NORTH orientation
Distance from window (m)
(c) WEST orientation
Distance from window (m)
(d) EAST orientation
* *
38
6.
Conclusion
1
An investigation of the daylight performance of a double glazed window with 2
integrated parallel slat transparent insulation materials PS-TIMs, for a range of different sites 3
and window orientations was conducted using RADIANCE in combination with Bidirectional 4
Scattering Distribution Functions (BSDFs) to represent the PS-TIMs’ optical performance. 5
The following conclusions can be drawn: 6
1) PS-TIMs with translucent slats offer better performance than PS-TIMs with transparent 7
slats in terms of Useful Daylight Illuminance (UDI), uniformity ratio (UR) and Daylight 8
Glare Probability (DGP); 9
2) when compared with standard double glazing, glazing with integrated PS-TIM can 10
increase the percentage of working hours when the UDI lies in the range of 100-2000 lux 11
by between 47% and 79% depending on the type of the PS-TIM used, achieve a 12
homogenous distribution of daylight, and effectively reduce the risk of glare; 13
3) the use of PS-TIMs at different latitudes suggested that with increasing latitude, a smaller 14
slat pitch is required to maximise useful daylight (UDI100-2000lux) and evenly distribute the 15
daylight. The intensity of solar radiation and the balance of time where clear or overcast 16
skies prevail affect the process of identifying an optimal PS-TIM configuration. While 17
some observations are made, the relationships are not quantified in this study; 18
4) when applying PS-TIMs to windows with different orientations a general observation for 19
sites located outside of the Tropics is that the smallest slat pitch is required on the equator 20
facing façade, east/west facades provide daylight with a slightly larger pitches and facades 21
facing away from the equator can operate effectively with the largest slat pitch. For sites 22
within the Tropics, north and south facades receive direct irradiation and the slat pitch 23
39
the equator to relatively smaller pitches on the equator facing façade as you move away 1
from the equator. 2
This study has restricted itself to exploring the effect of PS-TIM on indoor daylight 3
level. Their influence on the overall energy performance will be presented in further research 4
papers. 5
The effects that PS-TIM has on the view into and out of a building are not considered 6
in this study. As part of an overarching glazing strategy, PS-TIM may therefore be usefully 7
used to maintain the external appearance of a glazed façade and admit daylight above and 8
below any regions of a façade reserved for maintaining view out of or into a building, where 9
conventional glazing would be more appropriate. 10
11
Acknowledgements
12This work was supported by the Faculty of Engineering, University of Nottingham 13
40
Appendix A:
1
The diurnal average direct and diffuse solar radiation of (a) Stockholm, (b) London, (c) Beijing, (d) Hong
2
Kong and (e) Singapore
3
4
(a) More direct solar radiation than diffuse solar radiation in Stockholm’s climate
(b) Approximately equal direct and diffuse solar radiation in London’s climate
(c) Very strong direct solar radiation in winter, skies diffuse in summer in Beijing’s climate
(d) Approximately equal direct and diffuse solar radiation in Hong Kong’s climate
41
Reference:
1
1. SHC, Daylight in Buidling, in ECBCS Annex 29/ SHC Task 21 Project Summary 2
Report, Kjeld John and R. Watkins, Editors. 2010: Hertfordshire, United Kingdom. 3
2. Pellegrino, A., Traditional and new metrics for effective daylighting design, in 4
Advanced Builidng Skins, Energy Forum. 2013: Bressanone, Italy. 5
3. Sun, Y., et al., Thermal evaluation of a double glazing façade system with integrated 6
Parallel Slat Transparent Insulation Material (PS-TIM). Energy and Buildings, 2016. 7
In Press. 8
4. Wienold, J., Dynamic daylight glare evaluation. , in Builing simulation 2009 the 11th 9
international IBOSA conference. 2009: Glasgow, UK. p. 44-51. 10
5. Wienold, J., Dynamic simulation of blind control strategies for visual comfort and 11
energy balance analysis. , in Building simulation 2007, the 10th international IBOSA 12
conference. 2007: Beijing, China. p. 1197-204. 13
6. Nabil, A. and J. Mardaljevic, Useful daylight illuminances: A replacement for daylight 14
factors. Energy and Buildings, 2006. 38(7): p. 905-913. 15
7. Mangkuto, R.A., M. Rohmah, and A.D. Asri, Design optimisation for window size, 16
orientation, and wall reflectance with regard to various daylight metrics and lighting 17
energy demand: A case study of buildings in the tropics. Applied Energy, 2016. 164: p. 18
211-219. 19
8. Kapsis, K., V. Dermardiros, and A.K. Athienitis, Daylight Performance of Perimeter 20
Office Façades utilizing Semi-transparent Photovoltaic Windows: A Simulation Study. 21
Energy Procedia, 2015. 78: p. 334-339. 22
9. Berardi, U. and H.K. Anaraki, Analysis of the Impacts of Light Shelves on the Useful 23
Daylight Illuminance in Office Buildings in Toronto. Energy Procedia, 2015. 78: p. 24
1793-1798. 25
10. Li, L., M. Qu, and S. Peng, Performance evaluation of building integrated solar 26
thermal shading system: Building energy consumption and daylight provision. Energy 27
and Buildings, 2016. 113: p. 189-201. 28
11. Bellia, L., A. Pedace, and F. Fragliasso, The role of weather data files in Climate-29
based Daylight Modeling. Solar Energy, 2015. 112: p. 169-182. 30
12. M. Saxena, et al., Dynamic RADIANCE – Predicting annual daylight with variable 31
fenestratio optics using BSDFs, in Fourth National Conference of IBPSA-USA. 2010: 32
New York City, USA. 33
13. Reinhart, C. and S. Herkel, The simulation of annual daylight illuminance 34
distributions — a state-of-the-art comparison of six RADIANCE-based methods. 35
Energy and Buildings, 2000. 32(2): p. 167-187. 36
14. Reinhart, C. and O. Walkenhorst, Validation of dynamic RADIANCE-based daylight 37
simulations for a test office with external blinds. Energy and Buildings, 2001. 33(7): p. 38
683-697. 39
15. Reinhart, C. and M. Andersen, Development and validation of a Radiance model for a 40
translucent panel. Energy and Buildings, 2006. 38(7): p. 890-904. 41
16. Ward, G., et al., Simulating the daylight performance of Complex Fenestration 42
Systems using Bidirectional Scattering Distribution Functions within Radiance. 43
Journal of the Illuminating Engineering Society of North America 2011. 7(4). 44
17. Konstantoglou, M., J. Jonsson, and E. Lee, Simulating Complex Window Systems 45
using BSDF Data, in 26th Conference on Passive and Low Energy Architecture. 2009: 46
42 18. de Boer, J., Modelling indoor illumination by complex fenestration systems based on 1
bidirectional photometric data. Energy and Buildings, 2006. 38(7): p. 849-868. 2
19. CF. Reinhart and VRM. LoVerso, A rules of thumb-based design sequence for diffuse 3
daylight. Lighting Research and Technology, 2010. 42(1): p. 7-31. 4
20. CF. Reinhart, Daylight performance predictions, in Building performance simulation 5
for design and operation Jan L.M. Hensen and R. Lamberts, Editors. 2011, Spon Press: 6
London. 7
21. IESNA, IESNA Lighting Handbook, 9th ed. 2000, Illuminating Engineering Society of 8
North America: New York. 9
22. Construction, P.s.R.o.C.M.o., Chinese Standard for daylight design of building, in 10
GB/T 50033- 2001. 2001, China Building Industry Press: Beijing. 11
23. Moon, P. and D. Spencer, Illumination from a Nonuniform Sky. Illuminating 12
Engineering, 1942. 37(10): p. 707-726. 13
24. USGBC. LEED-NC (leadership in energy and environmental design) version 3.0. 14
2006 [cited 2006; www.usgbc.org/LEED/]. 15
25. BRE, BREEAM Hea 1:Visual comfort. 2014: London. 16
26. Ochoa, C.E., et al., Considerations on design optimization criteria for windows 17
providing low energy consumption and high visual comfort. Applied Energy, 2012. 95: 18
p. 238-245. 19
27. CIBSE, Guide A - Environmental Design. 2006, CIBSE Publications: London. 20
28. Wienold, J. and J. Christoffersen, Evaluation methods and development of a new glare 21
prediction model for daylight environments with the use of CCD cameras. Energy and 22
Buildings, 2006. 38(7): p. 743-757. 23
29. G. Ward and R. Shakespeare, Rendering with Radiance: The Art and Science of 24
Lighting Visualization, Revised Edition. 2004: BookSurge, LLC. 25
30. Jacobs, A. Radiance Tutorial. 2012 [cited 2016. 26
31. McNeil, A., The Three-Phase Method for simulation Complex Fenestration with 27
Radiance. 2014. 28
32. Andersen, M. and J. de Boer, Goniophotometry and assessment of bidirectional 29
photometric properties of complex fenestration systems. Energy and Buildings, 2006. 30
38(7): p. 836-848. 31
33. Andersen, M., et al., Bi-directional transmission properties of Venetian blinds: 32
experimental assessment compared to ray-tracing calculations. Solar Energy, 2005. 33
78(2): p. 187-198. 34
34. Andersen, M., M. Rubin, and J.-L. Scartezzini, Comparison between ray-tracing 35
simulations and bi-directional transmission measurements on prismatic glazing. Solar 36
Energy, 2003. 74(2): p. 157-173. 37
35. McNeil, A., et al., A validation of a ray-tracing tool used to generate bi-directional 38
scattering distribution functions for complex fenestration systems. Solar Energy, 2013. 39
98: p. 404-414. 40
36. Reinhart, C.F. and M. Andersen, Development and validation of a Radiance model for 41
a translucent panel. Energy and Buildings, 2006. 38(7): p. 890-904. 42
37. J, M., Validation of a lighting simulation program under real sky condtions. Lighting 43
Research + Technology, 1995. 27(4): p. 181-188. 44
38. Mardaljevic, J., Validation of a lighting simulation program: a study using measured 45
sky brightness distributions, Lux, , in The Eighth European Lighting Conference,. 46
1997: Amsterdam. p. 555-569. 47
39. Mardaljevic, J., Daylight design, simulation and compliance for solar building 48