Cost-Effectiveness of the School-Based Asthma
Therapy (SBAT) Program
WHAT’S KNOWN ON THIS SUBJECT: Urban children suffer disproportionately from asthma, and suboptimal treatment with preventive medications is common. Although several programs have been developed to reduce morbidity for urban children with asthma, their economic feasibility and sustainability remain unknown.
WHAT THIS STUDY ADDS: Our study demonstrates that the school-based asthma therapy program could be an economically effective program for children aged 3 to 10 years attending preschool or elementary school in a city school district, at the cost of $10/symptom-free day.
abstract
BACKGROUND AND OBJECTIVE: Impoverished urban children suffer disproportionately from asthma and underuse preventive asthma medications. The objective of this study was to examine cost-effectiveness (CE) of the School-Based Asthma Therapy (SBAT) program compared with usual care (UC).
METHODS:The analysis was based on the SBAT trial, including 525 chil-dren aged 3 to 10 years attending urban preschool or elementary school who were randomized to either UC or administration of 1 dose of preventive asthma medication at school by the school nurse each school day. The primary outcome was the mean number of symptom-free days (SFDs). The impact of the intervention on medical costs was estimated by using parent-reported child health services utilization data and average national reimbursement rates. We estimated the cost of running the program using wages for program staff. Productivity costs were estimated by using value of parent lost time due to child illness. CE of the SBAT program compared with UC was evaluated based on the incremental CE ratio.
RESULTS:The health benefit of the intervention was equal to∼158 SFD gained per each 30-day period (P, .05) per 100 children. The pro-grammatic expenses summed to an extra $4822 per 100 children per month. The net saving due to the intervention (reduction in medical costs and parental productivity, and improvement in school atten-dance) was $3240, resulting in the incremental cost-savings difference of $1583 and CE of $10 per 1 extra SFD gained.
CONCLUSIONS:The SBAT was effective and cost-effective in reducing symptoms in urban children with asthma compared with other existing programs.Pediatrics2013;131:e709–e717
AUTHORS:Katia Noyes, PhD, MPH,aAlina Bajorska, MS,b Susan Fisher, PhD, MS,aJoseph Sauer, BS,cMaria Fagnano, MPH,cand Jill S. Halterman, MD, MPHc
Departments ofaSurgery,bPublic Health Sciences, and cPediatrics, University of Rochester, Rochester, New York KEY WORDS
randomized trial, cost-effectiveness, asthma, minority children, urban, preventive medicine
ABBREVIATIONS
CE—cost-effectiveness CI—confidence interval ED—emergency department HC—health care
ICER—incremental cost-effectiveness ratio PCP—primary care provider
SBAT—School-Based Asthma Therapy SFD—symptom-free days
UC—usual care
WADA—weighted average daily attendance
Dr Noyes conceptualized and designed cost-effectiveness analysis, interpreted the results, drafted the initial manuscript, and approved thefinal draft as submitted; Ms Bajorska conducted the data analyses, helped interpret the results, assisted with drafting of the initial manuscript, and approved thefinal draft as submitted; Dr Fisher assisted in the planning of the trial and with preparation of the manuscript; Mr Sauer contributed to the design and implementation of the trial and assisted with data preparation for the manuscript; Ms Fagnano participated in the planning of the trial, directed the trial, and assisted with the conceptualization of the analysis and preparation of the manuscript; and Dr Halterman conceptualized and designed the trial, and assisted with the conceptualization of this analysis and preparation of the manuscript.
This trial has been registered at www.clinicaltrials.gov (identifier NCT01175369).
www.pediatrics.org/cgi/doi/10.1542/peds.2012-1883
doi:10.1542/peds.2012-1883
Accepted for publication Nov 2, 2012
Address correspondence to Katia Noyes, PhD, MPH, Department of Surgery, University of Rochester Medical Center, 265 Crittenden Blvd, CU 420644, Rochester, NY 14642. E-mail: [email protected]
Asthma is one of the most common chronic illnesses of childhood1–3 that often results in preventable hospital-izations.4–8 Asthma causes morbidity from daytime and nighttime symptoms, impairment of quality of life, and func-tional impairment, including limitation of activity, absenteeism from school, and missed days of work for caretakers. In the United States, poor and minority children suffer disproportionately from asthma,9–12 and suboptimal treatment with preventive medications is common.
Several intervention programs have been developed to reduce morbidity for urban children with asthma. Most of these have involved relatively intensive
case-management and educational in-terventions, with varied effectiveness.13–26 We recently completed the School-Based Asthma Therapy (SBAT) trial and dem-onstrated effectiveness in improving outcomes.27,28The purpose of this study was to examine the cost-effectiveness (CE) of the SBAT program compared with a usual care (UC) control group that did not receive the intervention.
METHODS
Study Population
The University of Rochester Institution-al Review Board approved the study protocol. During the beginning of 3
consecutive school years starting in 2006, we recruited children aged 3 to 10 years attending preschool or elemen-tary school in the Rochester City School District in Rochester, NY, who had physician-diagnosed asthma with per-sistent symptoms based on National Heart, Lung, and Blood Institute Expert Panel guidelines.27–30Persistent symp-toms at screening were based on responses to questions that asked the caregiver to think about symptoms during a“typical week”in the past year, as well as the number of asthma attacks in the past year. Children were excluded if they had other medical conditions that could interfere with the
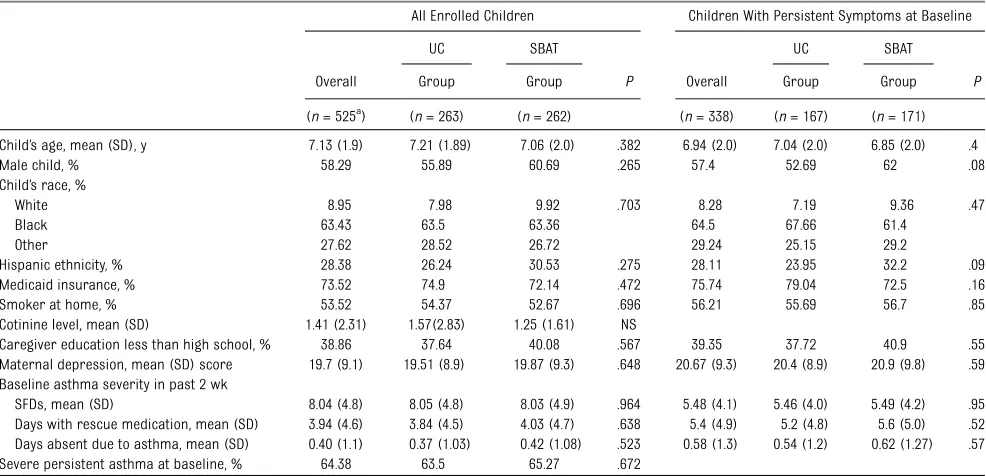
TABLE 1 Participant Characteristics at Baseline
All Enrolled Children Children With Persistent Symptoms at Baseline
UC SBAT UC SBAT
Overall Group Group P Overall Group Group P
(n= 525a
) (n= 263) (n= 262) (n= 338) (n= 167) (n= 171)
Child’s age, mean (SD), y 7.13 (1.9) 7.21 (1.89) 7.06 (2.0) .382 6.94 (2.0) 7.04 (2.0) 6.85 (2.0) .4
Male child, % 58.29 55.89 60.69 .265 57.4 52.69 62 .08
Child’s race, %
White 8.95 7.98 9.92 .703 8.28 7.19 9.36 .47
Black 63.43 63.5 63.36 64.5 67.66 61.4
Other 27.62 28.52 26.72 29.24 25.15 29.2
Hispanic ethnicity, % 28.38 26.24 30.53 .275 28.11 23.95 32.2 .09
Medicaid insurance, % 73.52 74.9 72.14 .472 75.74 79.04 72.5 .16
Smoker at home, % 53.52 54.37 52.67 .696 56.21 55.69 56.7 .85
Cotinine level, mean (SD) 1.41 (2.31) 1.57(2.83) 1.25 (1.61) NS
Caregiver education less than high school, % 38.86 37.64 40.08 .567 39.35 37.72 40.9 .55
Maternal depression, mean (SD) score 19.7 (9.1) 19.51 (8.9) 19.87 (9.3) .648 20.67 (9.3) 20.4 (8.9) 20.9 (9.8) .59 Baseline asthma severity in past 2 wk
SFDs, mean (SD) 8.04 (4.8) 8.05 (4.8) 8.03 (4.9) .964 5.48 (4.1) 5.46 (4.0) 5.49 (4.2) .95
Days with rescue medication, mean (SD) 3.94 (4.6) 3.84 (4.5) 4.03 (4.7) .638 5.4 (4.9) 5.2 (4.8) 5.6 (5.0) .52 Days absent due to asthma, mean (SD) 0.40 (1.1) 0.37 (1.03) 0.42 (1.08) .523 0.58 (1.3) 0.54 (1.2) 0.62 (1.27) .57
Severe persistent asthma at baseline, % 64.38 63.5 65.27 .672
aThe number of records per child varied from 1 to 10 with the average of 7.5 interviews per child (similar across the groups).
TABLE 2 Utilization of HC Related to Asthma
Cost per Unit Mean (SE) [ 95% CI]
UC Group SBAT Group PValue Overall
Total No. of Visits
Mean No. of Visits (SE)
Total No. of Visits
Mean No. of Visits (SE)
Total No. of Visits
Mean No. of Visits (SE)
Office visits with prednisone $97 ($7) [$83–$110] 37 1.74 (0.35) 29 1.45 (0.34) .561 66 1.60 (0.25)
ED visits with prednisone $306 ($51) [$206–$406] 16 0.81 (0.20) 13 0.66 (0.18) .567 29 0.74 (0.13)
Hospitalization with prednisone $2997 ($965) [$1005–$4990] 2 0.10 0 0.00 2 0.05
Total office, ED, and hospital stays with prednisone
55 2.58 (0.42) 42 2.08 (0.42) .412 97 2.33 (0.30)
SFDs, mean (SE) 2398 (35) 2556 (28) .001 2476 (23)
Missed school days, mean (SE) 84 (7) 60 (7) .014 72 (5)
assessment of asthma-related out-comes (cysticfibrosis, congenital heart disease, other lung disease), if the primary caregiver was unable to speak and understand English, if they were planning to leave the school district within 6 months, or if they had no access to a telephone for follow-up surveys (at home or an easily accessi-ble alternate location).
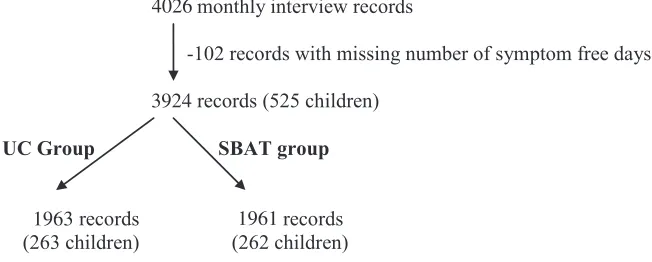
After the baseline assessment, children were stratified by exposure to tobacco smoke in the home and were assigned to the SBAT or UC group by blocked randomization in a 1:1 ratio. The in-tervention continued for∼10 months, September through June of each year. The main analysis included 3924 person-month records from 525 chil-dren (Figure 2). We also repeated the analysis for those children who at the baseline assessment reported current persistent symptoms (.4 days of daytime symptoms and/or .1 night with nighttime symptoms over 2 weeks before baseline assessment;n= 338).
Trial Design
The primary intervention for children in the SBAT group was directly observed administration of preventive asthma medication at school. Children were followed for 1 school year (7–9 months). Each child received 1 dose of medica-tion (fluticasone propionate orfl utica-sone with salmeterol xinafoate) from the school nurse once each school day.27,28,31Parents were responsible for medication administration on weekend days and other days the child did not attend school.
The medication dose varied depending on the child’s baseline asthma therapy, and medication adjustments were made at the primary care provider’s (PCP) discretion. Assessment for pos-sible step-up in therapy occurred dur-ing the first 3 months of the intervention28 and recommendations for adjustments were relayed to the
parents and PCPs. The process of symptom assessment, communication, and delivery of medications to schools and families was facilitated by the study team along with a nurse educa-tor (a registered nurse with specific training in asthma care).
In the UC group, caregivers were en-couraged to contact their PCP to dis-cuss the child’s persistent asthma symptoms. Families were responsible for filling prescriptions and adminis-tering medications daily to the child.
Health Outcomes
All families were given diaries based on the school calendar to track their child’s symptoms. Outcomes were assessed by monthly telephone interviews by an independent research group blinded to group allocation. The completion rate was 90% and higher each month.
The primary SBAT trial outcome was the number of symptom-free days (SFDs) during the previous 2 weeks.27Parents were asked to refer to their diaries and report the number of days their child experienced no symptoms of asthma (defined as a 24-hour period with no coughing, wheezing, chest tightness, or shortness of breath and no need for rescue medications) during the past 2 weeks. For the CE assessment, effec-tiveness was measured as the differ-ence between the SBAT and UC groups in the average number of SFDs during the 30-day period before each assess-ment.
Evaluating Costs
Four main categories of costs were considered, including programmatic costs (total staff salaries divided by the number of children), health care (HC) costs, school attendance fees losses, and parents’ productivity losses, esti-mated at individual child (family) level. Costs associated with the study that would not exist as part of the in-tervention in a real-life setting were not
included in the cost analysis. We did not include medication costs as part of the program costs, because according to the national guidelines all children should have been using a preventive asthma medication regardless of the study procedures.
To estimate HC costs, parents were asked monthly about their children’s hospitalizations, emergency depart-ment (ED) or physician visits, medical procedures, and tests for the past month. We defined an acute exacerba-tion as any visit for asthma where prednisone was prescribed. Medical records were reviewed for 10% of the sample to confirm office and ED visits and hospitalizations; visits were
con-firmed in 83% of cases.
The schools’saved revenue due to re-duced absenteeism was calculated based on the number of expected missed school days using the weighted average daily attendance (WADA) rate of $40 per absent day.32–36
The productivity/opportunity costs were determined based on the amount of time parents took off from work to care for sick children or to take them to see a doctor. We used a standard parent daily wage estimate of $80 to estimate value of parent time lost from work.37
CE Analysis
To determine the average numbers of SFDs, physician office and ED visits, as well as child’s missed school days due to asthma in each group, we used the generalized estimating equation Pois-son log-linear regression models with group (SBAT versus UC) assignment as the only explanatory variable. We used robust SEs to control for dependence between multiple observations over time provided by the same child. To calculate the average number of hos-pital admissions due to asthma, we divided the number of hospitalizations by the number of months a child was enrolled in the study.
The goal of a CE assessment is to esti-mate or predict economic feasibility of an intervention once it is implemented in a real practice setting. Hence, instead of actual parameters (costs or health effects) from a particular randomized controlled trial or database, research-ers often use predicted generalized estimates for a relevant/eligible ulation. In this case, the relevant pop-ulation is all US urban children, so we used 2005–2009 Medical Expenditures Panel Survey data to obtain estimates of mean costs of asthma-related doctor office visits, ED visits, and hospital admissions for children with asthma for ages 3 to 10 (Table 2).38The expec-ted cost of HC use was calculaexpec-ted by multiplying estimated expected utiliza-tion by estimated unit costs adjusted to 2009 US dollars.37
We assessed health and economic benefits of the SBAT compared with UC by using the standard CE methodol-ogy.39,40The 3 cohorts that completed the study in 3 consecutive years were stacked together and analyzed as 1 study cohort. Because most children in the study were eligible for Medicaid or the State Children’s Health Insurance Program (74%), the main analysis was conducted from the Medicaid per-spective. The main outcome for the CE analysis from the society perspective was an incremental CE ratio (ICER), which is the ratio of net total in-tervention costs to the number of SFDs gained,
ICER¼ ðDMedicalþDProductivityþDSchool
þ$ ProgramÞ=DSFD;whereD¼ðSBATÞ2ðUCÞ:
To estimate how much the results of our CE analysis depend on our assumptions and sources of information about SBAT-associated costs, we used the boot-strapping method41and varied the unit costs to lower and upper bounds of a 95% confidence interval (CI). We also plotted CE acceptability curves,
linking various values of 1 SFD obtained TABLE
from the literature for other school-based asthma-management pro-grams13–26to probability of SBAT being cost-effective.42–45
RESULTS
Population Descriptive Statistics
The children’s mean age was 7.1 years, and more than half were boys (58%, Table 1). Approximately two-thirds of the cohort were black (63%), and three-quarters were covered by Med-icaid (74%). Asthma severity was sim-ilar at baseline with children in both groups having an average of 8 SFDs and 4 days using rescue medication per 2 weeks; 64% of all children had persistent symptoms at the time of the baseline assessment. As presented for the main study,27there were no differ-ences in demographic characteristics between children in the 2 study groups (Table 1).
Health Care Utilization and Costs
Across all utilization categories, chil-dren in the SBAT group had 1.45 acute office visits with prednisone compared with 1.74 in the UC group (per 100 children per month,P= .56, Table 2). The mean number of all doctor visits (all types) across the 2 groups was 2.33 per 100 children over 1 month, with 2.08 in the SBAT group and 2.58 in UC group. The average number of missed school days was lower in the SBAT group (60 SBAT versus 84 UC per 100 children per month,P= .01).
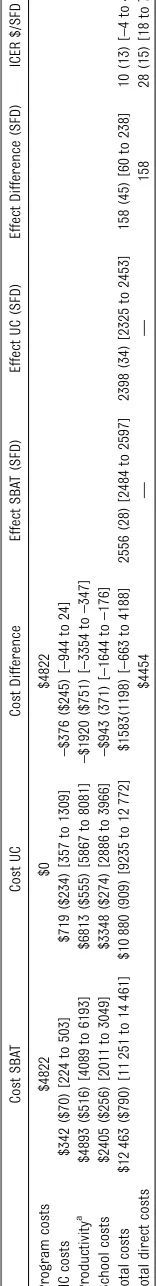
The programmatic costs were esti-mated to be $4822 per 100 children per month assuming $66 000 a year for salary and benefits for a nurse educa-tor and $10 per hour, for 40 hours a week, for 12 weeks for a research assistant to perform symptom screening and scheduling (Table 3). For a program working only with children with continued persistent symptoms, one would have to screen 156 children
with asthma to identify 100 children with persistent symptoms.
Among all participating children, the average costs associated with parents’ missed days from work were valued at $4893 (SE $516) for the SBAT group versus $6813 (SE $555) for the UC group, resulting in the incremental difference of $1920 (Table 3). Because of improved attendance attributable to the asthma intervention, the schools on average saved $943 (SE $371) in state WADA funding.
The difference in total HC costs (office visits, ED visits, and hospitalizations with prednisone) between groups is not significant, with the negative difference being interpreted as savings (–$376, 95% CI –$944 to $24 per 100 children per month). The total saving attribut-able to the intervention, including re-duction in HC costs, rere-duction in productivity, and attendance losses, was $3240. These savings offset part of the programmatic costs, $4822 per 100 children per month ($48 per child per month), resulting in the overall differ-ence of $1583 (Table 3).
CE
The health benefit of the intervention measured as additional asthma SFDs was significant and equal to 158 gained SFDs over a month per 100 children (Table 3). The cost per SFD was $10, 95% CI–$4 to $46; in other words, gaining 1 additional SFD costs $10 on average. If the indirect costs were not taken into account, then the ICER was equal to $28 per SFD, 95% CI $18 to $75 (Table 3).
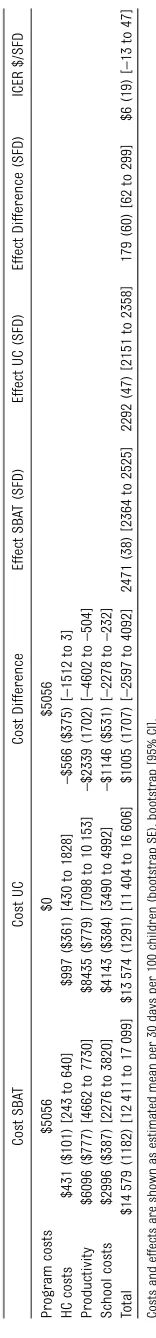
For the children with more severe asthma, the SBAT resulted in additional 1.79 SFDs per month per child (Table 4). The savings were greater for all cate-gories, including HC costs, productivity, and school attendance fees. Because of reduced absenteeism, the SBAT schools could save on average $1146 in lost revenue compared with the UC
group. For the more severe children, TABLE
the ICER was $5.62 per SFD, 95% CI– 12.80 to 46.61, with all costs included.
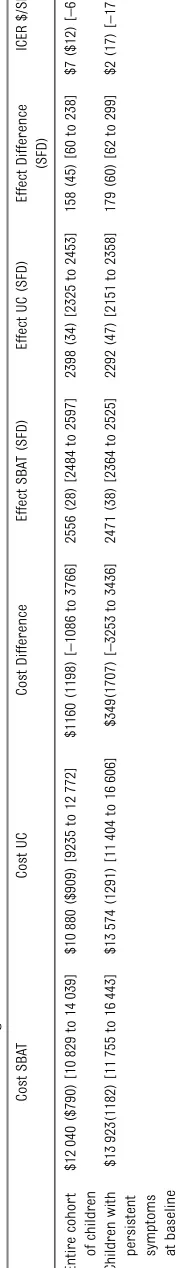
Table 5 presents costs and ICER when we modeled a reduced program cost scenario by excluding the research assistant for symptom screening and associated costs ($422 and $657 cost reduction for all children and chil-dren with more severe symptoms, re-spectively). Under this assumption, with the responsibility for symptom screening transferred to school ad-ministrative personnel (with 100% salary coverage from non– program-related sources), the CE for all chil-dren with asthma and for chilchil-dren with severe persistent asthma at baseline would improve (from $10/SFD to $7/ SFD for all children and from $6/SFD to $2/SFD for more severe children).
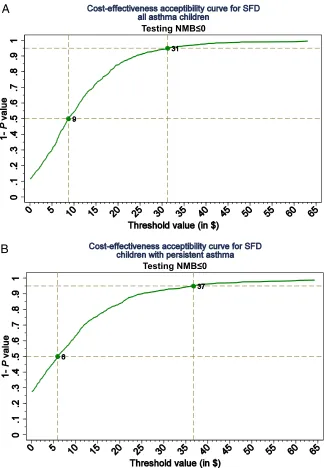
When the value of 1 SFD is valued at $10, the probability of the SBAT being cost-effective for all eligible children was ∼50% (Fig 1). At the value of $31 per SFD, the probability of the SBAT being cost-effective was at the 95% level (Fig 2). For children with persistent symptoms at baseline, the 50% and 95% proba-bility of the SBAT being cost-effective corresponded to the SFD values of $6 and $37, respectively.
DISCUSSION
Our study demonstrates that the SBAT program, at the cost of $10 per 1 extra SFD gained, could be economically ef-fective for children aged 3 to 10 years in a city school district. The cost of run-ning the program summed to $4822 per 100 children and was determined mainly by qualifications and wages of the program personnel. The program resulted in $3240 in savings to the schools (preventing WADA funding loss owing to reduced absenteeism), parents (decreased productivity losses), and HC system (decreased HC costs) per 100 children per year. Limiting the program to children with continued persistent symptoms at the baseline
assessment further improved its CE ($5.60/SFD).
Although none of the other studies took into account productivity costs, our results are nevertheless similar to the studies that evaluated the CE of community-based asthma interventions for children.24,46–48 One of the largest community-based interventions, initiated
as part of the National Collaborative Inner City Asthma Study, employed Master’s-level social workers to deliver a home-based educational intervention to poor urban families.18The authors found an improvement in symp-toms for an additional incremental cost of $9.20 per SFD gained.24 Another home-based environmental
FIGURE 1
intervention carried out at 7 sites across the United States as a part of the Inner-City Asthma Consortium demonstrated benefit at $27.57/SFD.49 A cost-benefit analysis of childhood asthma management through school-based clinic programs supported our
finding that medical savings alone ($1.69 billion for nationwide im-plementation) could not offset the expense of implementing an asthma-prevention program ($4.55 billion). However, when savings due to re-duction of parent opportunity costs and child premature death ($23.13 billion) were considered, the benefit of the program far exceeded its cost.48 Furthermore, studies indicated that poorly controlled asthma has a nega-tive long-term impact on academic achievement through its effect on cognition, school connectedness, and chronic absenteeism, which in turn could contribute to economic losses related to education attainment, crime, and future earnings.28,50
More information is needed to justify whether asthma-prevention programs are cost-saving or whether resulting health benefits are worth addition-al costs. One of the approaches to make this intervention more affordable is to predominantly use resources that are currently available to city schools; however, currently many schools are under substantial financial stress, resulting in fewer resources available.
Our study has several potential limi-tations. Although we made our best effort to differentiate the study-related expenses and services use from the services necessary to run the program in a real school setting, it is unknown whether the effectiveness of the in-tervention could be maintained in a real setting over time. Our cost estimates were sensitive to the type of insurance coverage the children had (Medicaid versus commercial plans) and the type of PCP they have seen (pediatrician versus family physician versus asthma specialist). Further, the original study included an additional home-based smoke reduction component that was not included in the cost analysis or subsequent SBAT studies.51 This de-cision was made based on our primary analysis that demonstrated that the improvement in asthma symptoms in the treatment group was independent of children’s cotinine level.27,51We did, however, control for family smoking status in all analyses.
It is important to note that our study likely provides a conservative estimate of the effectiveness of the SBAT, as children in the UC arm improved more than expected during the course of the study. This may be because of re-gression to the mean (children with significant symptoms at baseline gradually improve over time in-dependent of any intervention), as well as simply from participation in the
study (because monthly calls inquiring about children’s health and symptoms and contact with families and pro-viders may have served as a “weak” intervention to the children in the UC arm).
Although the Panel on Cost-Effectiveness39 recommends using quality-adjusted life years as a standard measure of effectiveness in CE studies, we chose to focus on outcome reporting using natural units, SFDs, which is consistent with the vast majority of other CE studies in asthma. This is thought to be reasonable, as the methods of utility assessment in children are poorly established and disease exacerba-tions affect not only the patient (a child) but family and caregivers as well.24,47,49
Several studies have demonstrated that case-management, self-management, and educational programs for asthma are effective22,52,53but costly, both from the payer and from patient per-spectives, and result in higher drug costs owing to better compliance22and more physician visits for monitoring and education. Studies of prescription medication costs for childhood asthma among minority populations have reported an average expense of∼$300 a year (2011 US$),49much lower than the expected annual costs given the average monthly cost of common inhalers ($187 for fluticasone pro-pionate and $286 for luticasone with salmeterol xinafoate54). Because the burden of childhood asthma dispro-portionally falls on low-income fami-lies, further research is needed to understand whether the cost of medi-cation represents a substantialfi nan-cial barrier to the families, even though a large proportion of affected children are eligible for Medicaid or the State Children’s Health Insurance Program.55 Furthermore, because medication costs were likely to be higher for children participating in the SBAT
FIGURE 2
program compared with children re-ceiving care as usual, the true in-cremental cost per SFD associated with the SBAT program may be higher than we reported here.
CONCLUSIONS
We demonstrated that the SBAT pro-gram could be economically effective
for urban children aged 3 to 10 years
attending school. Our study also dem-onstrates that this population experi-ences substantial economic burden associated with persistent asthma symptoms among children.
REFERENCES
1. Adams PF, Marano MA. Current estimates from the National Health Interview Survey, 1994.Vital Health Stat 10. 1995;(193 pt 1): 1–260
2. Centers for Disease Control and Pre-vention. Surveillance for asthma—US, 1960–1995. CDC Surveillance Summaries. 1995;47:1022–1025
3. National Heart Laboratory.Data Fact Sheet. Asthma Statistics. Bethesda, MD: National Institutes of Health; 1999
4. Centers for Disease Control and Pre-vention. Asthma mortality and hospitaliza-tion among children and adults—United States, 1980–1993. MMWR Morb Mortal Wkly Rep. 1996;45(17):350–353
5. Gergen PJ, Weiss KB. Changing patterns of asthma hospitalization among children: 1979 to 1987. JAMA. 1990;264(13):1688– 1692
6. Akinbami LJ, Schoendorf KC. Trends in childhood asthma: prevalence, health care utilization, and mortality.Pediatrics. 2002; 110(2 pt 1):315–322
7. The Canadian Burden of Illness Study Group. Burden of illness of multiple scle-rosis: part I: cost of illness.Can J Neurol Sci. 1998;25(1):23–30
8. Centers for Disease Control and Pre-vention.Hospital Discharges by First-Listed Diagnosis Among Children. Atlanta, GA: Centers for Disease Control and Pre-vention; 2012
9. Carr W, Zeitel L, Weiss KB. Variations in asthma hospitalizations and deaths in New York City. Am J Public Health. 1992;82(1): 59–65
10. Lang DM, Polansky M. Patterns of asthma mortality in Philadelphia from 1969 to 1991.N Engl J Med. 1994;331(23):1542– 1546
11. Targonski PV, Persky VW, Orris P, Addington W. Trends in asthma mortality among African Americans and whites in Chicago, 1968 through 1991. Am J Public Health. 1994;84 (1830):1833
12. Weiss KB, Wagener DK. Changing patterns of asthma mortality. Identifying target populations at high risk. JAMA. 1990;264 (13):1683–1687
13. Wissow LS, Warshow M, Box J, Baker D. Case management and quality assurance to improve care of inner-city children with asthma. Am J Dis Child. 1988;142(7):748– 752
14. Clark NM, Feldman CH, Evans D, Levison MJ, Wasilewski Y, Mellins RB. The impact of health education on frequency and cost of health care use by low income children with asthma.J Allergy Clin Immunol. 1986; 78(1 pt 1):108–115
15. Taggart VS, Zuckerman AE, Sly RM, et al. You can control asthma: evaluation of an asthma education program for hospitalized inner-city children. Patient Educ Couns. 1991;17(1):35–47
16. Evans D, Mellins R, Lobach K, et al. Im-proving care for minority children with asthma: professional education in public health clinics. Pediatrics. 1997;99(2):157– 164
17. Shields MC, Griffin KW, McNabb WL. The effect of a patient education program on emergency room use for inner-city children with asthma.Am J Public Health. 1990;80 (1):36–38
18. Evans R III, Gergen PJ, Mitchell H, et al. A randomized clinical trial to reduce asthma morbidity among inner-city children: results of the National Cooperative Inner-City Asthma Study. J Pediatr. 1999;135(3): 332–338
19. Hughes DM, McLeod M, Garner B, Goldbloom RB. Controlled trial of a home and ambu-latory program for asthmatic children. Pediatrics. 1991;87(1):54–61
20. Bonner S, Zimmerman BJ, Evans D, Irigoyen M, Resnick D, Mellins RB. An individualized intervention to improve asthma manage-ment among urban Latino and African-American families. J Asthma. 2002;39(2): 167–179
21. Kelly CS, Morrow AL, Shults J, Nakas N, Strope GL, Adelman RD. Outcomes evalua-tion of a comprehensive intervenevalua-tion pro-gram for asthmatic children enrolled in Medicaid. Pediatrics. 2000;105(5):1029– 1035
22. Greineder DK, Loane KC, Parks P. Reduction in resource utilization by an asthma outreach
program.Arch Pediatr Adolesc Med. 1995;149 (4):415–420
23. Madge P, McColl J, Patton J. Impact of a nurse-led home management training program in children admitted to hospital with acute asthma.Thorax. 1997;52(3):223– 238
24. Sullivan SD, Weiss KB, Lynn H, et al; National Cooperative Inner-City Asthma Study (NCI-CAS) Investigators. The cost-effectiveness of an inner-city asthma intervention for chil-dren.J Allergy Clin Immunol. 2002;110(4): 576–581
25. Gerald LB, McClure LA, Mangan JM, et al. Increasing adherence to inhaled steroid therapy among schoolchildren: random-ized, controlled trial of school-based su-pervised asthma therapy.Pediatrics. 2009; 123(2):466–474
26. Millard MW, Johnson PT, McEwen M, et al. A randomized controlled trial using the school for anti-inflammatory therapy in asthma.J Asthma. 2003;40(7):769–776 27. Halterman JS, Szilagyi PG, Fisher SG, et al.
Randomized controlled trial to improve care for urban children with asthma: results of the School-Based Asthma Ther-apy trial.Arch Pediatr Adolesc Med. 2011; 165(3):262–268
28. Halterman JS, Borrelli B, Fisher S, Szilagyi PG, Yoos L. Improving care for urban chil-dren with asthma: design and methods of the School-Based Asthma Therapy (SBAT) trial.J Asthma. 2008;45(4):279–286 29. National Asthma Education and Prevention
Program. NAEPP Expert Panel Report: Guidelines for the Diagnosis and Man-agement of Asthma: Update on Selected Topics 2002. Bethesda, MD: National Heart Lung and Blood Institute, National Insti-tutes of Health; 2002. Publication No. 02-5075
30. National Asthma Education and Prevention Program.Expert Panel Report III: Guidelines for the Diagnosis and Management of Asthma. Bethesda, MD: National Heart, Lung, and Blood Institute, National Institutes of Health; 2007. Publication No. 97-4051 31. LaForce CF, Pearlman DS, Ruff ME. Efficacy
propionate in children with persistent asthma.Ann Allergy Asthma Immunol.2000; 85(5):407–415
32. University of Nevada.Using Average Daily Attendance in Missouri Public Schools. Las Vegas, NV: University of Nevada; 2012 33. Texas Association of School Business Offi
-cials. Average daily attendance. 2012. Avail-able at: www.tasbo.org/files-public/training/ academies/2011%20Business%20Managers %20Academy/1b_charts_and_examples.pdf. Accessed August 21, 2012
34. Texas Education Agency.Funding of Texas Public Schools. 2012 Austin, TX
35. The State Education Department. Analysis of schoolfinances in New York State school district. 2002. Available at: www.oms.nysed. gov/faru/Analysis/00-01/htmlversion/ analysisof_school_finances_00-01.htm. Ac-cessed August 21, 2012
36. ChalkBoard Project. Using Average Daily Attendance as a Basis for Distributing State School Revenue. Salem, OR: Oregon State Department of Education; 2012 37. US Department of Labor Bureau of Labor
Statistics. Consumer Price Index History. Washington, DC: Bureau of Labor Statistics; 2012
38. AHRQ.Medical Expenditures Panel Survey. Rockville, MD: Agency for Healthcare Re-search and Quality (AHRQ);2012
39. Gold MR, Siegel J, Russell L, Weinstein MC. Cost-effectiveness in Health and Medicine. New York, NY: Oxford University Press; 1996
40. Drummond MF, Sculpher M, Torrance GW, O’Brien BJ, Stoddart G. Methods for the Economic Evaluation of Health Care Pro-grammes. 3rd ed. New York, NY: Oxford University Press; 2005
41. Efron B, Tibshirani R. Bootstrap methods for standard errors, confidence intervals, and other measures of statistical accuracy. Stat Sci. 1986;1(1):54–75
42. Briggs AH. Handling uncertainty in cost-effectiveness models. Pharmacoeco-nomics. 2000;17(5):479–500
43. Claxton K, Sculpher M, McCabe C, et al. Probabilistic sensitivity analysis for NICE technology assessment: not an optional extra.Health Econ. 2005;14(4):339–347 44. Fenwick E, O’Brien BJ, Briggs A.
Cost-effectiveness acceptability curves—facts, fallacies and frequently asked questions. Health Econ. 2004;13(5):405–415
45. O’Brien BJ, Briggs AH. Analysis of un-certainty in health care cost-effectiveness studies: an introduction to statistical issues and methods. Stat Methods Med Res. 2002;11(6):455–468
46. Weiss KB, Sullivan SD, Lyttle CS. Trends in the cost of illness for asthma in the United States, 1985–1994.J Allergy Clin Immunol. 2000;106(3):493–499
47. Rutten-van Mölken MPMH, Van Doorslaer EKA, Jansen MCC, Kerstjens HAM, Rutten FFH. Costs and effects of inhaled cortico-steroids and bronchodilators in asthma and
chronic obstructive pulmonary disease.Am J Respir Crit Care Med. 1995;151(4):975–982 48. Tai T, Bame SI. Cost-benefit analysis of childhood asthma management through school-based clinic programs. J Commu-nity Health. 2011;36(2):253–260
49. Kattan M, Stearns SC, Crain EF, et al. Cost-effectiveness of a home-based environ-mental intervention for inner-city children with asthma.J Allergy Clin Immunol. 2005; 116(5):1058–1063
50. Basch CE. Asthma and the achievement gap among urban minority youth.J Sch Health. 2011;81(10):606–613
51. Halterman JS, Sauer J, Fagnano M, et al. Working toward a sustainable system of asthma care: development of the School-Based Preventive Asthma Care Technology (SB-PACT) trial. J Asthma. 2012;49(4):395– 400
52. Liljas B, Lahdensuo A. Is asthma self-management cost-effective? Patient Educ Couns. 1997;32(suppl 1):S97–S104 53. Greineder DK, Loane KC, Parks P. A
ran-domized controlled trial of a pediatric asthma outreach program. J Allergy Clin Immunol. 1999;103(3 pt 1):436–440 54. New York State Department of Health.
Pharmacy Pricelist. Albany, NY: New York State Department of Health; 2012 55. Carlson A, Nesvold JH, Liu A.
Population-based assessment of asthma symptom burden in children.J Urban Health. 2011;88 (suppl 1):164–173
(Continued fromfirst page)
PEDIATRICS (ISSN Numbers: Print, 0031-4005; Online, 1098-4275).
Copyright © 2013 by the American Academy of Pediatrics
FINANCIAL DISCLOSURE:The authors have indicated they have nofinancial relationships relevant to this article to disclose.
FUNDING:Funded by a grant from the National Heart, Lung, and Blood Institute of the National Institutes of Health (R01HL079954). Dr Noyes was supported in part
DOI: 10.1542/peds.2012-1883 originally published online February 11, 2013;
2013;131;e709
Pediatrics
Halterman
Katia Noyes, Alina Bajorska, Susan Fisher, Joseph Sauer, Maria Fagnano and Jill S.
Cost-Effectiveness of the School-Based Asthma Therapy (SBAT) Program
Services
Updated Information &
http://pediatrics.aappublications.org/content/131/3/e709 including high resolution figures, can be found at:
References
http://pediatrics.aappublications.org/content/131/3/e709#BIBL This article cites 38 articles, 6 of which you can access for free at:
Permissions & Licensing
http://www.aappublications.org/site/misc/Permissions.xhtml in its entirety can be found online at:
Information about reproducing this article in parts (figures, tables) or
Reprints
DOI: 10.1542/peds.2012-1883 originally published online February 11, 2013;
2013;131;e709
Pediatrics
http://pediatrics.aappublications.org/content/131/3/e709
located on the World Wide Web at:
The online version of this article, along with updated information and services, is
by the American Academy of Pediatrics. All rights reserved. Print ISSN: 1073-0397.