DATA MINING ANALYSIS TO DRAW UP DATA SETS
BASED ON AGGREGATIONS
Paparao Golusu
1, Nagul Shaik
2 1M. Tech Scholar (CSE), Nalanda Institute of Tech, (NIT), Siddharth Nagar, Guntur, A.P, (India)
2
Assistant Professor, Nalanda Institute of Technology (NIT), Siddharth Nagar, Guntur, A.P, (India)
ABSTRACT
Data mining is very important in day to day life and data mining purely depends on the data sets. Data sets are
those which help application or user to sort out the data and use only the related one from the huge data. For
creating datasets we need to use complex queries in sql which in turn increases load on database with the
connection. Here we are trying to retrieve data in horizontal row layout which actually returns set of data
instead only a specific number, which is termed as horizontal aggregations. In our proposed work we study
about the different data mining queries and their efficiency for creating datasets that will be helpful to refine the
data. The Data mining queries are CASE, SPJ and PIVOT. All these three have different roles and
responsibilities in their way of data mining. Various experimental setups are done using these data mining
queries for the horizontal aggregated data in sql.
Keywords
:
Aggregation, Case, SPJ, Pivot, Data Mining
.
I.
INTRODUCTION
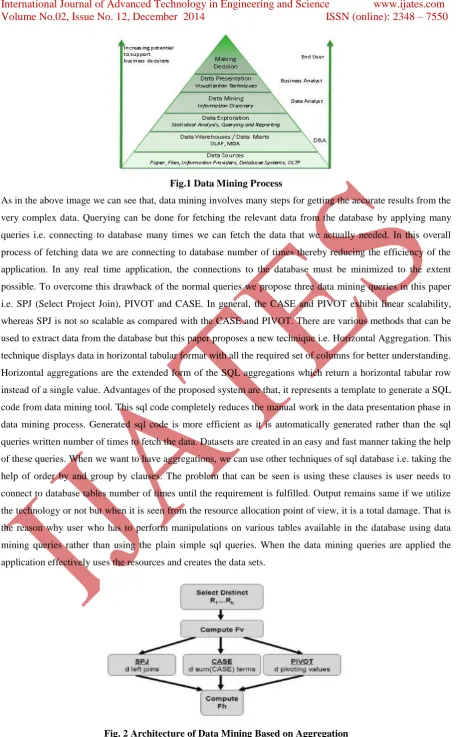
Fig.1 Data Mining Process
As in the above image we can see that, data mining involves many steps for getting the accurate results from the very complex data. Querying can be done for fetching the relevant data from the database by applying many queries i.e. connecting to database many times we can fetch the data that we actually needed. In this overall process of fetching data we are connecting to database number of times thereby reducing the efficiency of the application. In any real time application, the connections to the database must be minimized to the extent possible. To overcome this drawback of the normal queries we propose three data mining queries in this paper i.e. SPJ (Select Project Join), PIVOT and CASE. In general, the CASE and PIVOT exhibit linear scalability, whereas SPJ is not so scalable as compared with the CASE and PIVOT. There are various methods that can be used to extract data from the database but this paper proposes a new technique i.e. Horizontal Aggregation. This technique displays data in horizontal tabular format with all the required set of columns for better understanding. Horizontal aggregations are the extended form of the SQL aggregations which return a horizontal tabular row instead of a single value. Advantages of the proposed system are that, it represents a template to generate a SQL code from data mining tool. This sql code completely reduces the manual work in the data presentation phase in data mining process. Generated sql code is more efficient as it is automatically generated rather than the sql queries written number of times to fetch the data. Datasets are created in an easy and fast manner taking the help of these queries. When we want to have aggregations, we can use other techniques of sql database i.e. taking the help of order by and group by clauses. The problem that can be seen is using these clauses is user needs to connect to database tables number of times until the requirement is fulfilled. Output remains same if we utilize the technology or not but when it is seen from the resource allocation point of view, it is a total damage. That is the reason why user who has to perform manipulations on various tables available in the database using data mining queries rather than using the plain simple sql queries. When the data mining queries are applied the application effectively uses the resources and creates the data sets.
As we can see in the above block diagram that the process initially takes the data as a request which we can generally call it as user request. Later the data or request which came in from the user is manipulated and then accordingly the data sets are created based upon the available methods i.e. CASE, SPJ and PIVOT. Consider a small example to understand the implementation process in an easier manner. Consider a locality with one sub-station office that is serving near about 100 houses. So if we consider it application wise, there is one admin who takes care of the complete locality through online. Once at the end of the year, admin wanted to know the details of a specific customer and in the backend all the details of the customer are segregated. It becomes difficult to fetch the data at a time, so the developer needs to write many queries depending on the user requirement. To overcome this drawback, data mining queries are employed which in turn creates datasets. The data specifically doesn’t correspond to admin; it could be user also who actually wants to know their yearlong status in a simple manner.
II.
RELATED
WORK
Our implementation will have a user interface which a user will be given an option to select the fields from the available options and based upon the user selection, application will generate the sql code depending upon the data mining view selected by the user. We have three views that are made available to the user i.e. CASE, PIVOT and SPJ. CASE is an operator that will be utilized in the sql queries; similarly SPJ and PIVOT will be used to fetch the results as per the definitions given by the operators. One thing is very clear between the normal query and data mining operator employed query i.e. the query size differs. Queries with normal operators like select, update, delete are small and also queries involving the keywords order by will not have much effect in the size. Only when the operators belonging to the aggregations the size of the query is long but the result fetched is comparatively far better and thus reduces the overhead process on the database thereby increasing the efficiency of the application and giving appropriate results as expected by the user. CASE operator can be used with all the combinations i.e. it can be used with the select query, can be used with the order by clause, can be used with update statement, can be used with set statement, and can also be used in the query with having clause. SQL query written taking the order by operator into count gives the result in the sorted manner as written by the programmer putting user in perspective. We also have other operator which works similar to that of order by i.e. group by, this operator groups all the items belonging to the similar kind and thereby making it easy for the user to understand the process with the output shown. The query appears in the below form when the group by operator is used, Select name from register group by users; In the above written query we can see that the query clearly makes us understand the intension behind it, it means to say that the user is trying to group the names from the register table. Grouping will be done only because of the operator used in the query. In case if we want to modify the search and want to produce results those are to be shown in a systematic manner then we need to employ order by operator. Thus with this we can understand the usage of the various operators in the sql queries. Similarly, case operator can be used and this operator involves condition checking while fetching the data from the database. Data mining queries implemented in our proposed work are written below,
To understand the implementation, consider the example of same electricity department. CASE Query,
may,sum(case when month='jun' then paidamt else null end ) jun,sum(case when month='jul' then paidamt else null end)jul,sum(case when month='aug' then paidamt else null end)aug,sum(case when month='sep' then paidamt else null end)sep,sum(case when month='oct' then paidamt else null end)oct,sum(case when month='nov' then paidamt else null end)nov,sum(case when month='dec' then paidamt else null end ) dec from tblpayment group by meterid” In the above written query we can see that case query is involving various condition checks and at last we can see that the result is segregated using the keyword group by. In Oracle 10g XE, Pivot operator is not directly made available for the users. Pivot in actual says that fetching of relevant data from the very complex data. This functionality is shown in the implementation taking the help of sql queries. In the new version of Oracle i.e. Oracle 11g, pivot operator is made available for the users to mine the data in an efficient manner. Coming with the spj in SQL, it helps users input data from more than one table and display results as required by the third party to have a simplified look and moreover gives better results to the end user. For understanding consider the below written query to mine the data from two different tables for better understanding. “select registration2.meterid ,tblpayment.month,updatebills.paidamt from registration2 left outer join tblpayment on registration2.meterid=tblpayment.meterid left outer join updatebills on registration2.meterid=updatebills.meterid” In the above written query, registration2 and tblpayment are two different tables from which the data is retrieved to make user understand the complex data in easy manner. It can be understood that first table is a kind of reference where user details are taken and based on that, payment details are fetched to have a clear idea on a specific meter id. From the above written queries it is very clear that the operation is very simple but the queries written are complex. It must be understood that using the data mining queries user will connect to database only once and perform the action but if its non data mining operation, user will connect to database number of times and perform the action. Drawback is that there is a possibility of the connection reset with database when more number of times we connect to database and this could be a big damage to organization as their clients will not be able to retrieve the information they actually wanted. So each and every developer needs to take care about the resources being utilized as the application need to be flexible and user friendly. Moreover it must support any type of action.
III.
CONCLUSIONS
Our proposed model gives better reliability and performance when compared to the normal SQL operations. Thus we can say that aggregations in sql helps the application to be more flexible for the user input as it connects to the database at a single instance and creates datasets which will give information to user about the complex data in easy manner. Aggregations in database studied in this work are CASE, SPJ and PIVOT; all three have their own significance in their way.
IV.
ACKNOWLEDGMENT
The heading of the Acknowledgment section and the References section must not be numbered.
Causal Productions wishes to acknowledge Michael Shell and other contributors for developing and maintaining the IEEE LaTeX style files which have been used in the preparation of this template. To see the list of contributors, please refer to the top of file IEEETran.cls in the IEEE LaTeX distribution.
REFERENCES
[2] J. Breckling, Ed., The Analysis of Directional Time Series: Applications to Wind Speed and Direction, ser. Lecture Notes in Statistics. Berlin, Germany: Springer, 1989, vol. 61.
[3] S. Zhang, C. Zhu, J. K. O. Sin, and P. K. T. Mok, “A novel ultrathin elevated channel low-temperature poly-Si TFT,” IEEE Electron Device Lett., vol. 20, pp. 569–571, Nov. 1999.
[4] M. Wegmuller, J. P. von der Weid, P. Oberson, and N. Gisin, “High resolution fiber distributed measurements with coherent OFDR,” in Proc. ECOC’00, 2000, paper 11.3.4, p. 109.
[5] R. E. Sorace, V. S. Reinhardt, and S. A. Vaughn, “High-speed digital-to-RF converter,” U.S. Patent 5 668 842, Sept. 16, 1997.
[6] (2002) The IEEE website. [Online]. Available: http://www.ieee.org/
[7] M. Shell. (2002) IEEEtran homepage on CTAN. [Online]. Available: http://www.ctan.org/tex-hive/macros/latex/contrib/supported/IEEEtran/
[8] FLEXChip Signal Processor (MC68175/D), Motorola, 1996.
[9] “PDCA12-70 data sheet,” Opto Speed SA, Mezzovico, Switzerland.
[10] A. Karnik, “Performance of TCP congestion control with rate feedback: TCP/ABR and rate adaptive TCP/IP,” M. Eng. thesis, Indian Institute of Science, Bangalore, India, Jan. 1999.
AUTHOR
DETAILS
Paparao Golusu is currently pursuing M.Tech in the Department of Computer
Science & Engineering, from Nalanda Institute of Technology (NIT), siddharth Nagar, Kantepudi(V), Sattenapalli (M), Guntur (D), Andhra Pradesh , Affiliated to JNTU-KAKINADA.
Nagul Shaik working as Assistant Professor at Nalanda Institute of Technology