R E S E A R C H
Open Access
Resolving spatial inconsistencies in
chromosome conformation measurements
Geet Duggal
1, Rob Patro
1, Emre Sefer
1, Hao Wang
1, Darya Filippova
1, Samir Khuller
2and Carl Kingsford
1*Abstract
Background: Chromosome structure is closely related to its function and Chromosome Conformation Capture (3C) is a widely used technique for exploring spatial properties of chromosomes. 3C interaction frequencies are usually associated with spatial distances. However, the raw data from 3C experiments is an aggregation of interactions from many cells, and the spatial distances of any given interaction are uncertain.
Results: We introduce a new method for filtering 3C interactions that selects subsets of interactions that obey metric constraints of various strictness. We demonstrate that, although the problem is computationally hard, near-optimal results are often attainable in practice using well-designed heuristics and approximation algorithms. Further, we show that, compared with a standard technique, this metric filtering approach leads to (a) subgraphs with higher statistical significance, (b) lower embedding error, (c) lower sensitivity to initial conditions of the embedding algorithm, and (d) structures with better agreement with light microscopy measurements. Our filtering scheme is applicable for a strict frequency-to-distance mapping and a more relaxed mapping from frequency to a range of distances.
Conclusions: Our filtering method for 3C data considers both metric consistency and statistical confidence simultaneously resulting in lower-error embeddings that are biologically more plausible.
Keywords: 3C, Chromosome conformation capture, Metric violations, Triangle inequality, Graph embedding
Background
Chromosome conformation capture (3C) is an experi-mental technique designed to observe how the genome folds in a cell [1]. Measurements from 3C experiments have been used to construct three-dimensional models of chromosomes at a higher resolution than what is possible with light microscopy [2], and these models are correlated with long-range regulation [3], chromatin accessibility [4], as well as cancer-related genome alterations [5]. Since its introduction, the 3C technique has become widely adopted and has been applied to bacterial, yeast, fruit fly, and human genomes [3,6-13].
Measured interactions between genomic locations are aggregated into a chromosome conformation graph. The frequency of an interaction between a particular pair of genomic locations in the assayed population of cells can be converted to a distance, and this mapping allows the graph
*Correspondence: [email protected]
1Lane Center for Computational Biology, School of Computer Science, Carnegie Mellon University, Pittsburgh, PA 15213, USA
Full list of author information is available at the end of the article
to be embedded in three dimensions. Before embedding, interactions in 3C graphs are usually filtered so that only interactions with unusually high frequencies given their genomic distance are kept. For example, contact matrices normalize the observed frequency of an interaction within a chromosome by the expected frequency within an entire genome (e.g. [4,14]) while others more explicitly model the distribution of interaction frequencies (e.g. [3,6]). In this sense, traditional statistical filtering methods retain high-confidence interactions.
However, because 3C measurements are aggregated over millions of cells, the distances associated with these high-confidence interactions are often metrically incon-sistent. For example, among 2,257,241,015 triplets of mea-surements that form triangles in the yeast 3C data of Duan et al. [6], 679,480,886 (30%) do not satisfy the tri-angle inequality. These inconsistencies make it difficult to reason about conformational properties of the genome. Further, existing filtering procedures do not use relation-ships between the edges to, for example, discard high-confidence edges that are apparently inconsistent with many lower-confidence edges, or to include seemingly
low-confidence edges that are nonetheless consistent with many others.
To address these shortcomings, we introduce the idea of metric filtering where we seek a high-confidence met-rically consistent subset of the 3C graph. We frame the procedure as a family of optimization problems where we want to find a subgraph of high total weight (confidence) such that the set of chosen edges satisfies metric con-straints of various stringency. We show that this family of problems, like embeddability inR3[15], is NP-hard, and provide four algorithms for the approximate solution of the least and most stringent versions.
We apply the metric filtering algorithms to 4C measure-ments for budding yeast [6] and show that the heuristics are able to find near-optimal solutions to the variant of the problem where only triangles are consistent. Despite the additional metric constraints, the selected set of edges is often of higher total confidence than the data set con-sidered in Duan et al. [6] that had an estimated 1% false discovery rate (FDR).
We show that embeddings based on these filterings have lower embedding error than those based on an existing filtering technique [6]. The structures also exhibit lower variation when different initial conditions are chosen for a previously proposed non-linear optimization embed-ding technique. Finally, we provide anecdotal evidence that the structure resulting from the metrically filtered interactions is in better agreement with known biology than the structure derived using standard filtering tech-niques. The improved agreement is a result of the metric filtering being able to include longer-distance, but lower-confidence, interactions.
Problem definition
Problem 1(Consistent-k-Paths).Given an inte-ger k ≥ 2, and a graph G = (V,E), where each edge e ∈ E is associated with a non-negative lengthd(e)and a positive rewardr(e), find a subsetS ⊆ Eof edges that maximizesR(S) = e∈Sr(e)and such that, for alle ∈ S and for any pathPke inGofkor fewer edges inSjoining the endpoints ofe, the following condition holds:
e∈Pke
d(e)≥d(e). (1)
In other words, we seek the highesttotal reward sub-graph where the length of every chosen edge is shorter than any path ofkor fewer hops joining the endpoints of that edge. If an edge satisfies condition (1) for a givenk, we say it isk-consistent, or simplyconsistentifkis clear from the context. If the edge is not consistent, it isviolated.
Consistent-k-Paths is a family of problems
parameterized byk. The value ofk allows the strictness of the metric condition to be varied. To obtain an idea as
to how relatively stringent the filterings are, we focus on the two extreme cases ofk = 2 andk = |V| −1. The strictest condition isk= |V| −1, when every alternative path must be at least as long as the direct edge connecting the endpoints of the path, while the most lenient condition isk=2, where consistency is only enforced for triangles. Because of their importance, we give names to these two special cases.
Definition 1(ConsT).ConsTis an instance of Con-sistent-k-Pathswithk =2, i.e. every triangle must satisfy inequality (1).
Definition 2(ConsP).ConsPis an instance of Con-sistent-k-Pathswithk = |V| −1 implying that all paths are consistent.
TheConsTformulation (and any formulation withk< |V| −1) is motivated by the fact that each measured dis-tance is associated with some uncertainty that propagates when summing distances over longer paths. TheConsP property is more strict, requiring all paths to be con-sistent, but it suffers from the propogation of errors as distances are summed over large paths.
NP-Hardness ofConsistent-k-Paths
Theorem 1. Consistent-k-Paths is NP-hard for k>1.
Proof. Reduction fromIndependent Set: given∈
Z≥0and a graphG=(V,E), construct a graphH=(V∪ {u},E∪E)as follows. Letd(e) = r(e) = 3 for alle∈ E. Create a new vertexu, and a new set of edgesE= {{u,v} | v∈V}. Setd(e)=r(e)=1 for alle∈E. We show thatG has an independent set of size≥ ⇐⇒ Hhas a solution of total rewardR≥3|E| +. Note that a violating path in H contains exactly 2 edges and, along with the violated edge, forms a triangle. This is because every edge inHhas d≥1, so that every path containing 3 or more edges will have a totald ≥ 3. Such a path is as long as any edge inH, and hence can violate no edge. It follows that this reduction applies for allk≥2.
=⇒ Let S ⊆ V be an independent set of size≥ . Choose all edges ofEand the edgesES= {{u,w} |w∈S}.
The total reward of this set isR=3|E| + |S| ≥3|E| +. Since all of the edges inE haved = 3, all 2-hop paths formed by these edges have d = 6 and do not violate eq. (1). Further, sinceSis an independent set, no triangle involving uis selected. Therefore, the graph induced by the selected set of edges,E∪ES, is consistent.
⇐= Assume E∗ is a solution to the
Due to the following argument, we assume, without loss of generality, that all edges ofGare chosen: Suppose a pair of edges{u,v}and{u,w}was chosen and edge{v,w}exists in Ebut was not chosen. Then we can remove{u,v}and add
{v,w}. This is still a solution with reward≥3|E| +, since the swap only increases the value of the solution. Repeated application of this will produce a solution of cost≥3|E|+
that includes all ofE.
In the transformed solution, the edges ofE contribute a reward of 3|E|. Further, to avoid violating edges, the endpoints of selected edges adjacent tou must form an independent set, and to achieve a total rewardR≥3|E| + , there must have been an independent set size≥.
Corollary 1.Consistent-k-Paths restricted to r(e)=1 for alle∈Eis NP-hard fork>1.
Proof.Apply the same reduction as above, except that r(e) = 1 instead of 3 for alle ∈ E, and using a total reward threshold ofE∗ ≥ |E| +instead of 3|E| +. In the new formulation,E∗ might include two edges{u,w} and{u,v} without picking {v,w} ∈ E if it exists. How-ever, any such solution can be transformed into one of the form above with equal cost by removing {u,w} and adding{v,w}. This neither changes the number of edges nor decreases the total reward ofE∗, and the proof can proceed as in Theorem 1.
Algorithms
SinceConsTandConsPare NP-hard, it is unlikely that there exist algorithms that solve these problems in polyno-mial time. Thus, we have developed several approximation algorithms and heuristics to tackle them in practice. We present five algorithms below; the first three apply to the ConsTproblem while the latter two apply to theConsP problem.
A set-cover-based algorithm
We formulate ConsT as a minimum weight set cover
problem by removing the lowest weight set of edges that restores consistency, and therefore maximizes the weight of the remaining graph (the complement of the origi-nal problem). Let ¯ be the set of violated triangles in G (where a triangle is violated if it does not obey the triangle inequality). For edge {u,v} in E, let Suv be the
subset of triangles in¯ that contain{u,v}, and letC =
{Suvfor all{u,v} ∈ E}. Define the costc(Suv) = r({u,v}).
We then seek the smallest weight collection of setsSuv
that cover all the violated triangles¯, a direct application of minimum-weight set cover. Removing the edges cor-responding to each chosen subsetSuv will resolve all of
the violated triangles. This problem can be approximated using either an LP relaxation or a greedy algorithm [16]. Note that, since each violated triangle belongs to at most
3 sets of the collectionC, there is an algorithm that finds a solution to this SET-COVERinstance with a cost no more than 3 times OPT [16]. For the experiments described here, we use the greedy algorithm. There exist exact algo-rithms for the related hitting set problem [17], but these are only efficient when the number of edges that need to be removed is small, which is not what we observe in the 3C data we analyze.
A hierarchical maximum cut approach
Another approach to solveConsTuses a solution to the MAX-CUTproblem to find a maximum weight (i.e. max-imum total reward) cut-set E separating vertices of G into V1 and V2. Because E is bipartite, it will have no triangles, and thus, no violated triangles. The LOCAL -CUT algorithm [18] guarantees that E has at least 1/2 the total reward ofG. Therefore, this algorithm is a 1/ 2-approximation toConsT. We add all edges inE to the growing solution set E∗. Then, for every pair of edges
{u,v},{u,w} inE, if there is an edge{v,w} ∈ E\E that forms a violated triangle, we remove{v,w} fromG, and we recursively apply this procedure to the two partitions induced by the maximum cut. Because the subgraphs induced byV1andV2only contain the set of edges that form non-violating triangles with the edges in E, the constructed solution contains no triangle violations.
Integer linear program
The ConsT problem can be expressed succinctly as an integer linear program (ILP), mirroring a standard ILP for set cover:
maximize
e∈E
xer(e) (2)
subj. toxe1+xe2 +xe3 ≤2 for{e1,e2,e3} ∈ ¯
xe∈ {0, 1} (3)
where ¯ are the set of metrically inconsistent triangles inG. Of course, (2) is computationally difficult to solve. However, by relaxing the condition in eq. (3) to 0 ≤ xe ≤ 1, we obtain a linear program which can be solved
efficiently and whose objective provides an upper bound on total confidence of the optimal metrically consistent solution.
Taking the union of shortest paths
LetPuvbe the set of edges in all shortest paths (according
tod) going from nodeuto nodevinG=(V,E). A feasible solution toConsPis to take the edges in{u,v}∈EPuv. We
fact that{u,v}belongs to some shortest path, because we could replace{u,v}withpand shorten this path.
Unfortunately, there may be an exponential number of shortest paths in G. However, by removing from E all edges that are not part of some shortest path, we can obtain the desired set of edges without explicitly enu-merating all shortest paths. The SP-UNIONheuristic first computes, for every edge {u,v} ∈ E, the length of the shortest path between its endpoints,d(spu,v). Then, the solution is simply given byE∗=E\{{u,v} ∈E|d(spu,v) < d(u,v)}.
Maximum spanning tree heuristic
The final heuristic, MST-ADD, first constructs a
maximum-reward spanning tree T = (V,ET) on
G = (V,E)and adds its edges toE∗. This can be com-puted using any standard maximum-weight spanning tree algorithm. By construction, T has a high total reward. Since it is a tree, it contains no cycles, and hence no violations. We sort the remaining edgesE\ET by their
reward and, iterating through them in descending order, add them toE∗if they do not violate any shortest paths in the growingE∗.
Metric filtering with uncertain distances
InConsTandConsP, we assume that every observed fre-quencyf(e)maps to a single spatial distance. However, it is more plausible that an observed frequency maps to a range of distances. In this case, we suppose that there is a range of distances [l(e),u(e)] wherel(e)andu(e) repre-sent the lower and upper bounds of all valid distances to which the frequencyf(e)of edgeecan map.
Given such a range for every edge e, the new con-dition for metric consistency (previously inequality (1)) becomes:
e∈Pke
u(e)≥l(e). (4)
This allows distances assigned to the edges to be “flex-ible,” and they can be extended or contracted within the range’s bounds to satisfy the new metric consistency con-dition (4). An edgeeisviolatedonly if, for some path of kor fewer hops connecting the endpoints ofe, the sum of the upper bounds of the distances for edgesein this path is less than the lower bound of the distance range fore.
All of our algorithms can be modified in a straighfor-ward way to use this relaxed definition of metric consis-tency. Now, the SET-COVER algorithm need only cover triangles that are violated according to (4). In the MAX -CUT algorithm, we need only remove edges from the left and right bipartition that form triangles involving cut edges that are violated under the new definition. When computing the set of shortest paths (SP-UNION) and the
maximum-reward spanning tree (MST-ADD), the short-est path lengths are now computed usingu(e)and, to test whether any edgeeis violated, these lengths are compared tol(e).
Computational results
Weights for 3C interactions in budding yeast
We use the measurements from Duan et al. [6], who used a 3C variant called 4C to assay interactions for the entire S. cerevisiae genome during interphase with two exper-iments based on the HindIII MseI and MspI restriction enzymes. In total, Duan et al. measured 4, 097, 539 inter-actions across 4, 193 genome fragments (nodes). Each of these interactions e is associated with a frequency f(e) — the number of times it was observed. Duan et al. process these raw frequency counts to derive several other measures for each interaction. A spatial distance d(e), which we use as the edge length in condition (1), is assigned to every interaction using a frequency-to-distance mapping based on the observed inverse rela-tionship between genomic separation and frequency for intra-chromosomal interactions. Such a distance mapping is common to most approaches that seek embeddings of 3C data [3,6,10,19]. Because the distance mapping is based on intra-chromosomal interactions, we have more confi-dence in the spatial distancesd(e)for interactions within a chromosome. Therefore, in most of the experiments below, we consider each chromosome individually. Table 1 gives the sizes of the graphs for each chromosome of yeast.
Table 1 Sizes of yeast chromosome conformation graphs
Chr |V| |E|
1 54 1046
2 311 31600
3 100 3738
4 521 86126
5 184 11243
6 92 3050
7 404 52224
8 192 13226
9 149 7738
10 257 2234
11 253 20232
12 361 38052
13 331 36792
14 283 26531
15 368 43807
16 333 37054
Duan et al. also compute a p-value for every e. Using these p-values, they further derive a “q-value” that accounts for multiple hypothesis testing caused by the large number of edges sampled. See the “Computa-tional methods” of the supplementary material of Duan et al. for a description of how the q-values are puted. We reproduced their p-value and q-value com-putations and use r(e) = 1 − q(e) as the reward for including an edge in the solution in condition (1). The value 1 − q(e) is a measure of confidence: high val-ues indicate low p-valval-ues, which indicate that interac-tions occur with a frequency that one would not expect by chance.
The input to the filtering procedures is thus the graph G= (V,E)whereV is a set of restriction fragments and Eis the set of interactions. The distance on an edgeeis d(e) and the reward on an edge is the confidence r(e). The goal of metric filtering is to find a subgraph with high confidence (i.e. generally low p-values) with no metric violations as defined by condition (1).
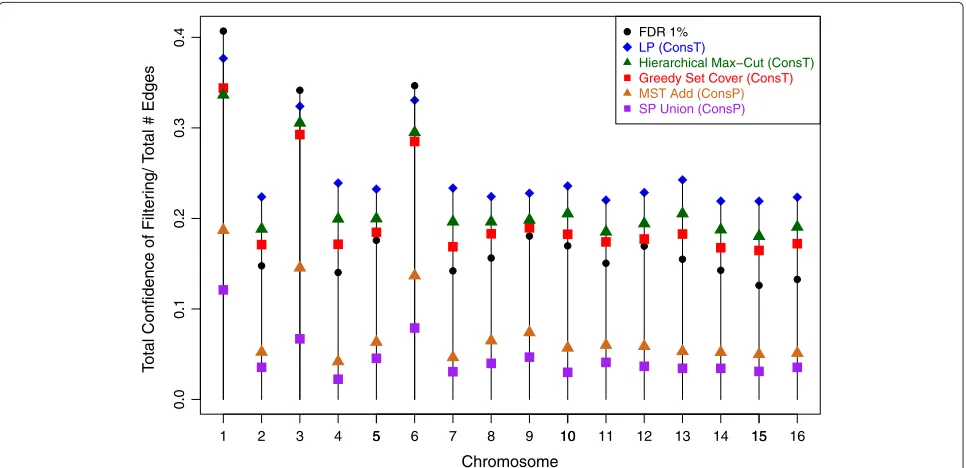
Ability of the algorithms to find high-weight subgraphs The heuristics of the Algorithms section were tested on each of the 16 yeast chromosomes, and Figure 1 sum-marizes the algorithms’ ability to find high-confidence solutions. In 15 out of 16 cases, MAX-CUTfinds aConsT subgraph with the largest total confidence (Figure 1, green
triangles). However, in all 16 chromosomes, the SET -COVERmethod finds a graph of nearly the same quality, indicating that this method is competitive in terms of its ability to optimize the objective function.
The ConsT subgraphs have similar—and usually
higher—total confidence than FDR 1% while eliminating all violated triangles (compare black circles with green tri-angles and red squares in Figure 1). The set of interactions at FDR at 100q% is the set of edges originally considered by Duan et al. withq < q. Both SET-COVERand MAX -CUTachieve total confidence that is higher than the Duan et al. FDR 1% filtering for all but the smallest chromo-somes (1, 3, and 6). Even in those cases, SET-COVERand MAX-CUTsolutions are no more than 25% away from the FDR 1% total confidence.
Due to the NP-hardness of the problems, optimal solu-tions forConsTandConsPare difficult to obtain. How-ever, theConsTproblem can be expressed as an integer linear program (2). While this ILP is also difficult to solve, its linear relaxation is solvable in practice and provides a provable upper bound on the value of the optimal solu-tion, shown as blue diamonds in Figure 1. This bound reveals that the SET-COVER and MAX-CUT approaches find solutions that are close to optimal. Experiments on all chromosomes achieve total confidence values that are at least 70% of the linear program upper bound, and four cases achieve total confidence of around 90% of the upper
5 10 15
0.0
0.1
0.2
0.3
0.4
Chromosome
T
otal Confidence of Filter
ing/ T
otal # Edges
1 2 3 4 5 6 7 8 9 10 11 12 13 14 15 16
FDR 1%
LP (ConsT)
Hierarchical Max−Cut (ConsT) Greedy Set Cover (ConsT)
MST Add (ConsP) SP Union (ConsP)
bound. Since the LP overestimates the optimal value, it is likely that the heuristics provide solutions that are much closer than 70% of the true optimal solution.
The algorithms forConsP(MST-ADDand SP-UNION) find graphs with far fewer edges and far lower total con-fidence than any of the solutions for ConsT(Figure 1), and they sacrifice a significant proportion of the total con-fidence to obtain a completely metric subgraph. This is a strong indication of how much more strict theConsP condition is compared withConsT. In addition, the SP-UNIONalgorithm performed worse then MST-ADD. The severe condition required byConsPis likely too strict for the noisy 3C data, andConsTprovides a more reasonable trade-off between avoiding metric violations and keeping a useful fraction of the interactions.
Metric filtering produces lower-error embeddings
The ConsTand ConsP filterings both result in lower-error embeddings than their associated confidence-ranked filterings when embedded using a nonlinear opti-mization technique. To control for the size of filterings we compare a metric filtering with minteractions to an associated set of the m highest confidence interactions (C-RANK). The embedding attempts to place nodes to minimize the sum-squared error ofe∈E(o(e)−d(e))2
between the original d(e) and the embedded o(e) dis-tance. The SET-COVERfiltering of chromosome 1 resulted in a mean sum-squared error of 0.97 across 10 embed-dings while C-RANKresulted in an error of 1.58. Similarly, MST-ADDhad an average error of 0.067 while C-RANK produced an error of 0.39. Our improved performance may be due to the fact that metric violations result in distance contradictions that cannot be resolved by the optimization procedure.
To confirm the hypothesis that metric violations cause increased errors in the embeddings, we systematically re-introduced violated triangles using the following proce-dure. We choose a triangle{u,v,w}at random. Ifd(u,v) < d(u,w), then we setd(u,v) = α|d(v,w)−d(u,w)|. Oth-erwise, we set d(u,w) = α|d(v,w) −d(u,v)|, for some choice of 0 < α < 1. As the percentage of vio-lated triangles increased, the embedding error increased as well with 1.2, 1.4, 1.6, 2.0, 2.3, 2.8 average error for
10, 20, 30, 40, 50, 60% violated triangles respectively with
α =0.9. Metric filtering therefore has the desirable prop-erty of removing the embedding error that results from the existence of violated triangles.
Metric filtering produces low-variance, more biologically plausible embeddings
We embedded the various sets of filtered constraints for the chromosomes using an established non-linear optimiza-tion technique [6,9] that incorporates chromatin packing constraints consistent with known biology in yeast. We obtained ensembles of structures by providing random initial conditions for our implementation of this optimiza-tion, a technique previously used to study conformational differences between cancer and healthy genomes [3].
Ensembles of 10 embeddings for SET-COVERon chro-mosome 1 are shown in Figure 2a and the ensembles for a non-metric filtering with equal number of edges (obtained by taking the corresponding number of edges with the highest confidence) are in Figure 2b. We focus on observations for chromosome 1, but have observed simi-lar trends for other chromosomes. For each filtering, the embeddings are aligned to each other using a maximum likelihood superpositioning technique [21].
Lower-variance embeddings
Both ConsT (Figure 2) and ConsP filterings produce ensembles of embeddings that are more homogeneous than those from the associated C-RANK sets as indi-cated by the superposition of structures in Figure 2. We can quantify the variance of an ensemble by computing the sum of the branch lengths of a minimum spanning tree of a complete graph where the nodes represent the embedded structures and the edge weights are the RMSD between the alignments of pairs of structures. The min-imum spanning tree on this graph represents a parsimo-nious way to describe the variability among embedded structures. The MST-based variability between the SET -COVERand MST-ADDembeddings of chromosome 1 are 0.17 and 0.0093 respectively while the MST variability of the associated C-RANK embeddings are much larger, at 0.26 and 0.32 respectively.
Low variance among the embeddings of metric sub-graphs indicates that selecting edges for their metric consistency allows fewer highly different solutions to be found. This is desirable, because we do not want embed-dings to be sensitive to the initial conditions of the opti-mization procedure. Further, because they were taken from a population of cells, the 3C measurements are in fact taken from an ensemble of structures. The large vari-ance among C-RANKedges may reflect this fact. In con-trast, the metric filtering appears to be selecting subsets of constraints that could plausibly represent a single struc-ture. Hence, metric filtering may be one way to partially deconvolve the population-averaged measurements.
Biologically plausible embeddings
TheConsTembeddings result in telomere distances that match known microscopy distances better than the asso-ciated C-RANKset. A recent experiment [22] establishes that the distance between the telomeres of chromosome 1 in budding yeast are often about 1μm. The embeddings of C-RANKin Figure 2b have an average distance of 0.45μm while the embeddings of SET-COVER(Figure 2a) have an average distance of 0.96μm, which is a much better match to the experimentally observed value.
Despite having edge sets of the same or larger total con-fidence, the metric filtering produces very different struc-tures than the C-RANKfiltering. However, removing the 71 lowest-confidence edges from theConsTembedding does result in a structure similar to the C-RANK filter-ings Figure 2c. Thus, it seems these lower-confidence, but metrically-consistent, interactions are crucial to obtaining the more distended structures that are more consistent with microscopy experiments.
Analysis of the types of edges kept by metric filtering For all chromosomes, bothConsPandConsTkeep more low-confidence edges than the C-RANKfiltering (ConsT shown in Figure 3a). Although, in general, more low-confidence edges are kept, the ConsTfiltering of chro-mosome 1 preserves overall higher distance interactions than the associated C-RANKfiltering with a mean distance of 0.55 while the C-RANKfiltering has a mean distance of 0.25 (all distances in μm). Of these interactions, the high-confidence ones in the ConsT filtering (i.e. those above 0.8) have a mean distance of 0.31 while the C-RANKfiltering has a mean distance of 0.25. This is due to the fact that the interactions in the C-RANK filter-ing are concentrated in a small region of chromosome 1, while the SET-COVERfiltering distributes the interactions across the entire chromosome: for the interactions in the C-RANKset, but not in theConsTfiltering, 76 out of the 131 interactions lie between positions 75881 and 130646 of chromosome 1 while the densest region of similar size in the SET-COVERfiltering has only 26 interactions. The
preservation of larger-distance, higher-confidence inter-actions in theConsTfiltering is likely what results in the expanded structure where telomere distances are more in line with microscopy experiments. For the ConsP embedding, however, the large disparity in mean distance of interactions (C-RANK: 0.165, MST-ADD: 1.69) is due mostly to low-confidence edges. This creates an undesir-able structure that contains very little useful information about long-range interactions. This is another indication that the strictness of the ConsP filtering may be too severe compared with the more relaxed and biologically plausible ConsTapproach. The inclusion of long-range interactions resulting from lower-confidence edges repre-sent some of the most interesting and desired informa-tion obtained from 3C experiments. C-RANKnecessarily ignores many of these long-range constraints, while the metric filtering allows the inclusion of both metrically consistent and higher-confidence constraints.
In addition, the ConsTmethod generally keeps inter-actions with larger genomic distances than C-RANK. The average genomic distance of C-RANK is 243.5 kilobases while the average genomic distance of SET-COVERis 285.0 kilobases (Figure 3b). Surprisingly, while ConsP keeps more low-frequency interactions, these tend to be at shorter genomic distances.
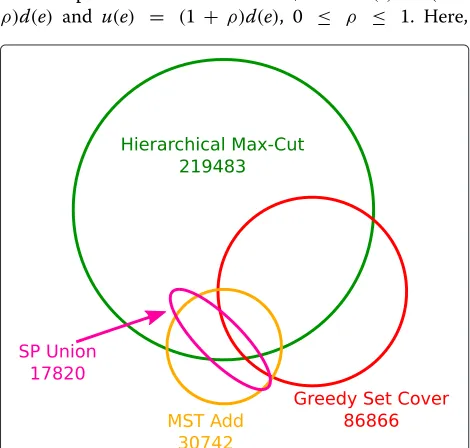
Various heuristics result in very different sets of edges Although the MAX-CUTand SET-COVERalgorithms aim to optimize the same objective and find subgraphs of approximately the same total weight, they result in very different edge sets (Figure 4). Further, their intersections with the most confident edges are also different: of the 219, 483 edges returned by MAX-CUT, 53% are among the top 219, 483 most confident edges, while 60% of the 86, 866 edges returned by SET-COVERare among the most confident edges (Table 2). The differing number of edges in solutions with similar total confidence also indicates that the edges in the MAX-CUT solution are of lower average confidence.
a
b
Figure 3Histogram of genomic distances and interaction confidences between C-Rank and ConsT.Distances and confidences for both filtering methods were computed on the intra-chromosomal interactions. (a) The ConsT filtering kept more low-confidence edges than C-Rank (“FDR Filter” in the legend). (b) The ConsT filtering kept interactions with larger genomic distances than C-Rank..
whether, if optimal solutions could be found, they would all be similar.
The two algorithms designed forConsPalso result in very different graphs, but this is primarily because the MST-ADD algorithm is far more successful at finding a good solution than the SP-UNION approach. The two algorithms had similar intersections with the top-most confident edges: for MST-ADD, 46% of the edges were among the top-most confident edges, while for SP-UNION the fraction was 41%.
Performance under uncertain distances
In the experiments conducted here, we setl(e) = (1−
ρ)d(e) and u(e) = (1 + ρ)d(e), 0 ≤ ρ ≤ 1. Here,
Figure 4Intersections among metric edge sets.
d(e)denotes the distance corresponding tof(e)using the original frequency-to-distance mapping. The parameter
ρ determines the size of the distance range to consider. When ρ is set to 0, no flexibility is allowed and condi-tion (4) reduces to condicondi-tion (1); whenρ is set to 1, the lower bound for the distance of an edgeegoes to 0, allow-ing all edges to satisfy condition (4). Therefore, withρ=1 no edges will be removed by the filtering. We system-atically sample ρ in the range of 0 to 1 in increments of 0.01.
Using distance ranges l(e),u(e), we compute the total confidence included in the filtered graph as a function of the slack factorρ(Figure 5). The total confidence for chro-mosome 1 gradually increases as a function ofρand there is noρfor which there is a sudden jump in the total con-fidence of the output graph. If some choice ofρhad lead to significantly more total confidence, filtering with ranges defined by thatρwould make sense if there was indepen-dent evidence that the computed distances are uncertain with that factor. Here, however, a small non-zeroρ does not substantially increase the confidence of the result-ing graph, indicatresult-ing that there are not many inconsistent edges that are on the cusp of metric consistency.
The linearly increasing total confidence observed in Figure 5 is largely explained by the distribution of the
Table 2 Intersections with C-RANKsets of equal size
Algorithm Inter. with C-RANK
SET-COVER 51865
MAX-CUT 116049
MST-ADD 14210
0.0 0.2 0.4 0.6 0.8 1.0 100
200 300 400 500 600
Total confidence
Chromosome 01
0.0 0.2 0.4 0.6 0.8 1.0
Normalized confidence
Set Cover Max-Cut
MST Add SP Union
0.0 0.2 0.4 0.6 0.8 1.0
Figure 5Total and normalized surprises of included edges vs.ρ. Total confidences (top) and normalized confidences (bottom) of included edges for different metric filtering algorithms on yeast chromosome 1 dataset. Normalized confidence is the total confidence divided by the number of edges in the output graph.
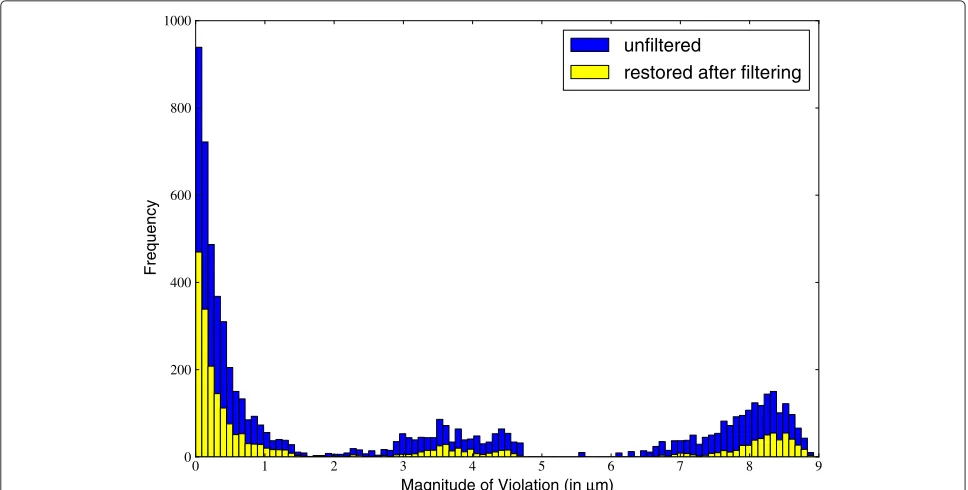
size of edge violations for edges included whenρ = 0 (Figure 6). In any given error bin, a large fraction of the violated edges are corrected atρ=0, providing more evi-dence that the algorithms generally perform well with a strict distance mapping. We also observe that the edges
that are corrected by the metric filtering are not associ-ated with any particular magnitude of error. For example, even though most of the violating edges are low error, they are not preferentially removed in the metric filter-ing. Because of this, the histogram of errors that remain to be resolved is more uniform in shape than the origi-nal distribution of errors, and therefore we would expect, as observed, a gradual increase in total confidence as
ρincreases.
Between the ConsP algorithms, MST-ADD obtains
higher total confidences for different values of ρ, while SP-UNION obtains higher average confidence on the edges in the output graph. In other words, SP-UNION includes higher quality edges, and MST-ADD includes more edges. A ρ of 0.34 is needed before MST-ADD acheives the total confidence of SET-COVERwithρ = 0. This provides more evidence that theConsPcondition is too strict.
Interestingly, although MAX-CUTand SET-COVER per-form similarly for low values ofρ, SET-COVERobtains the highest total (and normalized) confidence under most val-ues of ρ. The MAX-CUT method fails to include more edges when the metric consistency condition is relaxed because the cut it finds in the first pass is not affected by the choice ofρ and this cut includes most of the edges it will eventually keep. This resistance to the flexibility provided by (4) is another reason that MAX-CUT is less favorable than SET-COVER.
0 1 2 3 4 5 6 7 8 9
Magnitude of Violation (in µm) 0
200 400 600 800 1000
Frequency
unfiltered
restored after filtering
Practical running times of the algorithms
When applied to the largest yeast chromosome (chromo-some 4), the SET-COVERand MAX-CUTimplementations take 21 seconds and 21.5 minutes to run respectively on an Opteron 8431 processor. The SP-UNION and MST-ADD methods take 2.25 minutes and < 2 days respectively. The current implementation of MST-ADD re-computes the shortest paths after every edge addition, and this could be substantially sped up with a dynamic shortest-paths method. The SET-COVERimplementation is fast enough to be run on the entire yeast genome, including inter-chromosomal interactions, within 5 hours. In this case theConsTfiltering results in a significantly different edge set than the C-RANKembedding (the size of the intersec-tion with C-RANKis only 350960 out of 657177 edges). The SET-COVER algorithm also yields a relatively high average confidence (0.88) when compared to the average confidence from C-RANK(0.97).
Conclusions
We have provided evidence that a filtering scheme for 3C data that uses both statistical confidence and metric con-sistency as criteria produces sets of interactions that are more embeddable, and creates more consistent and more biologically plausible estimations for the 3D structures of the chromosomes. We show that such filtering in general is NP-hard, but by comparing to LP-based upper bounds, we empirically demonstrate that both a set cover approach and a hierarchical maximum cut algorithm produce nearly optimal solutions avoiding any violated triangles. Finally, we demonstrate that the methods can be extended in a straightforward way to account for ranges of allowable distances.
Competing interests
The authors declare that they have no competing interests.
Authors’ contributions
GD, RP, ES, HW and DF implemented the algorithms and performed the experiments. All authors helped design the algorithms and experiments, and helped write the manuscript. All authors read and approved the final manuscript.
Acknowledgements
This work was partially supported by the the National Science Foundation [CCF-1053918, EF-0849899, and IIS-0812111], National Institutes of Health [1R21AI085376], and a University of Maryland Institute for Advanced Studies New Frontiers Award. C.K. received support as an Alfred P. Sloan Research Fellow.
Author details
1Lane Center for Computational Biology, School of Computer Science,
Carnegie Mellon University, Pittsburgh, PA 15213, USA.2Department of Computer Science, University of Maryland, College Park MD 20742, USA.
Received: 21 December 2012 Accepted: 6 February 2013 Published: 9 March 2013
References
1. Dekker J, et al.:Capturing chromosome conformation.Science2002,
295(5558):1306–1311.
2. Marti-Renom MA, Mirny LA:Bridging the resolution gap in structural modeling of 3D genome organization.PLoS Comput Biol2011,
7(7):e1002125.
3. Ba `u D, et al.:The three-dimensional folding of theα-globin gene domain reveals formation of chromatin globules.Nat Struct & Mol Biol 2010,18:107–114.
4. Lieberman-Aiden E, et al.:Comprehensive mapping of long-range interactions reveals folding principles of the human genome.
Science2009,326(5950):289–293.
5. Fudenberg G, Getz G, Meyerson M, Mirny L:High order chromatin architecture shapes the landscape of chromosomal alterations in cancer.Nat Biotechnol2011,29:1109–1113.
6. Duan Z, et al.:A three-dimensional model of the yeast genome.
Nature2010,465(7296):363–367.
7. Kalhor R, et al.:Genome architectures revealed by tethered chromosome conformation capture and population-based modeling.Nat Biotechnol2012,30:90–98.
8. Sexton T, et al.:Three-dimensional folding and functional organization principles of the Drosophila genome.Cell2012,
148(3):458–472.
9. Tanizawa H, et al.:Mapping of long-range associations throughout the fission yeast genome reveals global genome organization linked to transcriptional regulation.Nuc Acids Res2010,38(22):8164–8177. 10. Umbarger MA, et al.:The three-dimensional architecture of a
bacterial genome and its alteration by genetic perturbation.Mol Cell 2011,44(2):252–264.
11. Sanyal A, Lajoie BR, Jain G, Dekker J:The long-range interaction landscape of gene promoters.Nat2012,489:109–113. 12. McCord R, et al.:Correlated alterations in genome organization,
histone methylation, and DNA, — lamina interactions in Hutchinson-Gilford Progeria syndrome.Genome Res2012. in press. 13. Dixon J, et al.:Topological domains in mammalian genomes
identified by analysis of chromatin interactions.Nature2012,
485(7398):376–380.
14. Yaffe E, Tanay A:Probabilistic modeling of Hi-C contact maps eliminates systematic biases to characterize global chromosomal architecture.Nat Genet2011,43(11):1059–1065.
15. Saxe J:Embeddability of weighted graphs in k-space is strongly NP-hard.In17th Allerton Conference in Communications, Control and Computing. Monticello: Carnegie-Mellon University, Dept. of Computer Science, 1980; 1979:480–489.
16. Hochbaum DS (Ed):Approximation Algorithms for NP-hard Problems, Boston: PWS Publishing Co.; 1997.
17. Niedermeier R, Rossmanith P:An efficient fixed-parameter algorithm for 3-Hitting Set.J Discrete Algorithms2003,1:89–102.
18. Gomes C, Williams R:Approximation algorithms.InSearch
Methodologies: Introductory, Tutorials in Optimization and Decision Support Techniques. Edited by Burke EK, Kendall G. New York: Springer; 2005. 19. Rousseau M, et al.:Three-dimensional modeling of chromatin
structure from interaction frequency data using Markov chain Monte Carlo sampling.BMC Bioinformatics2011,12(414). 20. Duggal G, Patro R, Sefer E, Wang H, Filippova D, Khuller S, Kingsford C:
Resolving spatial inconsistencies in chromosome conformation data.InProceedings of the 12th international conference on Algorithms in Bioinformatics. WABI’12, Berlin, Heidelberg: Springer-Verlag; 2012:288–300. 21. Theobald DL, Wuttke DS:THESEUS: maximum likelihood
superpositioning and analysis of macromolecular structures.
Bioinformatics2006,22(17):2171–2172.
22. Therizols P, et al.:Chromosome arm length and nuclear constraints determine the dynamic relationship of yeast subtelomeres.Proc Natl Acad Sci USA2010,107(5):2025–2030.
doi:10.1186/1748-7188-8-8
Cite this article as:Duggalet al.:Resolving spatial inconsistencies in chro-mosome conformation measurements.Algorithms for Molecular Biology2013