Damage-Based Seismic Performance Evaluation of Reinforced
Concrete Frames
YeongAe Heo
1), and Sashi K. Kunnath
2),*
(Received May 1, 2013, Accepted July 9, 2013)
Abstract: A damage-based approach for the performance-based seismic assessment of reinforced concrete frame structures is proposed. A new methodology for structural damage assessment is developed that utilizes response information at the material level in each section fiber. The concept of the damage evolution is analyzed at the section level and the computed damage is calibrated with observed experimental data. The material level damage parameter is combined at the element, story and structural level through the use of weighting factors. The damage model is used to compare the performance of two typical 12-story frames that have been designed for different seismic requirements. A series of nonlinear time history analyses is carried out to extract demand measures which are then expressed as damage indices using the proposed model. A probabilistic approach is finally used to quantify the expected seismic performance of the building.
Keywords:damage model, frame building, seismic performance.
1. Introduction
There is general agreement that new procedures are essential for the evaluation of seismic safety of existing structures and for the design of new structures to meet specified performance objectives. There have been several efforts to develop performance based seismic engineering methodologies resulting in guideline documents such as ATC-40 (1996), FEMA-350 (2000) and FEMA-356 (2000). While these documents offer a starting point to the eventual goal of assessing building performance to design level earthquake loads, there is still much work that needs to be done to facilitate reliable seismic performance assessment. All performance-based methodologies share common ele-ments which can roughly be itemized into the following sequence of steps:
• Definition of a performance objective that describes a level of performance which is associated with a specific seismic hazard
• Estimation of seismic demands on the system and its components through detailed structural analysis (prefer-ably nonlinear)
• Evaluation of the performance (at the system and component level) to verify that the performance objec-tive has been met.
While efforts to improve specific aspects of the seismic evaluation process have progressed over the past decade, there remains the need for a general framework that incor-porates seismic demand and performance assessment into a comprehensive strategy. A general probabilistic framework is proposed in this paper to assess seismic performance of reinforced concrete frame buildings using a new damage-based performance measure that also considers variability in ground motion characteristics.
2. Material-Based Damage Model
Current guideline documents such as FEMA-356 (2000) utilize inter-story drift ratio and plastic rotation to establish building performance levels such as immediate occupancy, life-safety, and collapse prevention. While these measures provide information on the deformation of elements and the displaced profiles at critical states, they are inadequate in themselves to provide an assessment of the state of damage or proximity to collapse.
A review of the literature reveals that there are essentially five approaches to damage modeling: estimates based on measures of deformation and/or ductility; models based on the degradation of a selected structural parameter (typically stiffness); models developed from considerations of energy-dissipation demand and capacity; hybrid formulations com-bining some aspects of the aforementioned parameters; and more complex theories based on concepts derived from
1)
Offshore Tech. R&D of Marine and Offshore Research Inst., Samsung Heavy Ind., Seoul, Korea.
2)
Department of Civil and Environmental Engineering, University of California, Davis, CA 95616, USA. *Corresponding Author; E-mail: [email protected] CopyrightThe Author(s) 2013. This article is published with open access at Springerlink.com
International Journal of Concrete Structures and Materials Vol.7, No.3, pp.175–182, September 2013
fatigue models. Comprehensive reviews of damage model-ing techniques can be found in Williams and Sexsmith (1995) and Heo (2009).
Since the response of common structural engineering materials such as steel and RC from the elastic state to failure is represented by yielding, plastic or irreversible behavior, crack growth, and fatigue during monotonic and cyclic loading, it is possible to represent such deterioration phenomena by a numerical model which can be incorporated in fiber-based discretization of a section for material-based damage estimation at the element level.
2.1 Damage Modeling at Constitutive Level In this section, a damage model is introduced at the material level that is related to the response of the section deformation. This deformation is characterized by the stress and strain in the fibers of the cross-section.
2.1.1 Damage in Concrete Fiber
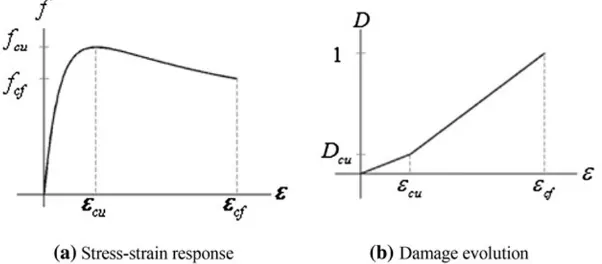
Strains at the threshold of damage initiation, attainment of compressive strength, and residual strength of crushed concrete are defined as damage parameters. Damage is considered only in the core concrete because it was determined that calibrating the damage state to compression damage in the core was a better indicator of section damage than incorporating deterioration in both core and cover concrete. Other measures of concrete damage such as tensile cracking was found to be unimportant since damage from tensile loading is better reflected in rein-forcing steel. Moreover, the response in compression governs the section damage in the concrete core. The constitutive model proposed by Mander et al. (1988) is used to evaluate the stress– strain response of the confined concrete.
A simple bilinear model is proposed in Eq. (1) and (2) assuming that the damage index is 1.0 when the accumulated plastic strain reaches the strain at the residual strength:
Dci ¼
Dcuðf fcdÞ
ðfcufcdÞ
foreecu ð1Þ
Dci ¼1þ
ð1DcuÞðf fcfÞ
ðfcf fcuÞ
fore[ecu ð2Þ
where Dci is the concrete damage index at theith concrete fiber, Dcu denotes the damage index at the compressive
strength of concrete,fcdis the strength at damage initiation,
fcuis the concrete compressive strength, fcf is the residual strength, and ecudenotes strain at concrete compressive strength. As shown in Fig.1, the damage rate changes at the peak compressive strength according toDcu which can be determined by the ratio of the degraded strength at the failure (fcu-fcf) to the compressive strength (fcu) denoted byDcuas follows:
Dcu¼
ecuecd
ecf ecd
ð3Þ
2.1.2 Damage in Reinforcing Steel Fibers
While the response of reinforcing steel beyond the elastic phase is described through yielding, hardening, softening, and fracture under monotonic loading, these monotonic parameters are inadequate to incorporate random cyclic effects such as strength degradation because steel is vul-nerable to fatigue damage under seismic loads. It is more efficient to consider damage due to cyclic fatigue since it encompasses the combined effect of multiple damage parameters. Buckling of reinforcing bars is an important phenomenon that occurs under both monotonic and cyclic loading however, a cyclic fatigue model can also include buckling effects. Therefore Miner’s (1945) linear damage rule shown in Eq. (4) is applied to compute damage in reinforcing steel fiber:
Dsi¼ 1
Pn
j¼1ð2NfÞj
ð4Þ
Dsi denotes the damage index in the ith steel fiber, and (2Nf)j denotes the number of half-cycles to failure at the plastic strain amplitude corresponding cycle j which is described in Coffin (1954,1971) and Manson (1953).Dsiis initialized to zero until the cumulative plastic strain attains the damage initiation threshold and it reaches unity (ideally) when the rebar is fractured. It is implicitly assumed that the fatigue model is calibrated in a manner that incorporates buckling. This means that the strain is measured across a significant characteristic length that includes buckling. In experiments carried out by Brown and Kunnath (2004), the fatigue life of reinforcing bars is computed using an effective length that includes the buckling zone. Additional details to
estimate (2Nf)j can be also found in Kunnath and Chai (2004).
2.1.3 Structural Damage at Element Level
It is necessary to first generate damage at the element level from the section damage at the fiber level discussed in the previous section. It is reasonable to consider the damage index of the most critical fibers for concrete and reinforcing steel as representative damage indices for each section as defined below:
DBcx¼maxðDBciÞ; DBsx¼maxðDBsiÞ ð5Þ
DCcx¼maxðDCciÞ; DCsx¼maxðDCsiÞ ð6Þ
In the above equations,Dcx andDsxdenotes concrete and reinforcing steel damage index respectively on the xth element for each story and superscriptsBandCdenote beam and column elements. For a n story frame structure with
mbays,x=1, 2 ….mfor beams and x=1, 2…m?1 for columns for each story. It is assumed that the failure of any critical concrete or reinforcing steel fiber leads to section failure in the member. This assumption may be conservative if the concrete crushing strain is achieved prior to the fatigue failure of the reinforcing bar, however, the ultimate compressive strain in confined concrete is a severe damage state that also impacts the damage in the steel. Since the failure of a local member detected by the proposed damage model at the material level progressively affects adjacent members, it can lead to eventual collapse of the entire system. Hence the damage index at the material level can govern the damage index at the element as well as the system level.
The combination of individual section damage to compute the element damage requires the implementation of weighting factors. In the study, based on studying different weighting factors, it was determined that the damage index itself is quite effective to be regarded as the weighing factor in estimating section damage. This approach has also been used previously by Bracci et al. (1989). In Eq. (7) and (8),
wcx and wsx denotes the weighting factor for the damage index of the extreme concrete and steel fiber for the xth element on each story respectively.
wBcx¼ D
B cx
ðDB sxþDBcxÞ
; wBsx¼ D
B sx
ðDB sxþDBcxÞ
ð7Þ
wCcx¼ D
C cx
ðDC sxþDCcxÞ
; wCsx¼ D
C sx
ðDC sxþDCcxÞ
ð8Þ
Finally, the damage index ofxth beam and column element (DB
x,DCx) is estimated as follows:
DBx ¼DBsxwsxB þDBcxwBcx; DCx ¼DCsxwCsxþDCcxwCcx ð9Þ
2.1.4 Structural Damage at Story Level
Damage is computed at each story level to facilitate the assessment of structural performance under earthquake
loads. The same concept of using the damage index as weighting factor can be applied in computing the damage for each story as shown below:
DBy ¼
Pm
x¼1 DBx
2
Pm
x¼1DBx
; DCy ¼
Pm
x¼1 DCx
2
Pm
x¼1DCx
ð10Þ
DByandDCy denote the damage indices for theyth story of a
n-story frame structure. Since columns are more critical structural elements than beams, it is necessary to introduce the concept of an importance factor. In this study, this is achieved by imposing a higher weighting factor for the failure of column elements compared to beams. Assuming that a story fails when the combine damage index of the columns in that story reaches 0.5, the story damage index for columns (DC
y) needs to be updated as given in Eq. (11):
DCy ¼ 1ðD
C y0:5Þ
adjusted by interpolationðDC y\0:5Þ
(
ð11Þ
Finally, the damage index of the yth story using the weighted beam and column damage index of each story is computed as given below:
Dy¼
DB y
2
þ DC
y
2
DB yþDCy
ð12Þ
3. Model Validation
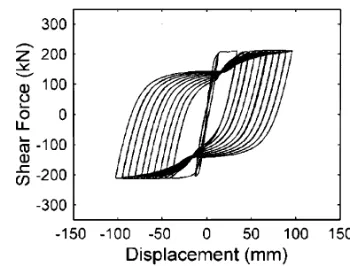
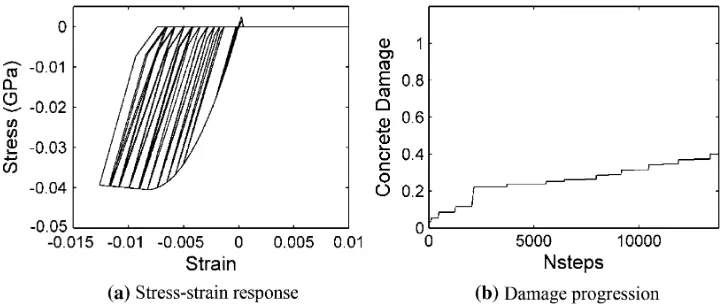
In this section, the applicability of the proposed model to assess the damage to components subjected to cyclic loading is examined. Figure2displays the cyclic force–deformation response of the ductile column tested by Mo and Wang (2000). The resulting stress–strain histories in the critical confined concrete fiber and critical reinforcing steel fiber is shown in Figs.3 and 4, respectively. Figures3 and 4 also show the computed damage histories. In this case, the pro-posed damage model suggests that failure of the section is initiated by cyclic fatigue of the critical reinforcing bar.
4. Probabilistic Performance Assessment
The proposed assessment requires the development of a statistically reliable prediction model of the selected seismic demand parameter. The prediction model is essentially a regression model based on the analysis of large data sets that consist of ground motion parameters from recorded motions and simulated data from nonlinear structural simulations. In the present study, the following ground motion intensity measures are considered in the development of the response model: spectral acceleration at the fundamental period,SaT1, the spectral acceleration at the second mode period, SaT2, and the spectral acceleration at the third mode periodSaT3, the spectral acceleration corresponding to 1.5 times the fundamental periodSaT4, and the spectral acceleration at 2.0 times the fundamental periodSaT5.
Expressing the demand as a linear combination of one or more intensity measures and examining the resulting resid-uals is a simple way to assess the effectiveness of a pre-dictive demand model. In this study, the following regression models, where the structural damage index (DI) is selected as the primary response parameter, were considered:
EðlnDIÞ ¼c0þc1lnðSaT1Þ þc2lnðSaT3Þ þc3lnðSaT4Þ þc4lnðSaT5Þ
ð13Þ
EðlnDIÞ ¼c0þc1lnðSaT1Þ þc2lnðSaT3Þ ð14Þ
EðlnDIÞ ¼c0þc1lnðSaT1Þ ð15Þ
Note that DI refers to the peak story damage index. Equation (13) is referred to as Model A, Eq. (14) is Model C and Eq. (15) is Model E in the ensuing discussions. Each response prediction equation can be evaluated statistically against the original data to generate the mean and standard deviation of the model predictions. Finally, the probability that a set of ground motions causes a selected damage index to be exceeded for a given earthquake scenario is computed by integrating the probability distribution of the structural response measure (DI) over the truncated area frome0
dlnðDIÞ (the value of the normalized residual corresponding to a specified damage state, (di) to infinity:
PðDI gt;dijSaTiÞ ¼
Z1
e0 dlnDI
felnDIdedlnDI ð16Þ
fe dlnDI ¼NðldlnDI;rdlnDIÞ ð17Þ
DI ¼expðlnD^IÞexpðedlnDIrdlnDIÞ ð18Þ
In the above equations, fe dlnDI is the normal distribution function of the normalized residuals of the damage indices with mean ldlnDI and standard deviation rdlnDI. The
Fig. 3 Stress–strain response of critical reinforcing steel fiber and corresponding damage progression.
cumulative probability density distribution represented by Eq. (16) is referred to as a fragility function.
5. Case Study
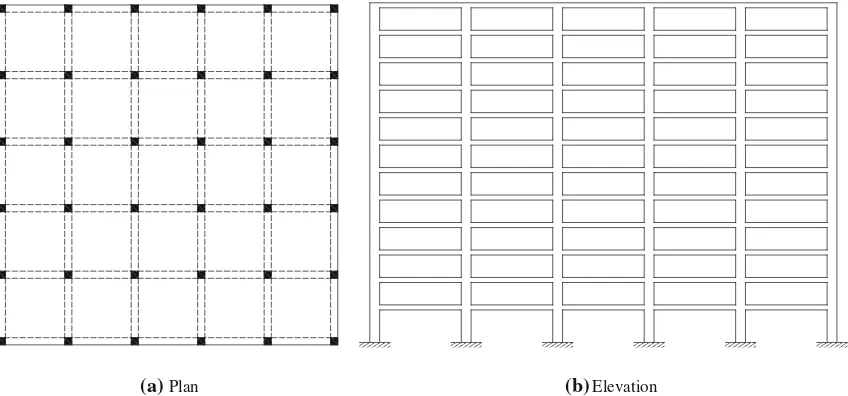
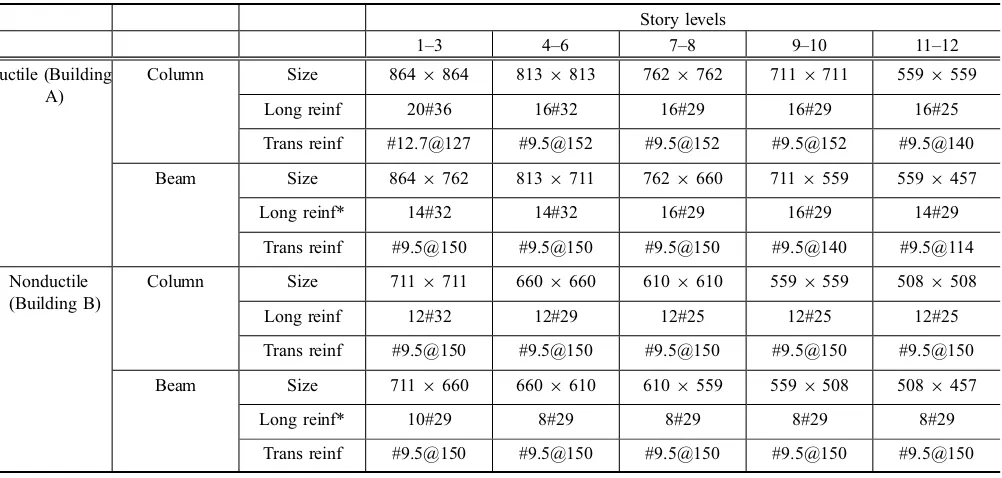
The proposed methodology is applied to the assessment of two typical 12-story RC frame buildings: a modern RC building designed to current seismic provisions (referred to as Building A) and an older RC building (referred to as Building B) designed to pre-1971 standards. Consistent with the theme of the present study, these two buildings represent two important structural types: ductile and nonductile sys-tems. The lowest level of both building is 15 feet high while the remaining floors are 12 feet. The plan dimensions of the building are 1209120 feet with 5 equal bays of 24 feet in each direction. The choice of a symmetric floor plan allows a single typical frame in either direction to be analyzed as a two-dimensional frame. A plan view and typical frame ele-vation of the building is shown in Fig.5.
Building A is assumed to be a standard office building located in San Francisco (37.46 N, 122.25 W). This building is designed to meet the provisions of Seismic Design Cate-gory D as specified in ASCE 7-05. The following parameters were used in the design:
Ss¼1:50 g; S1¼0:67 g; I¼1:10; Cd¼5:5;
R¼8:0
Using the above values, the design base shear is 2325 kips and the approximate code-based fundamental period is 1.43 s while the true first mode period based on input material and element properties was determined to be 2.1 s. The final design is based on using normal weight concrete (150 pcf) with a compressive strength fc0¼4,000 psi and reinforcing steel with a nominal yield strengthfy¼60 ksi. Section sizes and details of the required flexural and shear reinforcement is presented in Table1. To simplify the design process, equal top and bottom reinforcement is provided in
the beam end-sections for both frames corresponding to the largest moment demand from combined lateral and gravity loads.
For Building B, in accordance with the provisions of SEAOC 1960, the horizontal force factorKwas set to 0.67, the period-dependent factor C=0.047 (based on an approximate period of 1.2 s) and the resulting base shear was computed as 733 kips. This lateral shear is only 32 % of the required base shear in current practice. The reduction in building weight due to the fact that the building components are smaller is compensated by lower stiffness resulting in a first mode period of 2.45 s that is comparable to the building designed to the current code. Final section sizes and rein-forcement details of the building are displayed in Table1.
5.1 Ground Motions Used in Evaluation
Upon examining the thousands of ground motion records in the Pacific Earthquake Engineering Research (PEER) next generation attenuation (NGA) database (PEER2005), it was found that a significant majority of the records were low intensity motions that did not induce sufficient inelastic behavior in the structural system being evaluated in this study. Since one of the objectives of the study is to examine the effectiveness of demand and performance measures in the moderate to severe range of structural damage, it was decided to select only 200 ground motions whose PGA exceeds 0.2 g. Of these, exactly half were near fault records (fault distance less than 20 km) and the remaining were far-fault records. Figs.6and7show the 5 % damped response spectra for all selected records from the database. Also shown is the mean spectrum of the 100 near fault and far fault records superimposed on the ASCE 7-05 design spec-trum for the site.
Simulation models of both 12-story frames were devel-oped in OpenSEES (2011). Among the widely used element models in the context of fiber-based discretization of sec-tions are nonlinear beam-column elements with distributed plasticity. A fully nonlinear beam-column element estimates element deformations by numerical integration of the section
(a) Plan (b)Elevation
deformations. On the other hand, the beam-with-hinges element implemented in OpenSees uses four integration points to compute element deformations assuming fixed plastic hinge lengths at the ends of the element. A complete
description of the element formulation is reported by Scott and Fenves (2006). All frame elements were modeled in OpenSees using the Beam-with-Hinges element: a hinge length corresponding to 55 % of the section depth was used
Table 1 Component sizes and reinforcement details for Buildings A and B.
Story levels
1–3 4–6 7–8 9–10 11–12
Ductile (Building A)
Column Size 8649864 8139813 7629762 7119711 5599559
Long reinf 20#36 16#32 16#29 16#29 16#25
Trans reinf #12.7@127 #9.5@152 #9.5@152 #9.5@152 #9.5@140
Beam Size 8649762 8139711 7629660 7119559 5599457
Long reinf* 14#32 14#32 16#29 16#29 14#29
Trans reinf #9.5@150 #9.5@150 #9.5@150 #9.5@140 #9.5@114
Nonductile (Building B)
Column Size 7119711 6609660 6109610 5599559 5089508
Long reinf 12#32 12#29 12#25 12#25 12#25
Trans reinf #9.5@150 #9.5@150 #9.5@150 #9.5@150 #9.5@150
Beam Size 7119660 6609610 6109559 5599508 5089457
Long reinf* 10#29 8#29 8#29 8#29 8#29
Trans reinf #9.5@150 #9.5@150 #9.5@150 #9.5@150 #9.5@150
Notation nbars with diameter #; diameter # @ spacing; all dimensions in mm.
* Total reinforcement (equal top and bottom reinforcement).
Fig. 6 5 % Damped Response Spectra of selected 200 ground motions:a100 Near-fault records.b100 Far-fault records.
since this value produced deformations and damage mea-sures that correlated well with experimental observations.
In all, 200 nonlinear analyses were carried out with the selected ground motions. The damage model presented in this paper was applied to the computed response quantities. Response models of the form given in Eqs. (13)–(15) were generated and the regression coefficients obtained are listed in Table2. Only the sample case for Building A is shown in Table2.
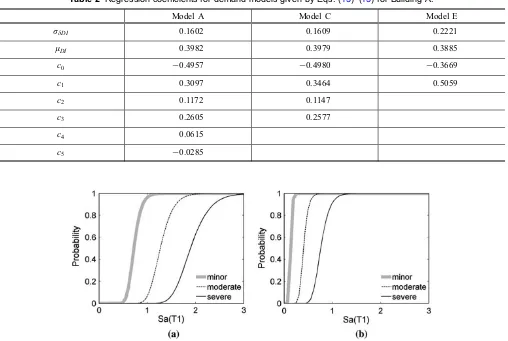
The damage model was calibrated (see Heo 2009 for additional details) as follows:DI\0:4 is classified as Minor Damage; 0:4DI0:7 is considered to result in Moderate Damage while DI[0:7 is expected to lead to Severe Damage. The distribution of damage estimates is then used to generate fragility curves as formulated in Eq. (16). Figure8 shows the probability that each of the building considered in the evaluation study will attain different damage states as a function of the first mode spectral accelerationSaT1.
6. Concluding Remarks
The proposed damage model is a preliminary effort to investigate the applicability of material based damage models in seismic performance assessment. The material-based damage model is found to reproduce observed com-ponent damage in a consistent manner so that calibration of
the model is possible for different types of section details (ductile and non-ductile). Since fiber-based element models are going to be used more widely in nonlinear analysis of reinforced concrete structures, the development of a robust material-based damage model will greatly facilitate more accurate performance-based assessment. The damage model has been shown in Heo (2009) to compare favorably to well-known structural response measures such as inter-story drift and member plastic rotation. In this study, the model was used to compare the relative seismic performance of two different buildings designed to different seismic requirements.
Open Access
This article is distributed under the terms of the Creative Commons Attribution License which permits any use, distribution, and reproduction in any medium, provided the original author(s) and the source are credited.
References
ATC-40. (1996). Seismic evaluation and retrofit of concrete buildings(Vol. 1). Redwood City, CA: Applied Technology Council.
Table 2 Regression coefficients for demand models given by Eqs. (13)–(15) for Building A.
Model A Model C Model E
rdDI 0.1602 0.1609 0.2221
lDI 0.3982 0.3979 0.3885
c0 -0.4957 -0.4980 -0.3669
c1 0.3097 0.3464 0.5059
c2 0.1172 0.1147
c3 0.2605 0.2577
c4 0.0615
c5 -0.0285
Bracci, J., Reinhorn, A. M., Mander, J. B. & Kunnath, S. K.
Deterministic damage model for seismic damage evalua-tion of RC structures. NCEER report 89-0033. (1989). Buffalo, NY: State University of New York.
Brown, J., & Kunnath, S. K. (2004). Low-cycle fatigue behavior of reinforcing steel bars. ACI Materials Journal, 101(6), 457–466.
Coffin, L. F. Jr. (1954). A study of the effect of cyclic thermal stresses on a ductile metal.American Society of Mechanical Engineers, 76, 931–950.
Coffin, L. F. Jr. (1971). A note on low cycle fatigue laws.
Journal of Materials, 6, 388–402.
FEMA-350. (2000). Recommended seismic design criteria for new steel moment-frame buildings. Washington D.C.: Federal Emergency Management Agency.
FEMA-356. (2000). Prestandard and commentary for the seismic rehabilitation of buildings. Washington D.C: Fed-eral Emergency Management Agency.
Heo, Y. A. (2009). Framework for damage-based probabilistic seismic performance evaluation of reinforced concrete frames.Ph.D. Dissertation, University of California, Davis, CA.
Kunnath, S. K., & Chai, Y. H. (2004). Cumulative damage-based inelastic cyclic demand spectrum. Earthquake Engineering and Structural Dynamics, 33(4), 499–520.
Mander, J. B., Priestley, M. J. N., & Park, R. (1988). Theoretical stress strain model for confined concrete. Journal of Structural Engineering, 114(8), 1804–1826.
Manson, S. S. (1953). Behavior of materials under conditions of thermal stress. InHeat Transfer Symposium(pp. 9–75) Ann Arbor, MI: University of Michigan Engineering Research Institute.
Miner, M. A. (1945). Cumulative damage in fatigue.Journal of Applied Mechanics, 12, A159–A164.
Mo, Y. L., & Wang, S. J. (2000). Seismic behavior of RC columns with various tie configurations.Journal of Struc-tural Engineering, 126(10), 1122–1130.
OpenSees. (2011). ‘‘Open system for earthquake engineering simulation’’.Open source softwarehttp://opensees.berkeley. edu. Retrieved 1 June 2009.
PEER. (2005).Strong motion databasehttp://peer.berkeley.edu. Retrieved 4 April 2009.
Scott, M. H., & Fenves, G. L. (2006). Plastic hinge integration methods for force-based beam-column elements.Journal of Structural Engineering, 132(2), 245–252.
Williams, M. S., & Sexsmith, R. G. (1995). Seismic damage indices for concrete structures: A state-of-the-art review.