RESEARCH
Influence of changes in ventricular systolic
function and loading conditions on pulse
contour analysis-derived femoral d
P
/d
t
max
Sergi Vaquer
1,2,3,4*, Denis Chemla
4,5, Jean‑Louis Teboul
3,4, Umar Ahmad
3,4, Flora Cipriani
3,4, Joan Carles Oliva
6,
Ana Ochagavia
1, Antonio Artigas
1,7, Francisco Baigorri
1,7and Xavier Monnet
3,4Abstract
Background: Femoral dP/dtmax (maximum rate of the arterial pressure increase during systole) measured by pulse contour analysis has been proposed as a surrogate of left ventricular (LV) dP/dtmax and as an estimator of LV systolic function. However, femoral dP/dtmax may be influenced by LV loading conditions. In this study, we evaluated the impact of variations of LV systolic function, preload and afterload on femoral dP/dtmax in critically ill patients with cardiovascular failure to ascertain its reliability as a marker of LV systolic function.
Results: We performed a prospective observational study to evaluate changes in femoral dP/dtmax, thermodilution‑ derived variables (PiCCO2—Pulsion Medical Systems, Feldkirchen, Germany) and LV ejection fraction (LVEF) meas‑ ured by transthoracic echocardiography during variations in dobutamine and norepinephrine doses and during volume expansion (VE) and passive leg raising (PLR). Correlations with arterial pulse and systolic pressure, effective arterial elastance, total arterial compliance and LVEF were also evaluated. In absolute values, femoral dP/dtmax devi‑ ated from baseline by 21% (201 ± 297 mmHg/s; p= 0.013) following variations in dobutamine dose (n= 17) and by 15% (177 ± 135 mmHg/s; p < 0.001) following norepinephrine dose changes (n= 29). Femoral dP/dtmax remained unchanged after VE and PLR (n= 24). Changes in femoral dP/dtmax were strongly correlated with changes in pulse pressure and systolic arterial pressure during dobutamine dose changes (R= 0.942 and 0.897, respectively), norepi‑ nephrine changes (R= 0.977 and 0.941, respectively) and VE or PLR (R= 0.924 and 0.897, respectively) (p < 0.05 in all cases). Changes in femoral dP/dtmax were correlated with changes in LVEF (R= 0.527) during dobutamine dose vari‑ ations but also with effective arterial elastance and total arterial compliance in the norepinephrine group (R= 0.638 and R=− 0.689) (p < 0.05 in all cases).
Conclusions: Pulse contour analysis‑derived femoral dP/dtmax was not only influenced by LV systolic function but also and prominently by LV afterload and arterial waveform characteristics in patients with acute cardiovascular failure. These results suggest that femoral dP/dtmax calculated by pulse contour analysis is an unreliable estimate of LV systolic function during changes in LV afterload and arterial load by norepinephrine and directly linked to arterial waveform determinants.
Keywords: Haemodynamic monitoring, Waveform analysis, Ejection fraction, Preload, Afterload, Thermodilution
© The Author(s) 2019. This article is distributed under the terms of the Creative Commons Attribution 4.0 International License (http://creat iveco mmons .org/licen ses/by/4.0/), which permits unrestricted use, distribution, and reproduction in any medium, provided you give appropriate credit to the original author(s) and the source, provide a link to the Creative Commons license, and indicate if changes were made.
Open Access
*Correspondence: [email protected]
1 Servei de Medicina Intensiva, Centre de Crítics, Corporació Sanitària Universitària Parc Taulí, Parc Taulí 1, 08208 Sabadell, Spain
Background
Current haemodynamic monitoring devices performing arterial pulse contour analysis can measure and monitor the maximum rate of rise of arterial pressure (dP/dtmax).
By analogy with the left ventricle (LV) dP/dtmax, arterial
dP/dtmax is supposed to reflect LV systolic function [1–8].
Several studies have suggested that measurements of arterial dP/dtmax obtained from radial [7, 9] and
femo-ral [7, 10] arterial pressure waveforms were comparable to LV dP/dtmax and, in some cases, might be useful for
predicting patient outcome [11]. However, conflicting results regarding the comparability of LV dP/dtmax and
arterial dP/dtmax have also been presented in both adults
and children [12, 13]. Despite these uncertainties, arte-rial dP/dtmax is most often presented as a marker of LV
systolic function in many off-the-shelf haemodynamic monitoring systems. Supportive literature is based on the observed good correlation between LV and arterial dP/ dtmax during periods of haemodynamic stability [7–9, 12].
However, these good correlations documented on stable patients do not necessarily imply that femoral dP/dtmax
provides an adequate evaluation of changes in LV systolic function during haemodynamic challenges.
Many physiological factors other than LV systolic func-tion may influence arterial dP/dtmax, including the timing
of the measurement relative to aortic valve opening, and the potential influences of cardiac preload and afterload (including its resistive and pulsatile components). To be considered a reliable marker of LV systolic function, arte-rial dP/dtmax should be unaffected by changes in these
variables and should consistently respond to directional changes in LV systolic function.
Therefore, to assess the validity of arterial dP/dtmax as
an index of LV systolic function and the relative contri-bution of changes in cardiac preload and afterload on its measurement, we studied the responses of femoral dP/ dtmax during changes in the dose of dobutamine and
nor-epinephrine, during passive leg raising (PLR) manoeuvre [14] and after intravascular fluid administration in criti-cally ill patients with circulatory shock. We also com-pared these changes with markers of left ventricular afterload and with left ventricle ejection fraction (LVEF) measured by transthoracic echocardiography.
Methods
We performed a prospective observational study in two adult intensive care units (Servei de Medicina Intensiva, Corporació Sanitària Universitària Parc Taulí, Sabadell, Spain, and Service de Médecine intensive-réanimation, Hôpital de Bicêtre, Le Kremlin-Bicêtre, France). The study was approved by local ethics committees of both institutions (Comitè Ètic d’Investigació Clínica de la
Corporació Sanitària Parc Taulí CEIC2013616 and Com-ité pour la Protection des Personnes Ile-de-France VII 2011A01696-35). All patients or next of kin gave their consent to participate to the study. Data in this manu-script are presented following the “Strengthening the Reporting of Observational Studies in Epidemiology” (STROBE) criteria for observational studies [15].
Patients
Inclusion criteria were age older than 18 years old and presence of at least one of the following signs of haemo-dynamic failure in the context of acute illness:
• Systolic arterial pressure ≤ 90 mmHg or decreases of more than 50 mmHg in the last 3 h or mean arterial pressure ≤ 65 mmHg
• Oliguria ≤ 0.5 mL/kg/h for more than 2 h • Blood lactate ≥ 2 mmol/L (or 22 mg/dL) • Central venous oxygen saturation ≤ 60% • Skin mottling
Patients had to be monitored with a transpulmonary thermodilution device (PICCO2, Pulsion Medical Sys-tems, Feldkirchen, Germany) and must present the need for a change in the dose of norepinephrine or dobu-tamine, or for volume expansion or a PLR test [14], as decided by the attending physicians.
Exclusion criteria were the evidence of a significant aortic stenosis with echocardiography (mean pressure gradient of the aortic valve ≥ 25 mmHg) and conditions
precluding measurements of femoral dP/dtmax of
suf-ficient quality such as over-damping or under-damping of the arterial pressure signal persisting after repeated flushes of the arterial line.
Recorded variables
Arterial pressure was measured through an arterial catheter inserted in the femoral artery (PV2015L20-A, Pulsion Medical Systems, Feldkirchen, Germany). The catheter was connected to a PiCCO2 device, which auto-matically and continuously calculated femoral dP/dtmax.
With this device, dP/dtmax was obtained from the
manually and required the presence of the investigator team.
Transthoracic echocardiography was performed with a CX 50 device (Philips Healthcare, DA Best, The Nether-lands) and used to estimate LV ejection fraction (LVEF). Measurements were taken by the same observer in all cases (SV) using the Simpson’s method from two- and four-chamber apical views. Endocardial contours were hand-drawn, and volumes were automatically averaged out over three consecutive cardiac cycles by the software to calculate LVEF.
All patients were equipped with a central venous cath-eter in the superior vena cava territory. Thermodilution measurements were taken by injection of a 15-mL cold saline bolus (< 8 °C) through the central venous catheter. The results of three consecutive thermodilution meas-urements were averaged [17]. Cardiac output and stroke volume were measured through transpulmonary ther-modilution [18] and indexed to body surface to provide cardiac index (CI), stroke volume index (SVI) and global end-diastolic volume index (GEDVi). Cardiac function index was obtained directly from the PiCCO2 device as a calculated variable (CFI = CI/GEDVi) [19].
To evaluate the resistive component of the arterial load, we calculated the systemic vascular resistance index (SVRi) as SVRi = (mean arterial pressure − central venous pressure)/cardiac index. To evaluate the pulsatile component of arterial loading, we calculated the total arterial compliance (TAC = stroke volume/arterial pulse pressure) [20]. Pulse pressure was calculated as the sys-tolic minus the diassys-tolic arterial pressure. The effective arterial elastance was used as a global index of arterial load as previously described (Ea = 0.9 × systolic arterial pressure/stroke volume) [21].
Study design
Data were collected before and after haemodynamic interventions. Volume expansion was performed by infusing 500 mL 0.9% saline solution over 10 min. Although other fluids might be considered for volume expansion [22], 0.9% saline solution was used in the units at the time the study was performed. A PLR test was per-formed by moving the patient from the semi-recumbent position to a position where the trunk is horizontal and the legs are elevated at 45°, as previously described [14].
In patients receiving fluid, the post-intervention meas-urements were taken immediately after the end of vol-ume expansion. In patients in whom a PLR test was performed, these measurements were taken at the time when the maximal PLR-induced change in CI, if any, had occurred. This usually occurs within 1 min [14]. After the change in dose of norepinephrine or dobutamine, the post-interventions recording was performed after
stabilisation of pulse contour-derived CI (for dobu-tamine) or of mean arterial pressure (for norepinephrine). Patients could be included in the study as many times as therapeutic interventions were indicated by the attending physicians. Multiple measurements on the same patient could only be performed after sufficient time had passed between different manoeuvres to allow for stabilisation of haemodynamic variables and provided that the haemo-dynamic status of the patient had significantly changed when assessing the same type of interventions.
Data analysis
During norepinephrine dose variations, changes in Ea, TAC and SVRi were used to identify changes in arterial loading properties, while changes in systolic and mean arterial pressure were used to estimate changes in LV afterload. During dobutamine dose variations, changes in LVEF, CI and CFI were used to estimate changes in LV systolic function. Finally, during PLR and volume expansion, changes in central venous pressure (CVP) and GEDVi were used to track changes in LV preload.
We considered changes in femoral dP/dtmax induced by
dobutamine dose variations as the main study variable. Using previous published data [10] and assuming a mini-mum required threshold of 10%, an α risk of 5% and a β
risk of 20%, we estimated that the minimum number of paired measurements required for detecting a significant change in femoral dP/dtmax during variations in the dose
of dobutamine was seven. We continued inclusions in the other study groups (changes in the dose of norepineph-rine and PLR/VE) until this number was reached in both dobutamine subgroups (dose increases and decreases).
Normality of variables was assessed using the Kolmog-orov–Smirnov test. Data are presented as mean ± stand-ard deviation (SD) or medians and 25th–75th percentile, as appropriate. Data from norepinephrine and dobu-tamine dose changes were pooled (absolute values of increases and decreases were evaluated together and averaged), and absolute deviations from baseline val-ues (called “changes” or “variations”) were presented as mean differences. Statistical comparisons were made using the paired Student’s t test or Wilcoxon rank test as appropriate. Percentages of change, rather than raw val-ues alone, were presented in order to normalise baseline values. Correlation of changes in study variables during interventions was performed using Pearson’s correlation test. In order to evaluate the potential impact of repeated measurements of the same type on a single patient, we studied changes in femoral dP/dtmax during interventions
calculations were done using SPSS version 22 (Interna-tional Business Machines, Armonk, NY, USA). Values of
p < 0.05 were considered statistically significant.
Results Patients
Nineteen patients were included (68% male subjects) between March 2013 and January 2015, in whom 72 therapeutic interventions were analysed (162 data points). Arterial line damping problems were observed in five patients, representing nine interventions. In all cases, repeated flushing of the arterial line led to res-olution of the damping effect, so that no patient was excluded due to this problem. Two interventions had to be rejected given repeatedly doubtful validity of the data due to patient movement and incorrect acquisi-tion procedure (Addiacquisi-tional file 1: Figure S1). The dis-tribution of medical interventions was as follows: norepinephrine dose increase: 9 (13%), norepinephrine dose decrease: 20 (29%), PLR: 12 (17%), volume expan-sion: 12 (17%), dobutamine dose increase: 7 (10%), dob-utamine dose decrease: 10 (14%). On average, 3.7 ± 2.0
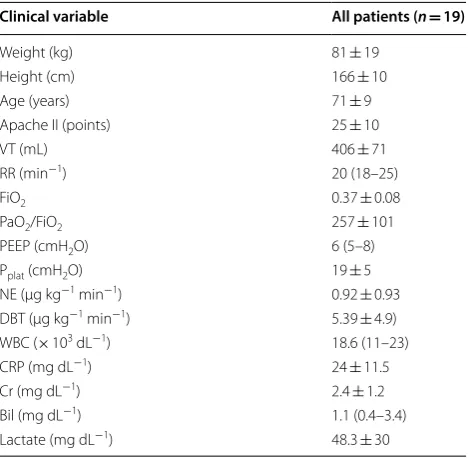
interventions were collected in each patient (Addi-tional file 1: Figure S1). Case demographics and clinical characteristics are presented in Table 1 and Additional file 1: Table S1. Baseline haemodynamic characteristics are presented in Table 2. The majority of interventions occurred during septic shock (54 cases; 77%), followed by cardiogenic shock (10 cases; 14%) and hypovolemic shock (6 cases; 9%). During 55 (79%) therapeutic inter-ventions, patients were mechanically ventilated, in 25 (45%) of which patients were not fully adapted to mechanical ventilation. In 44 cases (67%), sinus rhythm was present.
Table 1 Baseline demographic and clinical characteristics of included patients
Data are presented as mean ± SD or median (25th–75th%)
VT, tidal volume; RR, respiratory rate; FiO2, inspired oxygen fraction; PaO2, arterial
oxygen partial pressure; PEEP, positive end-expiratory pressure; Pplat, plateau pressure; NE, norepinephrine; DBT, dobutamine; WBC, white blood cells; CRP, C reactive protein; Cr, creatinine; Bil, total bilirubin
Clinical variable All patients (n= 19)
Weight (kg) 81 ± 19 Height (cm) 166 ± 10 Age (years) 71 ± 9 Apache II (points) 25 ± 10 VT (mL) 406 ± 71 RR (min−1) 20 (18–25)
FiO2 0.37 ± 0.08
PaO2/FiO2 257 ± 101
PEEP (cmH2O) 6 (5–8)
Pplat (cmH2O) 19 ± 5 NE (µg kg−1 min−1) 0.92 ± 0.93
DBT (µg kg−1 min−1) 5.39 ± 4.9)
WBC (× 103 dL−1) 18.6 (11–23)
CRP (mg dL−1) 24 ± 11.5
Cr (mg dL−1) 2.4 ± 1.2
Bil (mg dL−1) 1.1 (0.4–3.4)
Lactate (mg dL−1) 48.3 ± 30
Table 2 Haemodynamic variables at baseline
Data are presented as mean ± SD or median (25th–75th%)
NE norepinephrine, VE/PLR volume expansion/passive leg raising, DBT dobutamine, HR heart rate, SAP systolic arterial pressure, MAP mean arterial pressure, PP pulse pressure, CVP central venous pressure, GEDVi global end-diastolic volume index, CI cardiac index, SVI stroke volume index, CFI cardiac function index, LVEF left ventricle ejection fraction, Ea effective arterial elastance, TAC total arterial compliance, SVRi systemic vascular resistance index
an value refers to cases
Haemodynamic variable DBT (n= 17)a NE (n
= 29)a VE/PLR (n
= 24)a All interventions (n
= 70)a
Femoral dP/dtmax (mmHg s−1) 1049 ± 347 1319 ± 371 1162 ± 336 1199 ± 365
HR (beats min−1) 89 ± 14 92 ± 18 90 ± 15 90 (74–104)
SAP (mmHg) 117 ± 17 137 ± 25 123 ± 14 127 ± 21 MAP (mmHg) 75 ± 7 84 ± 16 78 (75–84) 78 (70–86) PP (mmHg) 66 ± 17 80 ± 18 70 ± 11 73 ± 17 CVP (mmHg) 9 ± 4 9 (8–12) 11 ± 4 9 (8‑12) GEDVi (mL m−2) 749 ± 120 773 (684–878) 773 ± 146 750 (671–846)
CI (L min−1 m−2) 2.7 ± 0.6 3.1 ± 1.2 3 (2.5–3.5) 3 (2.2–3.4)
SVI (mL m−2) 31 ± 9 35 ± 14 32 (24–45) 32 (25–44)
CFI (min−1) 3.9 ± 1.2 4.3 ± 1.6 4.4 ± 1.7 4.2 ± 1.6
LVEF (%) 43 ± 11 57 (42–61) 54 ± 17 50 ± 14 Ea (mmHg ml−1) 2 ± 0.5 2 (1.3–2.4) 1.9 (1.4–2.2) 1.9 (1.4–2.3)
TAC (ml mmHg−1) 0.9 ± 0.3 0.8 (0.6–1.2) 0.8 (0.8–1.1) 0.8 (0.7–1.1)
Effects of dobutamine
Changes in the dose of dobutamine (n= 17 interven-tions; absolute dose variation = 4.3 ± 1.3 µg kg−1 min−1)
induced an absolute deviation from baseline in femo-ral dP/dtmax of 21% and were correlated with changes
in femoral dP/dtmax (R= 0.62; p= 0.008). Changes from
baseline were also observed in CFI (7%), LVEF (20%), CI (12%) and heart rate (5%) (Table 3). SVI remained unchanged. While systolic arterial pressure and mean arterial pressure values did not vary, pulse pressure changed by 20%. SVRi changed by 5%; however, Ea and TAC presented no significant change. GEDVi and CVP also remained unchanged (Table 3).
When only one intervention per patient was con-sidered, changes in the dose of dobutamine induced an absolute deviation from baseline in femoral dP/ dtmax of 17% (1068 [748–1480] vs. 1254 [812–1672]
mmHg−1 s−1; n= 8; p= 0.036).
Increases in the dose of dobutamine increased femo-ral dP/dtmax by 20% (Fig. 1; Additional file 1: Table S2)
and reductions in the dose led to a decrease in femo-ral dP/dtmax of 28% (Fig. 1; Additional file 1: Table S2).
Additional data from haemodynamic changes obtained before and after increases and decreases in dobutamine
doses are presented in Additional file 1: Table S2 in the Supplemental Material.
The dobutamine-induced per cent changes in femoral dP/dtmax were significantly correlated with the per cent
changes in CFI, LVEF and CI, but presented the highest correlation with systolic arterial pressure and pulse pres-sure (Additional file 1: Table S3).
Effects of changes in norepinephrine dose
Changes in the dose of norepinephrine (n=29 interventions; absolute dose varia-tion = 0.19 ± 0.16 µg kg−1 min−1) induced an
abso-lute change from baseline in femoral dP/dtmax of 15%
and were correlated with changes in femoral dP/dtmax
(R= 0.47; p= 0.011). Arterial systolic, mean and pulse pressure also changed from baseline by 14, 11 and 9%, respectively. There were no significant variations in heart rate, CI and CFI (Table 3). LVEF presented a 11% change from baseline. Although SVI presented a significant change of 4%, CI remained unchanged. CVP and GEDVi also remained at baseline levels. Estimated Ea, TAC and SVRi changed by 9, 17 and 5%, respectively (Table 3).
When only one intervention per patient was consid-ered, changes in the dose of norepinephrine induced an absolute change from baseline in femoral dP/dtmax of 11%
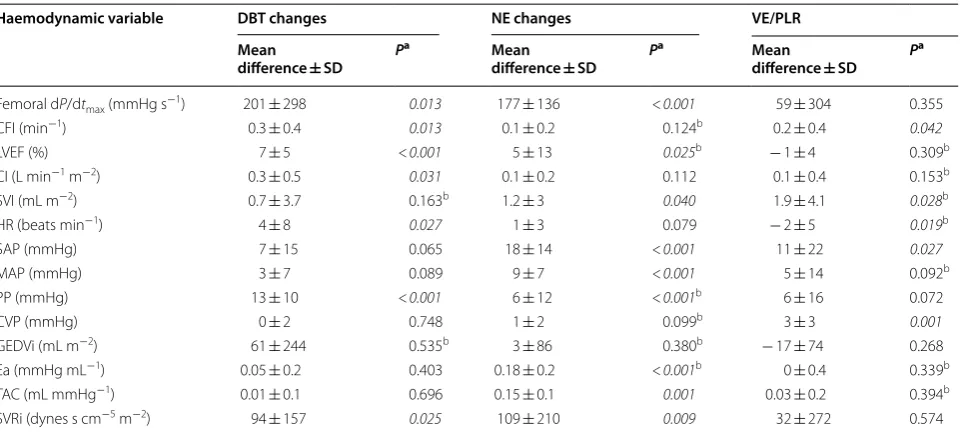
Table 3 Changes in haemodynamic variables during monitored interventions
In norepinephrine and dobutamine cases, absolute mean differences are presented. These were calculated as absolute results from increases and decreases in catecholamine dose
NE norepinephrine, VE/PLR volume expansion/passive leg raising, DBT dobutamine, CFI cardiac function index, LVEF left ventricle ejection fraction, CI cardiac index, SVI stroke volume index, HR heart rate, SAP systolic arterial pressure, MAP mean arterial pressure, PP pulse pressure, CVP central venous pressure, GEDVi global end-diastolic volume index, Ea effective arterial elastance, TAC total arterial compliance, SVRi systemic vascular resistance index
Significant results (p < 0.05) are highlighted in italics
a Calculated with Student’s T test unless indicated b Calculated with Wilcoxon’s rank test
Haemodynamic variable DBT changes NE changes VE/PLR Mean
difference ± SD P
a Mean
difference ± SD P
a Mean
difference ± SD P
a
Femoral dP/dtmax (mmHg s−1) 201 ± 298 0.013 177 ± 136 < 0.001 59 ± 304 0.355
CFI (min−1) 0.3 ± 0.4 0.013 0.1 ± 0.2 0.124b 0.2 ± 0.4 0.042
LVEF (%) 7 ± 5 < 0.001 5 ± 13 0.025b − 1 ± 4 0.309b
CI (L min−1 m−2) 0.3 ± 0.5 0.031 0.1 ± 0.2 0.112 0.1 ± 0.4 0.153b
SVI (mL m−2) 0.7 ± 3.7 0.163b 1.2 ± 3 0.040 1.9 ± 4.1 0.028b
HR (beats min−1) 4 ± 8 0.027 1 ± 3 0.079 − 2 ± 5 0.019b
SAP (mmHg) 7 ± 15 0.065 18 ± 14 < 0.001 11 ± 22 0.027
MAP (mmHg) 3 ± 7 0.089 9 ± 7 < 0.001 5 ± 14 0.092b
PP (mmHg) 13 ± 10 < 0.001 6 ± 12 < 0.001b 6 ± 16 0.072
CVP (mmHg) 0 ± 2 0.748 1 ± 2 0.099b 3 ± 3 0.001
GEDVi (mL m−2) 61 ± 244 0.535b 3 ± 86 0.380b − 17 ± 74 0.268
Ea (mmHg mL−1) 0.05 ± 0.2 0.403 0.18 ± 0.2 < 0.001b 0 ± 0.4 0.339b
TAC (mL mmHg−1) 0.01 ± 0.1 0.696 0.15 ± 0.1 0.001 0.03 ± 0.2 0.394b
(1134 [909–1457] vs. 1265 [1028–1623] mmHg−1 s−1;
n= 13; p= 0.001).
Increases in the dose of norepinephrine increased femoral dP/dtmax by 16% (Fig. 1 and Additional file 1:
Table S2) and reductions in the dose led to a decrease in femoral dP/dtmax of 8% (Fig. 1 and Additional file 1:
Table S2). Additional data from haemodynamic changes obtained before and after increases and decreases in norepinephrine doses are presented in Additional file 1: Table S2 (Fig. 2).
The norepinephrine-induced per cent changes in fem-oral dP/dtmax were correlated with per cent changes in
arterial systolic pressure, arterial pulse pressure, Ea and TAC (Additional file 1: Table S3).
Effects of volume expansion and passive leg raising
The PLR test and volume expansion (n= 24 interven-tions) did not induce significant changes in femoral dP/ dtmax. Heart rate decreased by − 3%, and systolic arterial
pressure increased by 9%, while mean arterial pressure and pulse pressure remained unchanged. LVEF did not change, but CFI significantly increased by 4%. In this sub-group, CI did not change from baseline but SVI increased significantly by 5%. CVP increased by 30%, while GEDVi remained at baseline values. Calculated Ea, TAC and SVRi also remained unchanged (Table 3).
When only one intervention per patient was consid-ered, PLR and volume expansion did not modify femo-ral dP/dtmax (1161 [858–1404] vs. 1218 [1105–1379]
mmHg−1 s−1; n= 14; p= 0.470).
The PLR and volume expansion-induced changes in femoral dP/dtmax presented the highest correlation with
changes in pulse pressure and systolic arterial pressure (Additional file 1: Table S3).
Discussion
The present study evaluated changes in pulse contour analysis-derived femoral dP/dtmax following
haemody-namic interventions aimed at modifying LV systolic func-tion and LV loading condifunc-tions (afterload and preload)
Fig. 1 Changes in femoral dP/dtmax. Femoral dP/dtmax before and after clinical interventions. Skewers indicate minimum and maximum value. NE
norepinephrine, DBT dobutamine, VE/PLR volume expansion, passive leg raising. *p < 0.05; **p < 0.01
in critically ill patients with acute circulatory failure. Changes in femoral dP/dtmax were strongly and
consist-ently correlated with changes in arterial pressure wave-form determinants across all interventions (arterial systolic pressure and pulse pressure). While femoral dP/ dtmax changed during dobutamine infusion, thus
suggest-ing a certain degree of relation with LV systolic function, femoral dP/dtmax also changed during norepinephrine
dose variations and was correlated with changes in arte-rial systolic pressure, pulse pressure, TAC and Ea. Our results suggest that femoral dP/dtmax was mainly
sensi-tive to ventricular loading conditions, specifically after-load, due to arterial load variations, and highly linked to changes in arterial pressure waveform, thus making it an unreliable tool to estimate LV systolic function in acute circulatory failure.
Femoral dP/dtmax and LV systolic function
Pulse contour analysis is used at the bedside for esti-mating several haemodynamic variables. In particular, the arterial dP/dtmax is automatically displayed and is
thought by many to be an indicator of LV systolic func-tion. As expected, femoral dP/dtmax changed following
dobutamine increases and decreases and was related to the direction and magnitude of the dose variation. Fur-thermore, although LVEF and CFI are not pure estima-tors of LV systolic function, femoral dP/dtmax changed
coherently with these markers during dobutamine dose variations. Note that we assessed the LV systolic func-tion not only with CFI, which is only an estimafunc-tion of LVEF and which might be mathematically coupled with GEDVi [23], but also more directly, with LVEF measured by echocardiography. These results would suggest that femoral dP/dtmax retains a certain degree of relationship
with LV systolic function. Also, it has been previously observed in animal models that LV dP/dtmax reflects
car-diac contractility when adequate LV filling is achieved [24, 25]. In our study, femoral dP/dtmax remained
unchanged during VE or PLR, which could be explained by an optimised LV preload status at the time of the intervention. This finding would suggest that, similarly to what has been previously observed [24, 25], femoral dP/ dtmax is independent from cardiac preload changes, as it
would be expected from a marker of LV systolic function.
Femoral dP/dtmax, LV afterload and arterial load
Our results also indicated that femoral dP/dtmax is
mark-edly influenced by changes in LV afterload (as estimated by changes in systolic and mean arterial pressure) during changes in the dose of norepinephrine. Unlike LV dP/ dtmax, which is measured during the isovolumetric phase
of LV contraction before aortic valve opening [2], femo-ral dP/dtmax takes place during the LV ejection phase
and should therefore be more sensitive to changes in LV afterload. Our results support this hypothesis by evidenc-ing not only significant changes in femoral dP/dtmax
dur-ing changes in norepinephrine dose, but also significant correlations between changes in femoral dP/dtmax and
changes in systolic and mean arterial pressure during such interventions. This demonstrates a dependence of femoral dP/dtmax with LV afterload, which may invalidate
its utility as a marker of LV systolic function.
An interesting additional finding of the present study was the strong linear correlation observed between determinants of the arterial pressure waveform and fem-oral dP/dtmax. Our results indicate that femoral dP/dtmax
maintained an almost one-to-one relationship with arte-rial pulse pressure and systolic artearte-rial pressure, meaning that any change in the latter inevitably led to a change in the former. In other words, the higher the amplitude of the arterial waveform, the higher the velocity of the pres-sure increase, provided that heart rate remains almost constant and vice versa (constant cardiac cycle dura-tion). As observed in our results, this relationship was strong and was observed even in cases where arterial loading conditions remained unchanged, such as during volume expansion and PLR. Therefore, any haemody-namic change affecting pulse pressure and systolic arte-rial pressure should, in principle, affect femoral dP/dtmax
without any corresponding changes in LV contractility. It has been previously described that arterial system com-pliance, pulse wave reflection and arterial system imped-ance affect the peripheral arterial waveform [26–29]. We did not study pulse reflection waves in our patients, but we were able to confirm this hypothesis in our study by identifying a strong correlation of femoral dP/dtmax with
determinants of arterial load (as estimated by Ea, TAC and SVRi) during norepinephrine dose variations.
Femoral dP/dtmax in clinical practice
Our study challenges the previous belief that femoral dP/dtmax could be used as a reliable marker of LV
sys-tolic function at the bedside. This belief was based on the observed good correlation between LV and arterial dP/dtmax during periods of haemodynamic stability [7, 9,
12]. However, correlations alone lack the sufficient value to inform on the responses of femoral dP/dtmax to
treat-ments during cardiovascular failure. The evaluation of dynamic changes during haemodynamic challenges in our study demonstrates that although femoral dP/dtmax is
not completely independent from changes in LV systolic function, it is significantly affected by peripheral arterial properties and waveform characteristics.
Previous reports have also identified a strong relation-ship between femoral dP/dtmax and LV dP/dtmax during
from changes in LV loading conditions [10, 30]. In a recent study on healthy animals, Monge Garcia et al. [31] presented a thorough evaluation of arterial dP/dtmax
and its relation to LV dP/dtmax and other markers of LV
systolic function during changes in cardiac inotropic state, preload and afterload. Authors documented a posi-tive relationship between femoral dP/dtmax and changes
in LV systolic function, but also reported + 24% and
− 33% changes in femoral dP/dtmax during increases or
decreases in LV afterload induced by epinephrine and nitroprusside infusion, respectively, and a 20% reduc-tion in femoral dP/dtmax during acute preload reductions
induced by bleeding. Although authors conclude that the most relevant factor of femoral dP/dtmax was the change
in LV systolic function, these observations also show the relevant effect of loading conditions on femoral dP/dtmax
and corroborate our findings.
Therefore, it is only in cases in which one could reason-ably expect that arterial loading properties and LV after-load are unchanged, that LV systolic function is the only factor modified and that femoral dP/dtmax might be used
as a marker of LV systolic function. It must be admitted that such cases are uncommon in a constantly changing critically ill patient.
Limitations
The present study has some limitations that warrant further discussion. First, the number of cases was small and the inclusion rate slow due to the need for specific recording equipment and need for manual synchronisa-tion between intervensynchronisa-tions and data acquisisynchronisa-tion. Second, we did not compare measurements of femoral dP/dtmax
with LV dP/dtmax. Nevertheless, the objective of the
pre-sent study was to evaluate the responses of femoral dP/ dtmax during haemodynamic challenges, and values of LV
dP/dtmax would not have helped to fulfil such objective.
Furthermore, LV catheterisation for the only purpose of the study would not have been acceptable from an ethi-cal point of view. Alternatively, the estimation of LV dP/ dtmax by echocardiography could have been performed.
However, such an estimation at the bedside in critically ill patients is far from easy and may have provided unreli-able measurements. Third, we did not use any device to evaluate and compensate damping of the arterial pres-sure signal as utilised by previous authors [7]. However, such devices present their highest utility when high reso-lution of the arterial waveform is required, for example, for resonance wave analyses, which was not the case in our study. Furthermore, the absence of under- and over-damping phenomena was checked at the beginning of recordings. Fourth, while repetition of measurements on the same patient could be considered as a source of bias, we obtained the same pattern of responses to clinical
interventions when only one measurement per patient was evaluated. Fifth, in order to obtain better informa-tion of potential causality and to homogeneously spread the interventions across patients, it would have been better to have followed a crossover interventional study design. However, this would have been unethical, since patients would have had to receive intravenous fluids, norepinephrine and dobutamine regardless of any clini-cal indication to receive such treatments. Sixth, respira-tory cycle variations may alter LVEF. This potential source of bias was not taken into account when perform-ing measurements. However, LVEF measurements were averaged over three cardiac cycles, which attenuated any respiratory variation. Furthermore, measurements were obtained during periods of haemodynamic stability and under controlled mechanical ventilation or non-dis-tressed spontaneous ventilation, such that the respira-tory variation of LVEF was probably negligible. Finally, a potential mathematical coupling between the measure-ment of femoral dP/dtmax and systolic arterial pressure
or pulse pressure could be a point of concern. However, with the PiCCO2 device used in our study, femoral dP/ dtmax was calculated at the moment of maximal pressure
rise in the systolic phase of the arterial curve and was not averaged during a time segment of the curve. This approach likely discarded any potential mathematical coupling.
Conclusions
Femoral dP/dtmax calculated by pulse contour analysis
is an unreliable estimate of LV systolic function as it is markedly sensitive to LV afterload variations and changes in arterial loading properties during acute changes in norepinephrine, and directly linked to arterial waveform characteristics.
Additional file
Additional file 1. This file contains a patient and interventions flow chart, additional information on population characteristics, pre‑ and post‑inter‑ vention values of haemodynamic variables for the norepinephrine and dobutamine groups, as well as a correlation matrix between femoral dP/ dtmax and other haemodynamic variables during studied interventions.
Abbreviations
LV: left ventricle; PLR: passive leg raising; LVEF: left ventricle ejection fraction; CI: cardiac index; SVI: stroke volume index; GEDVi: global end‑diastolic volume index; SVRi: systemic vascular resistance index; TAC : total arterial compliance; Ea: effective arterial elastance; CVP: central venous pressure; SD: standard deviation.
Acknowledgements
Authors’ contributions
SV designed the study, collected data, analysed results and wrote the manu‑ script. DC and XM analysed results and reviewed the manuscript. JLT reviewed the manuscript. UA and FC collected data and reviewed the manuscript. JCO provided statistical expertise and reviewed results and the manuscript. AO, AA and FB all reviewed the manuscript. XM and FB also oversaw the develop‑ ment of the study and mentored SV. All authors read and approved the final manuscript.
Funding
This study was supported by the clinical institutions in which it was devel‑ oped. The research team performed this study as part of their regular clinical work.
Availability of data and materials
The datasets used and/or analysed during the current study are available from the corresponding author upon request.
Ethics approval and consent to participate
This study was approved by local ethics committees of both participating institutions (Comitè Ètic d’Investigació Clínica de la Corporació Sanitària Parc Taulí CEIC2013616 and Comité pour la Protection des Personnes Ile‑de‑France VII 2011A01696‑35). All patients or next of kin gave their consent to participate to the study.
Consent for publication
Not applicable
Competing interests
Profs. XM and JLT are members of the medical advisory board of Pulsion Medi‑ cal Systems. The remaining authors declare no conflicts of interest.
Author details
1 Servei de Medicina Intensiva, Centre de Crítics, Corporació Sanitària Universitària Parc Taulí, Parc Taulí 1, 08208 Sabadell, Spain. 2 Departament de Medicina, Facultat de Medicina, Universitat Autònoma de Barcelona, Passeig de la Vall d´Hebron 119, 08035 Barcelona, Spain. 3 Service de réanimation‑médecine intensive, Hôpital Bicêtre, AP‑HP, Hôpitaux universi‑ taires Paris‑Sud, 78, rue du Général Leclerc, 94270 Le Kremlin‑Bicêtre, France. 4 INSERM‑UMR_S999 LabEx – LERMIT, Hôpital Marie‑Lannelongue, 92350 Le Plessis‑Robinson, France. 5 Service d’explorations fonctionnelles multidiscipli‑ naires bi‑site Béclère‑Bicêtre, AP‑HP, Hôpitaux universitaires Paris‑Sud, 78, rue du Général Leclerc, 94270 Le Kremlin‑Bicêtre, France. 6 Fundació Parc Taulí, Parc Taulí University Institute, Parc Taulí 1, 08208 Sabadell, Spain. 7 Corporacion Sanitaria Universitaria Parc Tauli, CIBER de Enfermedades Respitatorias, Insti‑ tuto Carlos III, Universitat Autònoma de Barcelona, Parc Taulí 1, 08208 Sabadell, Spain.
Received: 30 October 2018 Accepted: 23 May 2019
References
1. Teboul J‑L, Saugel B, Cecconi M, et al. Less invasive hemodynamic moni‑ toring in critically ill patients. Intensive Care Med. 2016;42:1350–9. 2. Quinones M, Gaasch WH, Alexander JK. Influence of acute changes
in preload, afterload, contractile state and heart rate on ejection and isovolumic indices of myocardial contractility in man. Circulation. 1976;53:293–302.
3. Bargiggia GS, Bertucci C, Recusani F, et al. A new method for estimating left ventricular dP/dt by continuous wave Doppler‑echocardiography. Validation studies at cardiac catheterization. Circulation. 1989;80:1287–92. 4. Chen C, Rodriguez L, Guerrero JL, et al. Noninvasive estimation of the
instantaneous first derivative of left ventricular pressure using continu‑ ous‑wave Doppler echocardiography. Circulation. 1991;83:2101–10. 5. Chen C, Rodriguez L, Lethor JP, et al. Continuous wave Doppler echo‑
cardiography for noninvasive assessment of left ventricular dP/dt and relaxation time constant from mitral regurgitant spectra in patients. J Am Coll Cardiol. 1994;23:970–6.
6. Sugawara M, Senda S, Katayama H, et al. Noninvasive estimation of left ventricular Max(dP/dt) from aortic flow acceleration and pulse wave velocity. Echocardiography. 1994;11:377–84.
7. Scolletta S, Bodson L, Donadello K, et al. Assessment of left ventricular function by pulse wave analysis in critically ill patients. Intensive Care Med. 2013;39:1025–33.
8. Yang F, Iacobelli R, Ming J, et al. Assessment of cardiac function in infants with transposition of the great arteries after surgery: comparison of two methods. World J Pediatr. 2018;14:373–7.
9. Tartiere J‑M, Logeart D, Beauvais F, et al. Non‑invasive radial pulse wave assessment for the evaluation of left ventricular systolic performance in heart failure. Eur J Heart Fail. 2007;9:477–83.
10. De Hert SG, Robert D, Cromheecke S, et al. Evaluation of left ventricular function in anesthetized patients using femoral artery dP/dt(max). J Cardiothorac Vasc Anesth. 2006;20:325–30.
11. Tartière JM, Tabet JY, Logeart D, et al. Noninvasively determined radial dP/dt is a predictor of mortality in patients with heart failure. Am Heart J. 2008;155:758–63.
12. Kim J, Bang J, Park CS, et al. Usefulness of the maximum rate of pressure rise in the central and peripheral arteries after weaning from cardio‑ pulmonary bypass in pediatric congenital heart surgery. Medicine (Baltimore). 2016;95:e5405.
13. Sharman JE, Qasem AM, Hanekom L, et al. Radial pressure waveform dP/ dt max is a poor indicator of left ventricular systolic function. Eur J Clin Invest. 2007;37:276–81.
14. Monnet X, Teboul J‑L. Passive leg raising: five rules, not a drop of fluid! Crit Care. 2015;19:18.
15. Von Elm E, Altman DG, Egger M, et al. The strengthening the reporting of observational studies in epidemiology (STROBE) statement: guidelines for reporting observational studies. Ann Intern Med. 2007;147:1453–7. 16. Hofkens P‑J, Verrijcken A, Merveille K, et al. Common pitfalls and tips and
tricks to get the most out of your transpulmonary thermodilution device: results of a survey and state‑of‑the‑art review. Anestezjol Intens Ter. 2015;47:89–116.
17. Monnet X, Persichini R, Ktari M, et al. Precision of the transpulmonary thermodilution measurements. Crit Care. 2011;15:R204.
18. Monnet X, Teboul J‑L. Transpulmonary thermodilution: advantages and limits. Crit Care. 2017;21:147.
19. Jabot J, Monnet X, Bouchra L, et al. Cardiac function index provided by transpulmonary thermodilution behaves as an indicator of left ventricular systolic function. Crit Care Med. 2009;37:2913–8.
20. Chemla D, Hébert JL, Coirault C, et al. Total arterial compliance estimated by stroke volume‑to‑aortic pulse pressure ratio in humans. Am J Physiol. 1998;274:H500–5.
21. Chemla D, Antony I, Lecarpentier Y, et al. Contribution of systemic vascu‑ lar resistance and total arterial compliance to effective arterial elastance in humans. Am J Physiol. 2003;285:H614–20.
22. Malbrain MLNG, Van Regenmortel N, Saugel B, et al. Principles of fluid management and stewardship in septic shock: it is time to consider the four D’s and the four phases of fluid therapy. Ann Intensive Care. 2018;8:66.
23. Malbrain MLNG, De Potter TJR, Dits H, et al. Global and right ventricular end‑diastolic volumes correlate better with preload after correction for ejection fraction. Acta Anaesthesiol Scand. 2010;54:622–31.
24. Morimont P, Lambermont B, Desaive T, et al. Arterial dP/dt max accurately reflects left ventricular contractility during shock when adequate vascular filling is achieved. BMC Cardiovasc Disord. 2012;12:13.
25. Blaudszun G, Licker MJ, Morel DR. Preload‑adjusted left ventricular dP/dt
max: a sensitive, continuous, load‑independent contractility index. Exp Physiol. 2013;98:1446–56.
26. Klabunde RE. Cardiovascular physiology concepts. 2nd ed. Philadelphia: Lippincott Williams & Wilkins; 2012.
27. William MDG, Baim DS. Grossman’s cardiac catheterization, angiography, and intervention, 6th ed; 2000.
28. Lamia B, Chemla D, Richard C, et al. Clinical review: interpretation of arte‑ rial pressure wave in shock states. Crit Care. 2005;9:601.
29. Hashimoto J, Ito S. Pulse pressure amplification, arterial stiffness, and peripheral wave reflection determine pulsatile flow waveform of the femoral artery. Hypertension. 2010;56:926–33.
Implication for ventricular‑vascular interaction with the potential for noninvasive determination of left ventricular contractility. Circ J. 2009;73:1698–704.
31. Garcia MI, et al. Performance comparison of ventricular and arterial dP/ dt max for assessing left ventricular systolic function during different experimental loading and contractile conditions. Crit Care. 2018;22:325.
Publisher’s Note