Revised Version 2 July 2008
Geometries of Third-Row Transition-Metal Complexes from Density-Functional Theory.
Michael Bühl,*a Christoph Reimann,b Dimitrios A. Pantazis,b Thomas Bredow,b Frank Neese*b School of Chemistry, North Haugh, University of St. Andrews, St. Andrews, Fife KY16 9ST, UK, Fax: +(44)(0)1334 463808, E-mail: [email protected]
Universität Bonn, Institut für Physikalische und Theoretische Chemie, Wegelerstr. 12, D-53115 Bonn, Germany, FAX: +(49) 228/73-9064 E-Mail: [email protected]
Abstract
A set of 41 metal-ligand bond distances in 25 third-row transition-metal complexes, for which precise structural data are known in the gas phase, is used to assess optimized and zero-point averaged geometries obtained from DFT computations with various exchange-correlation functionals and basis sets. For a given functional (except LSDA) Stuttgart-type quasi-relativistic effective core potentials and an all-electron scalar relativistic approach (ZORA) tend to produce very similar geometries. In contrast to the lighter congeners, LSDA affords reasonably accurate geometries of 5d-metal complexes, as it is among the functionals with the lowest mean and standard deviations from experiment. For this set the ranking of some other popular density functionals, ordered according to decreasing standard deviation, is BLYP > VSXC > BP86 ≈ BPW91 ≈ TPSS ≈ B3LYP ≈ PBE > TPSSh > B3PW91 ≈ B3P86 ≈ PBE hybrid. In this case hybrid functionals are superior to their non-hybrid variants. In addition, we have re-investigated the previous test sets for 3d- (Bühl M.; Kabrede, H. J. Chem. Theory Comput.2006, 2, 1282-1290) and 4d- (Waller, M. P.; Bühl, M. J. Comp. Chem. 2007, 28, 1531–1537) transition metal complexes using all-electron scalar relativistic DFT calculations in addition to the published non-relativistic and ECP results. For this combined test set comprising first-, second-, and third-row metal complexes, B3P86 and PBE hybrid are indicated to perform best. A remarkably consistent standard deviation of around 2 pm in metal-ligand bond distances is achieved over the entire set of d-block elements.
Introduction
Quantum-chemical calculations require additional approximations to account for relativistic effects when heavier atoms are present. One of the most popular of these approximations is the pseudo-potential or effective core pseudo-potential (ECP) approach,1 where the innermost electrons are not treated explicitly, but subsumed into a specially designed, mean potential acting upon the outer electrons. This ECP can be adjusted numerically such as to account for the leading scalar relativistic effects in the core region even in an otherwise non-relativistic calculation. Pseudopotentials have fertilized many fields of applied theoretical chemistry, and are now in widespread use.
Initially designed at the Hartree-Fock level, ECPs and their corresponding valence basis sets were readily embraced by the ever growing community that uses density functional theory (DFT) in its many flavors. Computational transition-metal chemistry in particular has benefited a lot from this development.2 From the competing brands of ECPs, two suppliers appear to dominate this market, namely the Hay-Wadt3 and Stuttgart-Dresden4 variants,1 both of which have performed very well in countless validation studies. In contrast, the choice of a suitable exchange-correlation functional from the plethora of vendors is more difficult, firstly because of the vast supply of such functionals, and secondly, because their performance may strongly depend on the particular application.
Regardless of their nature, such applications need accurate molecular structures as inputs. We have become interested in assessing the ability of modern DFT methods to reproduce gas-phase
geometries of transition-metal complexes in a straightforward, consistent manner. For this purpose, we selected sizeable test sets of target molecules, for which reasonably precise and, presumably, accurate structural data is available from gas-phase electron diffraction (GED) or microwave (MW) spectroscopy. In the spirit of Helgaker et al,5,6 the performance of several density-functional/basis-set combinations is assessed by correlating computed with experimental bond distances and
analyzing the resulting mean and standard deviations. Only bond distances refined experimentally to a precision better than 1 pm are included in this analysis. We have previously reported such
assessments for first-7 and second-row8 transition metal complexes, which have revealed subtle differences in the performance of standard density functionals for these two sets. We now extend these studies to complexes from the third transition row. This now allows comprehensive
Not only quantum-chemical models such as specific exchange-correlation functionals can be tested this way, but also the approximations made to account for relativity. There is growing interest to go beyond the ECP model and to describe all electrons in an explicit relativistic treatment. While full four-component relativistic calculations are still extremely involved and feasible only for atoms and the smallest molecules, two-component variants have evolved to a point that allows their rather routine application to sizeable systems. In practice, unless the elements are very heavy the effect of spin-orbit coupling on molecular geometries is limited.9,10 This suggests that more straightforward and computationally less involved one-component scalar relativistic approaches are the methods of choice for all-electron calculations on third-row transition metals. The advantages of all-electron treatments are obvious if total electron densities are to be computed11 or – in particular – if spectroscopic properties are computed that depend on the inner-shell electrons or the nodal
properties of the valence orbitals. This concerns for example X-ray absorption,12 Mössbauer13 and nuclear magnetic14 or electron paramagnetic resonance15,16 properties. However, rather special basis sets must be used in all-electron scalar relativistic calculations that are consistent with the
relativistic treatment invoked. Such special basis sets have been designed previously for
calculations within the Douglas-Kroll-Hess (DKH)17 or the zero’th order regular approximation (ZORA)9,18 treatments. However, as far as Gaussian basis sets are concerned, these basis sets are generally contracted and therefore computationally expensive. We have therefore recently reported a series of segmented all electron relativistic (SARC) basis sets for third row transition metals that can be applied together with the DKH2 and ZORA approaches.19 Atoms from the first three rows are treated with relativistic recontractions of the Karlsruhe split valence (SV), triple-zeta valence (TZV) or quadruple-zeta valence (QZVP) all-electron basis sets.20,21,22
In ref 19 test calculations for geometries of small transition metal hydrides, ionization potentials and binding energies were calculated with the new basis sets and either B3LYP density functional or coupled-cluster with single-, double- and perturbative triple excitations (CCSD(T)) methods. Here we take the opportunity to compare the performance of all-electron scalar relativistic DFT
Scheme 1 Hf Cl Cl Cl Cl Ta CH2
H2C
F F B H H H B H H H B H H H H H H M Y
X X X
M=W,Re,Os X=F,Cl Y=O,S Ta Cl Cl Cl Cl Cl Re CH3 O O O Os C C OC CO CO O O W CH3 CH3
H3C
H3C
H3C
H3C
W Os CO OC CO OC
H2C CH2
Pt P
F3P
PF3 PF3 M F F F F F
Au CH3 Hg CF3
H
H BH H Hf C H2 H H H F X W C C OC OC CO O O CO H H Re F F F F Re F F F
F Re CH3
HC1
O O C2H
O O Os O O M=Mo,Ir Au CO Cl P
H3C
H3C
H3C
Hg X H3C
X = Cl,CN
F3C
F
F F
Computational Details
Geometries were fully optimized in the given symmetry (as given in Table 1) using Gaussian 0327and several local (LSDA)28 and gradient-corrected density functional combinations as implemented therein. Most functionals are composed of one of several exchange parts, namely Becke (B)29 or Becke hybrid (B3),30 together with one of several correlation parts, namely Perdew (P86),31 Perdew-Wang (PW91),32 or Lee et al. (LYP)33 (in parentheses: symbols used in combined forms). Other functionals comprise HCTH/407 (denoted HCTH),34 the PBE hybrid functional35 (denoted PBE1, Gaussian keyword PBE1PBE, which is often called PBE0), as well as the meta-GGAs VSXC,36 TPSS,37 and TPSS hybrid (denoted TPSSh).38 A fine integration grid (75 radial shells with 302 angular points per shell) has been used, except for VSXC, which has been shown to require finer grids,39 and for WMe6, where spurious imaginary frequencies were found with the default grid; in these cases we used 99 radial shells with 590 angular points. The following
relativistic small-core ECPs with the corresponding valence basis sets were employed on the metals: SDD4 i.e., the Stuttgart-Dresden ECP (together with the [6s5p3d] valence basis) and LANL2DZ3 (with [3s3p2d] valence basis). On the ligands, the 6-31G* basis40 was used, except for Hf(BH4)4 and WCp2H2, where 6-31G** was employed for the ligands with a metal-hydrogen bond. In
addition, we tested Ahlrichs-type valence basis sets that had been designed for the use with the SDD ECPs,41 denoted SVP, TZVP, and QZVP (with [5s3p2d1f], [6s4p3d1f], and [7s5p4d3f1g]
contractions for the metals, respectively), together with the corresponding all-electron bases on the ligands.20,21,22 The minimum character of all optimized structures was verified by evaluation of the harmonic vibrational frequencies at the BP86/SDD level. Closed- and open-shell species were treated with restricted and unrestricted formalisms, respectively. For the computation of effective geometries via the cubic force field, the Barone method25 was invoked at the BP86/SDD level within Gaussian 03 rev D.01.27 The default values were used for step size in the numerical differentiation (0.025Å) and integration grid (SG1).
Grimme44 has been studied for BP86, PBE, TPSS, and B3LYP. In all ZORA calculations, the recently published SARC basis sets19 of TZVP quality has been used for the third-row transition metals, and SARC recontractions of the Karlsruhe TZVP basis set for the lighter atoms. For two molecules (ReOCl4 and IrF6), spin-unrestricted open-shell calculations have been performed.
Results and Discussion Selection of reference values.
In addition to the precision criterion mentioned in the introduction, we limited our selection to molecules measured at room temperature or slightly above. In some cases, not all degrees of freedom have been refined experimentally, or only mean values for formally non-equivalent distances are known to the desired precision. In those cases, we evaluated and assessed the same average of the corresponding optimized parameters, even though full geometry optimizations were performed. This applies to Os(CO)5 and WMe6. The GED data of the latter were initially refined assuming equal W-C distances; later it was shown that this molecule adopts a structure with lower symmetry and two sets of non-equivalent W-C bonds.53 Allowing for fluxional behavior in the gas phase, the refined mean value is probably sufficiently precise. Another such case is TaCl5, where two GED studies48a,b have reported almost identical mean values of equatorial and axial bonds, but disagree markedly on their difference (which varies between 4.7 pm48a and 14.2 pm48b). It is probably the fluxional behavior of this molecule with its very low Berry pseudo-rotation barrier48b that makes the actual precision of the individual bond distances somewhat lower than suggested by the quoted standard deviations (which are all well below our target value). Thus, we only discuss the mean Ta-Cl distance in this case, as this appears to be refined reasonably well and in a
reproducible manner. Pt(PF3)4 is also indicated to be fluxional, since the GED data have been found to be consistent with free rotation about the Pt-P bond.64 Both staggered and eclipsed conformations turned out to be minima at the BP86(SDD) level, with marginal differences in the optimized bond distances. We employed the slightly more stable eclipsed form45 throughout this study.
The final selected experimental parameters are collected in Table 1. Most distances are ra or rα
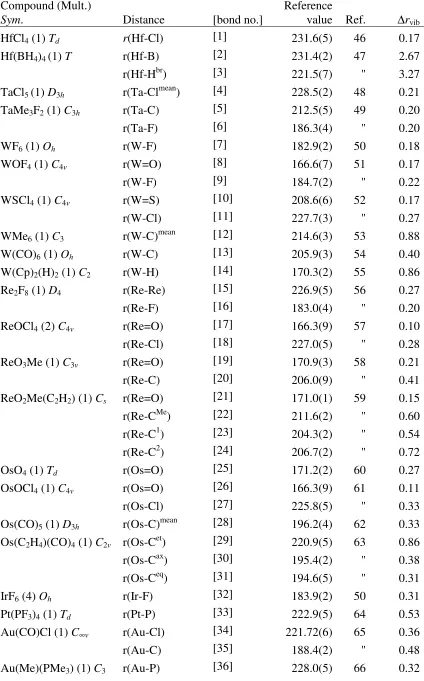
Table 1: Bond lengths r (in pm) of third-row transition-metal complexes in the gas phase.a Unless otherwise noted, raor rα values from GED are given.
Compound (Mult.)
Sym. Distance [bond no.]
Reference
value Ref. ∆rvib
HfCl4 (1) Td r(Hf-Cl) [1] 231.6(5) 46 0.17
Hf(BH4)4 (1) T r(Hf-B) [2] 231.4(2) 47 2.67
r(Hf-Hbr) [3] 221.5(7) " 3.27
TaCl5 (1) D3h r(Ta-Clmean) [4] 228.5(2) 48 0.21
TaMe3F2 (1) C3h r(Ta-C) [5] 212.5(5) 49 0.20
r(Ta-F) [6] 186.3(4) " 0.20
WF6 (1) Oh r(W-F) [7] 182.9(2) 50 0.18
WOF4 (1) C4v r(W=O) [8] 166.6(7) 51 0.17
r(W-F) [9] 184.7(2) " 0.22
WSCl4 (1) C4v r(W=S) [10] 208.6(6) 52 0.17
r(W-Cl) [11] 227.7(3) " 0.27
WMe6 (1) C3 r(W-C)mean [12] 214.6(3) 53 0.88
W(CO)6 (1) Oh r(W-C) [13] 205.9(3) 54 0.40
W(Cp)2(H)2 (1) C2 r(W-H) [14] 170.3(2) 55 0.86
Re2F8 (1) D4 r(Re-Re) [15] 226.9(5) 56 0.27
r(Re-F) [16] 183.0(4) " 0.20
ReOCl4 (2) C4v r(Re=O) [17] 166.3(9) 57 0.10
r(Re-Cl) [18] 227.0(5) " 0.28
ReO3Me (1) C3v r(Re=O) [19] 170.9(3) 58 0.21
r(Re-C) [20] 206.0(9) " 0.41
ReO2Me(C2H2) (1) Cs r(Re=O) [21] 171.0(1) 59 0.15 r(Re-CMe) [22] 211.6(2) " 0.60
r(Re-C1) [23] 204.3(2) " 0.54
r(Re-C2) [24] 206.7(2) " 0.72
OsO4 (1) Td r(Os=O) [25] 171.2(2) 60 0.27
OsOCl4 (1) C4v r(Os=O) [26] 166.3(9) 61 0.11
r(Os-Cl) [27] 225.8(5) " 0.33
Os(CO)5 (1) D3h r(Os-C)mean [28] 196.2(4) 62 0.33 Os(C2H4)(CO)4 (1) C2v r(Os-Cet) [29] 220.9(5) 63 0.86 r(Os-Cax) [30] 195.4(2) " 0.38 r(Os-Ceq) [31] 194.6(5) " 0.31
IrF6 (4) Oh r(Ir-F) [32] 183.9(2) 50 0.31
Pt(PF3)4 (1) Td r(Pt-P) [33] 222.9(5) 64 0.53
Au(CO)Cl (1) C∞v r(Au-Cl) [34] 221.72(6) 65 0.36
r(Au-C) [35] 188.4(2) " 0.48
Hg(Me)Cl (1) C3v r(Hg-Cl) [37] 228.5(3) 67 0.35
r(Hg-C) [38] 205.2(5) " 0.49
Hg(CF3)2 (1) D3 r(Hg-C) [39] 210.6(5) 68 0.40
Hg(Me)(CN) (1) C3v r(Hg-CCN) [40] 203.69(2) 69 0.39 r(Hg-CMe) [41] 205.63(1) " 0.43
[image:8.595.53.547.279.781.2]a(in parentheses: multiplicity) ax = axial, br = bridging, Cp = cyclopentadienyl; eq = equatorial. et = ethylene.
Table 2. Statistical assessment of equilibrium (re) and effective (reff) metal-ligand bond distances computed for the test set in Scheme 1 at a number of levels of theory. All values are in picometers relative to experimentally reported values (rexp).a
Entry Functional ECP/
Basis Setb Dequil | | equil
D Dstdequil c Dmaxequil eff
D Dstdeff
1 LSDA SDD -0.26 1.56 2.10 (1.46) -8.7 [3] 0.23 1.70
2 PBE1 SDD 1.07 1.67 2.07 (1.58) 5.8 [36] 1.56 1.76
3 B3P86 SDD 1.32 1.83 2.09 (1.53) -7.7 [3] 1.81 1.75
4 B3PW91 SDD 1.64 2.05 2.11 (1.60) -7.1 [3] 2.13 1.80
5 TPSSh SDD 2.24 2.66 2.25 (1.53) -8.2 [3] 2.72 1.88
6 PBE SDD 2.76 3.06 2.17 (1.69) 6.9 [36] 3.25 1.82
7 B3LYP SDD 2.92 3.22 2.43 (1.97) 9.6 [36] 3.41 2.18
8 TPSS SDD 2.94 3.33 2.33 (1.59) -7.8 [3] 3.43 1.94
9 BPW91 SDD 3.05 3.34 2.24 (1.74) 7.6 [36] 3.54 1.90
10 BP86 SDD 3.10 3.39 2.21 (1.69) 7.5 [36] 3.59 1.87
11 VSXC SDD 3.23 3.56 2.51 (1.95) 9.4 [36] 3.72 2.22
12 BLYP SDD 4.78 5.01 2.63 (2.19) 11.6 [36] 5.27 2.37
13 BP86 LANL2DZ 3.94 4.50 6.09 (5.87) 21.0 [39] 4.43 5.94
14 BP86 LANL2DZd 5.82 6.33 6.56 (6.39) 21.3 [37] 6.31 6.40
15 BP86 SDD/SVPe 2.78 3.06 2.17 (1.71) 8.0 [36] 3.27 1.90
16 BP86 SDD/TZVPe 2.33 2.67 2.21 (1.68) -6.7 [3] 2.82 1.91
17 BP86 SDD/QZVPe 1.89 2.22 1.94 (1.37) -6.8 [3] 2.37 1.63
18 B3P86 SDD/SVPe 0.97 1.85 2.23 (1.79) -7.5 [3] 1.46 2.00
19 B3P86 SDD/TZVPe 0.49 1.56 2.15 (1.63) -8.4 [3] 0.97 1.88
20 PBE1/ SDD/SVPe 0.69 1.74 2.23 (1.85) -7.3 [3] 1.18 2.02
21 PBE1 SDD/TZVPe 0.18 1.48 2.12 (1.66) -8.2 [3] 0.67 1.87
22 PBE1 SDD/QZVPe -0.23 1.26 1.90 (1.42) -8.3 [3] 0.26 1.66
23 LSDA SDD/QZVP -1.49 1.77 1.93 (1.45) -9.9 [3] -0.99 1.56
25 PBE1 ZORA/TZVP -0.50 1.53 2.21 (1.66) -9.7 [3] -0.02 1.90
26 B3P86 ZORA/TZVP 0.04 1.60 2.28 (1.69) -9.6 [3] 0.53 1.96
27 B3PW91 ZORA/TZVP 0.07 1.63 2.27 (1.71) -9.4 [3] 0.56 1.97
28 TPSSh ZORA/TZVP 0.56 1.72 2.45 (1.67) -10.7 [3] 1.05 2.08
29 PBE ZORA/TZVP 1.26 2.08 2.32 (1.74) -8.5 [3] 1.75 1.97
30 B3LYP ZORA/TZVP 1.50 2.29 2.60 (2.09) -8.3 [3] 1.99 2.34
31 TPSS ZORA/TZVP 1.29 2.08 2.52 (1.70) -10.4 [3] 1.78 2.13
32 BPW91 ZORA/TZVP 1.52 2.22 2.38 (1.80) -8.4 [3] 2.01 2.04
33 BP86 ZORA/TZVP 1.50 2.20 2.39 (1.78) -8.6 [3] 1.99 2.04
34 BLYP ZORA/TZVP 3.45 3.79 2.79 (2.27) 9.1 [36] 3.93 2.52
35 PBE+VdW ZORA/TZVP 1.14 2.12 2.49 (1.82) -9.6 [3] 1.63 2.09
36 B3LYP+VdW ZORA/TZVP 1.34 2.31 2.78 (2.15) -9.9 [3] 1.83 2.47
37 TPSS+VdW ZORA/TZVP 1.12 2.10 2.74 (1.80) -11.9 [3] 1.61 2.31
38 BP86+VdW ZORA/TZVP 1.32 2.23 2.61 (1.87) -10.2 [3] 1.81 2.20
39 BLYP+VdW ZORA/TZVP 3.25 3.77 3.03 (2.38) 8.8 [36] 3.73 2.69
a equil
D ,|D|equil, equil std
D and Dmaxequil denote mean, mean absolute, standard, and maximum absolute deviations,respectively, for the equilibrium geometries, eff
D and Dstdeff the corresponding deviations for the zero-point averaged, effective geometries. In square brackets: bond numbers from Table 1 for which the maximum error occurs. b 6-31G* basis for the ligands, except where otherwise noted. c in parentheses: standard deviations for geometries excluding bond no. 3 (see text). dD95 for the ligands. eThe corresponding Ahlrichs basis sets are used on the ligands.
Performance of the ECP models.
Individual distances optimized with the various density-functional/ECP/basis-set combinations are given as Supporting Information (SI). The resulting statistical assessment, that is, the mean and standard deviations from the reference data in Table 1, are summarized in Table 2 ( equil
D and Dstdequil values, respectively). Deviations are defined as rcalc - rexp, such that positive mean deviations denote overestimation of the bond lengths by DFT. In addition, the mean absolute and the maximum errors to either side are included in Table 2 (labelled | |equil
assess the effect of this bond on the overall statistics, we also provide equil std
D values where this bond has been removed from the data set (values in parentheses in Table 2).
First, all functionals were tested with the SDD ECP and valence basis on the metal and 6-31G* basis on the ligands (entries 1 - 12 in Table 2, arranged in the order of increasing mean deviation). Next, another ECP and/or other basis sets were employed for selected functionals, notably BP86 (for comparison with the results for the first and second transition rows), B3P86 and PBE1.
Following the procedure of our previous studies, effective geometries were then computed at the BP86/SDD level, via numerical computation of the cubic force field using the method of Barone et al. This affords incremental corrections to the bond distances, ∆rvib (given in the last column of Table 1), leading from the equilibrium values re to the zero-point averaged ones, rg0. Arguably, the latter are better suited for direct comparison to the experimental, thermally averaged distances than the former. Actually, there is evidence for small first-row molecules that the zero-point motion affords the largest correction to equilibrium distances, and that thermal effects on top of them (i.e. the difference between zero and finite T) tend to be much smaller.71 If this holds also for the
transition-metal complexes, the effective or rg0 geometries should be a quite good approximation to the experimental ra or r0 structures.
Assuming the same extent of transferability between computational levels that has been established in our studies of 3d- and 4d-metal complexes, we have added the ∆rvib values evaluated at the BP86/SDD level to the corresponding equilibrium distances obtained at all other levels and repeated the statistical analysis with respect to the experimental reference data. The corresponding mean and absolute deviations are included in the last two columns in Table 2, labelled eff
D and Dstdeff . The former, mean error is shifted with respect to that of the equilibrium distances, equil
D , by a constant
amount of ca. +0.5 pm. This is because all individual increments (last column in Table 1) are positive, i.e. bonds get longer upon zero-point averaging. The individual increments themselves are quite variable, however, ranging from very small changes for metal-oxo multiple bonds (ca. 0.1 pm), via intermediate values for metal-carbon bonds (up to ca. 0.9 pm), to quite large values for the bonds involving the boranate ligand in Hf(BH4)4, where the corrections amount to more than 3 pm for the Hf-H distance (see Table 1). Since this distance appears to be significantly underestimated in most equilibrium geometries (see SI and maxequil
significantly reduces the error for this bond, thereby leading to noticeable improvements in the standard deviations (compare equil
std
D and Dstdeff values in Table 2).
The following conclusions can be drawn from our results for the 5d-metal complexes:
- In conjunction with SDD and 6-31G* basis, LSDA outperforms all other functionals. It has the smallest mean deviation close to zero for both equilibrium and effective geometries, and one of the smallest standard deviations (entry 1 in Table 2). This observation is in marked contrast to the first- and second-row transition-metal complexes, where the tendency of LSDA to overbind translates into optimized (or effective) distances that are much too short.
- Hybrid functionals are consistently superior to GGAs and meta-GGAs, except for B3LYP, which is surpassed by PBE, and more or less matched by a number of other standard GGAs such as BPW91 or BP86. The two most promising hybrid functionals are PBE1 and B3P86.
- BLYP and the meta-GGA VSXC produce some of the largest mean and standard deviations, and cannot be recommended, consistent with our findings for the lighter metal complexes.
- The LANL2DZ ECPs together with their compact valence bases are inferior to the corresponding SDD variants with their more flexible basis sets. The large errors evident from Table 2 for
LANL2DZ (entry 13) are to a large extent due to some spectacular failures for the linear Hg(II) species in the set (see SI and maxequil
D values in Table 2).72 For the other complexes, the relative performance of LANL2DZ and SDD is less disparate, but the latter is, in general, slightly superior (arguably due to the more flexible valence basis on the metal).73
- Larger basis sets are beneficial. In particular in the Ahlrichs series, the systematic increase of the metal-valence and ligand bases from SVP to TZVP and QZVP is concomitant with a decrease in mean and standard deviations (e.g. with the PBE1 functional, entries 20-22 in Table 2). For LSDA, such a basis-set extension worsens the agreement with experiment somewhat (compare entries 1 and 23 in Table 2), but also at the LSDA/SDD/QZVP level, a very respectable mean error (below 1 pm for eff
The good performance of LSDA for the 5d complexes is noteworthy. The tendency to underestimate metal-ligand bond lengths at that level is most pronounced in the first transition row,7 somewhat alleviated but still noticeable in the second,8 and all but disappeared in the third. This trend seen in the whole sets is also found in individual homologous compounds that are present in all sets, namely the group-4 tetrachlorides and group-8 pentacarbonyls (see selected data in Table S4 in the Supporting Information). For main-group compounds, the ubiquitous overbinding of LSDA does not appear to result in such a pronounced underestimation of bond lengths as found for the 3d-metals (see reference 74 and some illustrative data in Table S5 of the SI).
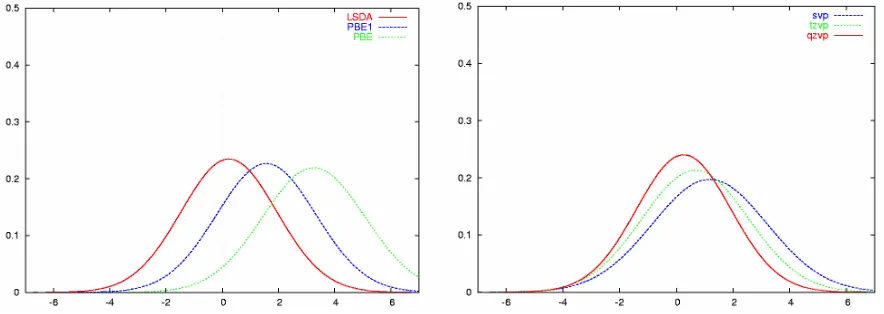
Figure 1: Normal distributions for the errors in the effective bond distances for the test set in Scheme 1. The distributions have been calculated from the mean and standard deviations in Table 2 and are all normalized to one. (a) left: dependence on the density functional using SDD ECP and valence basis (6-31G* on the ligands); (b) right: dependence on the basis set for the PBE1 hybrid functional together with the SDD ECP.
To conclude this section, LSDA and most hybrid functionals are quite robust in reproducing
geometries of third-row transition metal complexes, and tend to be more accurate than pure or meta-GGAs. Except from LSDA, PBE1 affords the lowest mean deviation, and one of the lowest standard deviations, 1.6 and 1.8 pm, respectively, at the SDD level (which are further improved with the larger tzvp and qzvp basis sets). The best GGA is PBE, slightly superior to B3LYP. The perform-ance of these three functionals is shown schematically in Figure 1a, a plot of normalized Gaussian distributions using the corresponding data from Table 2 (analogous to the presentation by Helgaker et al).5,6 Figure 1b illustrates the basis-set dependence for one particular density functional, PBE1, where increase of the basis results in noticeable shifts of the normal distribution, and some
LSDA < PBE1 ≈ B3P86 ≈ B3PW91 < TPSSh < PBE ≈ B3LYP ≈ TPSS ≈ BPW91 ≈ BP86 < VSXC < BLYP
Performance of the all-electron models.
The scalar relativistic results generally show slightly smaller mean deviations than their ECP counterparts (except for LSDA), but the corresponding standard deviations always slightly exceed those of the SDD ECP results. However, for all intents and purposes, the results are very similar since the difference in the standard deviations is merely 0.17 pm on average for all methods. The standard deviation is significantly reduced when the Hf-Hbr bond distance (bond no. 3) is discarded as an outlier (see Table 2, values in parentheses, and the discussion above). The errors for the zero-point averaged effective geometries follow the same trend as described above for the ECP case.
The ranking of the functionals is slightly changed in the all-electron calculations since the LSDA functional now shows the largest mean deviation thus indicating a systematic underestimation of bond distances. However, its standard deviation is still quite small. Consistent with the ECP results, the hybrid functionals B3P86, B3PW91, PBE1 and TPSSh provide the most accurate results, while the performance of B3LYP and BLYP is considerably worse. In fact, B3LYP and BLYP exhibit the largest standard deviations in this set. The GGA and meta-GGA functionals are found to give similar results, with PBE again being superior to TPSS, BP86 and BPW91. The inclusion of the empirical Van der Waals (VdW) corrections does not lead to noticeable improvements in the results in this test set (compare for instance, entries 29 and 35 in Table 2). We have, however, frequently found significantly improved geometries in sterically crowded systems and stacked pi-systems with this correction. Upon adding the zero-point average, the standard deviations are further improved, again in agreement with the ECP results.
Performance of the models for all transition rows
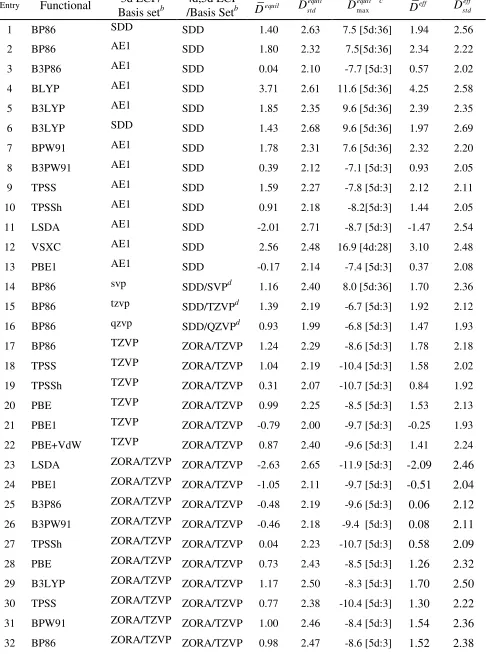
Table 3. Statistical assessment of equilibrium (re) and effective (reff)76 metal-ligand bond distances computed for the combined test sets of all 3d, 4d, and 5d metal complexes at selected levels of theory. All values are in picometers relative to experimentally reported values (rexp).a
Entry Functional 3d ECP/
Basis setb
4d,5d ECP
/Basis Setb Dequil
equil std
D Dmaxequil c eff
D Dstdeff
1 BP86 SDD SDD 1.40 2.63 7.5 [5d:36] 1.94 2.56
2 BP86 AE1 SDD 1.80 2.32 7.5[5d:36] 2.34 2.22
3 B3P86 AE1 SDD 0.04 2.10 -7.7 [5d:3] 0.57 2.02
4 BLYP AE1 SDD 3.71 2.61 11.6 [5d:36] 4.25 2.58
5 B3LYP AE1 SDD 1.85 2.35 9.6 [5d:36] 2.39 2.35
6 B3LYP SDD SDD 1.43 2.68 9.6 [5d:36] 1.97 2.69
7 BPW91 AE1 SDD 1.78 2.31 7.6 [5d:36] 2.32 2.20
8 B3PW91 AE1 SDD 0.39 2.12 -7.1 [5d:3] 0.93 2.05
9 TPSS AE1 SDD 1.59 2.27 -7.8 [5d:3] 2.12 2.11
10 TPSSh AE1 SDD 0.91 2.18 -8.2[5d:3] 1.44 2.05
11 LSDA AE1 SDD -2.01 2.71 -8.7 [5d:3] -1.47 2.54
12 VSXC AE1 SDD 2.56 2.48 16.9 [4d:28] 3.10 2.48
13 PBE1 AE1 SDD -0.17 2.14 -7.4 [5d:3] 0.37 2.08
14 BP86 svp SDD/SVPd 1.16 2.40 8.0 [5d:36] 1.70 2.36
15 BP86 tzvp SDD/TZVPd 1.39 2.19 -6.7 [5d:3] 1.92 2.12
16 BP86 qzvp SDD/QZVPd 0.93 1.99 -6.8 [5d:3] 1.47 1.93
17 BP86 TZVP ZORA/TZVP 1.24 2.29 -8.6 [5d:3] 1.78 2.18
18 TPSS TZVP ZORA/TZVP 1.04 2.19 -10.4 [5d:3] 1.58 2.02
19 TPSSh TZVP ZORA/TZVP 0.31 2.07 -10.7 [5d:3] 0.84 1.92
20 PBE TZVP ZORA/TZVP 0.99 2.25 -8.5 [5d:3] 1.53 2.13
21 PBE1 TZVP ZORA/TZVP -0.79 2.00 -9.7 [5d:3] -0.25 1.93
22 PBE+VdW TZVP ZORA/TZVP 0.87 2.40 -9.6 [5d:3] 1.41 2.24
23 LSDA ZORA/TZVP ZORA/TZVP -2.63 2.65 -11.9 [5d:3] -2.09 2.46
24 PBE1 ZORA/TZVP ZORA/TZVP -1.05 2.11 -9.7 [5d:3] -0.51 2.04
25 B3P86 ZORA/TZVP ZORA/TZVP -0.48 2.19 -9.6 [5d:3] 0.06 2.12
26 B3PW91 ZORA/TZVP ZORA/TZVP -0.46 2.18 -9.4 [5d:3] 0.08 2.11
27 TPSSh ZORA/TZVP ZORA/TZVP 0.04 2.23 -10.7 [5d:3] 0.58 2.09
28 PBE ZORA/TZVP ZORA/TZVP 0.73 2.43 -8.5 [5d:3] 1.26 2.32
29 B3LYP ZORA/TZVP ZORA/TZVP 1.17 2.50 -8.3 [5d:3] 1.70 2.50
30 TPSS ZORA/TZVP ZORA/TZVP 0.77 2.38 -10.4 [5d:3] 1.30 2.22
31 BPW91 ZORA/TZVP ZORA/TZVP 1.00 2.46 -8.4 [5d:3] 1.54 2.36
33 BLYP ZORA/TZVP ZORA/TZVP 3.11 2.86 9.1[5d:36] 3.65 2.83
34 PBE+VdW ZORA/TZVP ZORA/TZVP 0.62 2.56 -9.6 [5d:3] 1.16 2.41
35 B3LYP+VdW ZORA/TZVP ZORA/TZVP 0.92 2.48 -9.9 [5d:3] 1.45 2.40
36 TPSS+VdW ZORA/TZVP ZORA/TZVP 0.54 2.53 -11.9 [5d:3] 1.08 2.31
37 BP86+VdW ZORA/TZVP ZORA/TZVP 0.83 2.61 -10.2 [5d:3] 1.36 2.47
38 BLYP+VdW ZORA/TZVP ZORA/TZVP 2.78 2.83 8.8 [4d:28] 3.32 2.73
a,b,dSee footnotes in Table 2. cIn brackets: transition row and corresponding running bond number from references 7,8, and this work.
Unexpectedly, the standard deviations are somewhat smaller in the all-electron calculations when the 3d-complexes are calculated without relativistic corrections, while the mean errors are superior only for PBE (with and without Van der Waals contributions) and PBE1. The effect of the
relativistic corrections is to decrease the metal-ligand bond distances. According to our experience the nonrelativistic all-electron calculated DFT distances are slightly overestimated in many Werner type complexes.77Hence the scalar relativistic effects will often provide a correction in the right direction. However, for the present set of 3d transition metal complexes this seems not to be the case. By comparing the AE1(3d)/SDD(4d+5d) to TZVP(3d)/ZORA+TZVP(4d+5d) results in Table 3 for the functionals BP86, TPSS, TPSSh and PBE1, the errors are slightly reduced, with the mean deviation of PBE1 being the only exception. For BP86, more combinations of methods and basis sets have been evaluated than for the other functionals. Using ECPs for 3d, 4d and 5d molecules give the largest errors while a scalar relativistic treatment throughout all 3 rows gives the lowest error, but still a rather large standard deviation. The combination AE1(3d)/SDD+tzvp(4d+5d) gives the best standard deviation, while the mean error is slightly larger than the one for the combination TZVP(3d)/ZORA+TZVP(4d+5d).
functionals emerge as being quite robust for the computation of geometries of transition-metal complexes in general.
However, while these functionals do show low mean deviations from experiment (between ca. 0.4 pm - 0.6 pm, eff
D values in Table 3), and have the lowest associated standard deviations of ca. 2
pm (see equil std
D or Dstdeff values in Table 3), the latter values imply a notable scatter of the computed bond distances about the experimental values. For comparison, the accuracy achievable with highly sophisticated ab initio methods for equilibrium bond distances of light main-group compounds is much better (cf. mean and standard deviation around 0.2 and 0.3 pm, respectively, at CCSD(T)/cc-pVQZ).5,6 In this context it should be kept in mind that even reasonably precise GED results for transition metal complexes, which form a major source of the experimental database used in our analyses, need not necessarily be highly accurate. If any decomposition reactions during vapor-ization of the samples go undetected, the observed radial distributions and, thus, the structural parameters derived thereof may be affected noticeably. Thus, the high accuracy achievable for light main-group compounds appears to be out of reach, or at least undetectable, for transition metal complexes. Nevertheless, there appears to be room of improvement for the development of new exchange-correlation functionals for the description of transition-metal complexes.
Conclusions
This work concludes our extended validation study of DFT methods for the prediction of transition metal complex geometries. Together with the data obtained for 3d and 4d transition metal species7,8 a rather comprehensive set of data has been assembled that documents the strengths and weaknesses of modern DFT methods for the prediction of transition metal geometries. It turns out that no single functional is clearly superior to all others and hence, a variety of choices remains possible. Overall, there is a slight advantage of hybrid functionals, especially PBE1 (sometimes also called PBE0) and B3P86 or B3PW91 appear to be the most advantageous choices. Since PBE1 has also been found to perform exceedingly well for many other properties including energetics,78 excitation energies79 or EPR properties,80 it may even be preferred over B3LYP for general chemistry applications.
unpolarized basis sets such as LANL2DZ3 cannot be recommended if it is desired that the results reflect the properties of the functional more than the shortcomings of the basis set used. The
Acknowledgments
M.B. wishes to thank EaStChem for support and H. Früchtl for technical assistance. Computations were performed on a Fujitsu Siemens PC and an Opteron PC cluster at the University of St.
Andrews. We acknowledge financial support by the university of Bonn as well as the SFB 624, the SFB 663 and the priority program 1137. We also thank Mr. Jens Mekelburger for technical
assistance
Supporting Information Available
Bond distances of the 5d test set in Table 1 and of the 3d and 4d test sets, optimized at selected levels, and PBE1/qzvp optimized geometries of the 5d set. This material is available free of charge via the Internet at http://pubs.acs.org.
References
(1) See for instance: Dolg, M., in: Modern Methods and Algorithms of Quantum Chemistry, Proceedings, Second Edition (Ed.: Grotendorst, J.), NIC Series Vol. 3, John von Neumann Institute for Computing, Jülich (Germany), 2000, pp. 507-540
[www.fz-juelich.de/nic-series/Volume3/dolg.pdf], and the extensive bibliography cited therein.
(2) E.g., Frenking, G.; Antes, I.; Böhme, M.; Dapprich, S.; Ehlers, A. W.; Jonas, V.; Neuhaus, A.; Otto, M.; Stegmann, R.; Veldkamp, A.; Vyboishchikov, S. F., in: Reviews in Computational Chemistry, Vol. 8 (Eds.: Lipkowitz, K. B.; Boyd, D. B), VCH Publishers, New York, 1996, pp. 63-144.
(3) Hay P. J.; Wadt, W. R. J. Chem. Phys.1985, 82, 299-310.
(4) Dolg, M.; Wedig, U.; Stoll H.; Preuss, H. J. Chem. Phys.1987, 86, 866-872.
(5) Helgaker, T.; Gauss, J.; Jørgensen, P.; Olsen, J. J. Chem. Phys. 1997, 106, 6430-6440. (6) Bak, K. L.; Gauss, J.; Jørgensen, P.; Olsen, J.; Helgaker, T.; Stanton, J. F. J. Chem. Phys. 2001, 114, 6548-6556.
(7) (a) Bühl M.; Kabrede, H. J. Chem. Theory Comput.2006, 2, 1282-1290. (b) Waller, M. P.; Bühl, M. J. Comp. Chem. 2007, 28, 1531–1537.
(8) Waller, M. P.; Braun, H.; Hojdis, N.; Bühl,M. J. Chem. Theor. Comput. 2007, 3, 2234-2242.
(9) van Lenthe, E.; Snijders, J. G.; Baerends, E. J. J. Chem. Phys. 1996, 105, 6505-6516. (10) van Wüllen, C.; Langermann, N. J. Chem. Phys. 2007, 126, 114106.
(12) (a) DeBeer-George, S.; Petrenko, T.; Neese, F. Inorg. Chim. Acta 2008, 361, 965-972, (b)
DeBeer-George, S., Petrenko, T.; Neese, F., submitted to J. Phys. Chem.; (c) Ray, K.; Petrenko, T.; Wieghardt, K.;. Dalton Trans. 2007, 1552-1566; (d) Kokatam, S.; Ray, K.; Pap, J.; Bill, E.; Geiger,
W.E.; LeSuer, R.J.; Rieger, P.H.; Weyhermüller, T.; Neese, F.; Wieghardt, K. Inorg. Chem. 2007,
46, 1100-1111; (e) Ray, K.; DeBeer-George, S.; Solomon, E.I.; Wieghardt, K.; Neese, F. Chem.
Eur. J. 2007, 13, 2783-2797; (f) Kapre, R.; Ray, K.; Sylvestre, I.; Weyhermüller, T.;
DeBeer-George, S.; Neese, F.; Wieghardt, K. Inorg. Chem. 2006, 45, 3499-3509.
(13) (a) Neese, F. Inorg. Chim. Acta 2002, 337C, 181-192; (b) Sinnecker, S.; Slep, L.; Bill, E.;
Neese, F. Inorg. Chem. 2005, 44, 2245-2254; (c) Ray, K.; Begum, A; Weyhermüller, T.; Piligkos,
S.; van Slageren, J.; Neese, F.; Wieghardt, K. J. Am. Chem. Soc. 2005, 127, 4403-4415; (d) Ray, K.;
Weyhermüller, T.; Neese, F.; Wieghardt, K. Inorg. Chem. 2005, 44, 5345-5360.
(14) For some recent reviews see e.g.: (a) Bühl, M. Ann. Rep. NMR Spectrosc., in press.; (b) Autschbach, J. Coord. Chem. Rev. 2007, 251, 1796-1821. (c) Autschbach, J. Struct. Bonding 2004,
112, 1-48.
(15) (a) Fritscher, J.; Hrobarik, P.; Kaupp, M. J. Phys. Chem. B 2007, 111, 4616-4629; (b)
Munzarova, M.; Kaupp, M. J. Phys. Chem. A 1999, 103, 9966-9983.
(16) (a) Neese, F. J. Chem. Phys. 2001, 115, 11080-11096; (b) Neese, F. J. Chem. Phys. 2003,
117, 3939-3948; (c) Neese, F. J. Chem. Phys. 2007, 127, 164112; (d) Neese, F. J. Am. Chem. Soc.
2006, 128, 10213-10222; (e) Sun, X.; Chun, H.; Hildenbrand, K.; Bothe, E.; Weyhermüller, T.;
Neese, F.; Wieghardt, K. Inorg. Chem. 2002, 41, 4295-4303.
(17) Hess, B. A.; Marian, C. M. in Jensen, P.; Bunker, P.R. (Eds.), Computational Molecular Spectroscopy. John Wiley & Sons, New York, 2000, p. 169ff.
(18) (a) Heully, J. L.; Lindgren, I.; Lindroth, E.; Martenssonpendrill, A. M. Phys. Rev. A 1986,
33, 4426-4429; (b) van Lenthe, J. G.; Baerends, E. J.; Snijders, E. J. Chem. Phys. 1993, 99,
4597-4610; (c) van Wüllen, C J. Chem. Phys. 1998 109, 392-399.
(19) Pantazis, D. A.; Chen, X.-Y.; Landis, C. R.; Neese, F. J. Chem. Theory Comput. 2008, 4,
908-919.
(20) Schäfer, A.; Horn, H.; Ahlrichs, R. J. Chem. Phys. 1992, 97, 2571-2577.
(21) Schäfer, A.; Huber, C.; Ahlrichs, R. J. Chem. Phys. 1994, 100, 5829-5835.
(22) Weigend, F.; Furche, F.; Ahlrichs, R. J. Chem. Phys. 2003, 119, 12753-12762.
(24) (a) Ruud, K. ; Åstrand, P.-O,; Taylor, P. R. J. Chem. Phys. 2000, 112, 2668-2683. (b)
Ruud, K. ; Åstrand, P.-O,; Taylor, P. R. J. Am. Chem. Soc. 2000, 123, 4826-4833. (c) Ruden, T.;
Lutnæss, O. B.; Helgaker, T. J. Chem. Phys. 2003, 118, 9572-9581.
(25) (a) Barone V. J. Chem. Phys. 2004, 120, 3059-3065. (b) Barone, V. J. Chem. Phys. 2005,
122, 014108.
(26) The equilibrium distance, re, is the distance between the positions of the nuclei on the potential energy surface, as obtained from standard geometry optimizations; rg is the average internuclear distance at temperature T, rg0 that at zero K. It is the latter value that our computed effective geometries refer to. Typical quantities derived experimentally are ra (the effective
internuclear distance as derived from electron scattering intensity), rα (the distance between average
nuclear positions in the thermal equilibrium at temperature T), rz (the distance between average nuclear positions in the ground vibrational state), or r0 (the effective internuclear distance obtained from the rotational constants), see e.g.: Hargittai, I. in Stereochemical Applications of Gas-Phase Electron Diffraction, Part A: The Electron Diffraction Technique, Hargittai, I; Hargittai, M. (Eds.),VCH Publisher, Weinheim, pp.1-54 (1988).
(27) Gaussian 03, Revision D.01, M. J. Frisch, G. W. Trucks, H. B. Schlegel, G. E. Scuseria, M. A. Robb, J. R. Cheeseman, J. A. Montgomery, Jr., T. Vreven, K. N. Kudin, J. C. Burant, J. M. Millam, S. S. Iyengar, J. Tomasi, V. Barone, B. Mennucci, M. Cossi, G. Scalmani, N. Rega, G. A. Petersson, H. Nakatsuji, M. Hada, M. Ehara, K. Toyota, R. Fukuda, J. Hasegawa, M. Ishida, T. Nakajima, Y. Honda, O. Kitao, H. Nakai, M. Klene, X. Li, J. E. Knox, H. P. Hratchian, J. B. Cross, V. Bakken, C. Adamo, J. Jaramillo, R. Gomperts, R. E. Stratmann, O. Yazyev, A. J. Austin, R. Cammi, C. Pomelli, J. W. Ochterski, P. Y. Ayala, K. Morokuma, G. A. Voth, P. Salvador, J. J. Dannenberg, V. G. Zakrzewski, S. Dapprich, A. D. Daniels, M. C. Strain, O. Farkas, D. K. Malick, A. D. Rabuck, K. Raghavachari, J. B. Foresman, J. V. Ortiz, Q. Cui, A. G. Baboul, S. Clifford, J. Cioslowski, B. B. Stefanov, G. Liu, A. Liashenko, P. Piskorz, I. Komaromi, R. L. Martin, D. J. Fox, T. Keith, M. A. Al-Laham, C. Y. Peng, A. Nanayakkara, M. Challacombe, P. M. W. Gill, B. Johnson, W. Chen, M. W. Wong, C. Gonzalez, and J. A. Pople, Gaussian, Inc., Wallingford CT, (2004).
(28) Vosko, S. H.; Wilk L.; Nusair, M. Can. J. Phys. 1980, 58, 1200-1211. Functional III of
that paper used.
(29) Becke, A. D. Phys. Rev. A, 1988, 38,3098-3100.
(30) Becke, A. D. J. Chem. Phys. 1996, 98, 5648-5642.
(31) a) Perdew, J. P. Phys. Rev. B 1986, 33, 8822-8824. b) Perdew, J. P. Phys. Rev. B, 1986, 34,
(32) Perdew, J. P. In Electronic Strucure of Solids, Ziesche, P.; Eischrig, H. Eds.: Akademie Verlag: Berlin (1991). b) Perdew, J. P.; Wang, Y. Phys. Rev. B 1992, 45, 13244-13249.
(33) Lee, C.; Yang W.; Parr, R. G. Phys. Rev. B 1988, 37, 785-789.
(34) Boese A. D.; Handy, N. C. J. Chem. Phys., 2001, 114, 5497-5503.
(35) (a) Perdew, J. P.; Burke, K.; Ernzerhof, M., Phys. Rev. Lett. 1996, 77, 3865-3868.
(36) Van Voorhis T.; Scuseria, G. E. J. Chem. Phys., 1998, 109, 400-410.
(37) (a) Tao, J. ; Perdew, J. P.; Staroverov V. N.; Scuseria, G. E. Phys. Rev. Lett., 2003, 91,
146401. (b) Tao, J.; Perdew, J. P.; Staroverov V. N.; Scuseria, G. E. Phys. Rev. Lett. 2004, 120,
6898-6911.
(38) (a) Staroverov, V. N.; Scuseria, G. E.; Tao, J.; Perdew, J. P. J. Chem. Phys. 2003, 119,
146401. b) Staroverov, V. N.; Scuseria, G. E.; Tao J.; Perdew, J. P. J. Chem. Phys. 2004, 121,
11507.
(39) Johnson, E. R.; Wolkow, R. A.; DiLabio, G. A. Chem. Phys. Lett. 2004, 394, 334-338.
(40) (a) Hehre, W. J.; Ditchfield, R.; Pople, J. A. J. Chem. Phys. 1972, 56, 2257-2261. (b)
Hariharan P. C.; Pople. J. A. Theor. Chim. Acta., 1973, 28, 213-222.
(41) Weigend, F.; Ahlrichs, R. Phys. Chem. Chem. Phys. 2005, 7, 3297-3305.
(42) Neese, F. ORCA – an ab initio, Density Functional and Semiempirical Program Package, 2.6-35; Universität Bonn: Bonn, Germany, 2008.
(43) van Lenthe, E.; Faas, S.; Snijders, J. G. Chem. Phys. Lett. 2000, 328, 107-112.
(44) (a) Grimme, S. J. Comput. Chem. 2004, 25, 1463-1476; (b) Grimme, S. J. Comput. Chem.
2006, 27, 1787-1799.
(45) E.g., the eclipsed form is more stable than the staggered one by 3.7 kcal/mol and 4.3 kcal/mol at BP86/SDD and B3LYP/SDD levels, respectively.
(46) Girichev, G. V.; Petrov, V. M.; Giricheva, N. I.; Utkin, A. N.; Petrova, V. N. Russ. J. Struct. Chem. 1981, 22, 694.
(47) Borisenko, K. B.; Downs, A. J.; Robertsen, H. E.; Rankin, D. W. H.; Tang, C. Y. Dalton Trans. 2004, 967-970.
(48) (a) Faegri Jr., K.; Haaland, A.; Martinsen, K.-G.; Strand, T. G.; Volden, H. V.; Swang, O.; Anderson, C.; Persson, C.; Bogdanovic, S.; Herrmann, W. A. J. Chem. Soc. Dalton Trans. 1997,
1013-1018; (b) for an earlier study see: Ischenko, A. A.; Strand, T. G.; Demidov, A. V.; Spiridonov, V. P. J. Mol. Struct. 1978, 43, 227.
(49) Kadel, J.; Oberhammer, H. Inorg. Chem. 1994, 33, 3197-3198.
(50) Richardson, A. D.; Hedberg, K.; Lucier, G. M. Inorg. Chem. 2000, 39, 2787-2793.
(52) Page, E. M.; Rice, D. A.; Hagen, K.; Hedberg, L.; Hedberg, K. Inorg. Chem. 1982, 21,
3280.
(53) (a) original GED study assuming D3h symmetry: Haaland, A.; Hammel, A.; Rypdal, K.;
Volden, H. V. J. Am. Chem. Soc. 1990, 112, 4547-4549; (b) an irregular prism with two
nonequivalent sets of W-C distances differing by ca. 6 - 8 pm has been found in the solid state: Kleinhenz, S.; Pfennig, V.; Seppelt, K. Chem. Eur. J. 1998, 4, 1687-1691; and (c) by means of DFT
computations: Kaupp, M. Chem. Eur. J. 1998, 4, 1678-1686.
(54) Arnesen, S. P.; Seip, H. M. Acta Chem. Scand. 1966, 20, 2711.
(55) MW, r0 value: Tackett, B. S.; Karunatilaka, C.; Daly, A. M.; Kukolich, S. G. Organometallics 2007, 26, 2070-2076.
(56) Giricheva, N. I.; Girichev, G. V.; Lapshina, S. B.; Shl'ykov, S. A.; Politov, Yu. A.; Butskii, V. D.; Pervov, V. S.; Russ. J. Struct. Chem. (Engl. Transl.) 1993, 34, 214-224.
(57) Hagen, K.; Hobson, R. J.; Rice, D. A.; Turp, N. J. Mol. Struct. 1985, 128, 33-40.
(58) GED values from (a) Herrmann, W. A.; Kiprof, P.; Rypdal, K.; Tremmel, J.; Blom, R.; Alberto, R.; Behm, J.; Albach, R. W.; Bock, H.; Solouki, B.; Mink, J.; Lichtenberger, D.; Gruhn, N. E. J. Am. Chem. Soc. 1991, 113, 6527-6537; MW results ("best fit" values for Re=O and Re-C
distances of 170.3(2) and 207.4(4) pm, respectively) see (b) Wikrent, P.; Drouin, B. J.; Kukolich, S. G.; Lilly, J. C.; Ashby, M. T.; Herrmann, W. A. J. Chem. Phys. 1997, 107, 2187-2192.
(59) MW, r0 structure: Kukolich, S. G.; Drouin, B. J.; Indris, O.; Dannemiller, J. J.; Zoller, J. P.; Herrmann, W. A. J. Chem. Phys. 2000, 113, 7891-7900.
(60) Seip, H. M.; Stølevik, R. Acta Chem. Scand. 1966, 20, 385.
(61) Hagen, K.; Hobson, R. J.; Holwill, C. J.; Rice, D. A. Inorg. Chem. 1986, 25, 3659-3661.
(62) Huang, J.; Hedberg, K.; Pomeroy, R. K. Organometallics 1988, 7, 2049-2053.
(63) MW, r0 structure: Karunatilaka, C.; Tackett, B. S.; Washington, J.; Kukolich, S. G. J. Am. Chem. Soc. 2007, 129, 10522-10530.
(64) Ritz, C. L.; Bartell, L. S. J. Mol. Struct. 1976, 31, 73-76.
(65) MW, r0 structure: Evans, C. J.; Reynard, L. M.; Gerry, M. C. L. Inorg. Chem. 2001, 40, 6123-6131.
(66) Haaland, A.; Hougen, J.; Volden, H. V.; Puddephatt, R. J. J. Organomet. Chem. 1987,
325, 311-315.
(67) MW, rs structure: Walls, C.; Lister, D. G.; Sheridan, J. J. Chem. Soc. Farad. Trans. II
1975, 71, 1091-1099.
(68) Oberhammer, H. J. Mol. Struct. 1978, 48, 389-394.
(70) A notable underestimation of this bond length has also been noted at the MP2/LANL/6-3+G* level, from which some geometrical and force-field parameters have been used during refinement of the GED data, cf. reference 47. In that paper an unusually high vibrational amplitude has been noted for this bond and has been attributed to a fluxional process exchanging bridging and terminal H atoms. If the potential energy surface for this process were highly anharmonic with a very low barrier, a theoretical description of the light H atoms might require quantum dynamical methods; however, we could find no evidence for this, because a notable barrier of 6.9 kcal/mol and 5.9 kcal/mol is indicated at the BP86/SDD and B3LYP/SDD levels, respectively (including zero-point energies), proceeding via a Hf(η3-BH4)3(η2-BH4) transition state.
(71) Toyama, M.; Oka, T.; Morino, Y. J. Mol. Spectrosc. 1964, 13, 193-213.
(72) Only minor improvements are brought about by the use of an f-function on the metal (taken from: Hollwart, A.; Böhme, M.; Dapprich, S.; Ehlers, A. W.; Gobbi, A.; Jonas, V.; Kohler, K. F.; Stegmann, R.; Veldkamp, A.; Frenking, G. Chem. Phys. Lett. 1993, 208, 237-240; Chem.
Phys. Lett. 1994, 224, 603).
(73) Very recently, and after this work was started, more flexible basis sets have been devised for the Hay-Wadt ECPs, the combination thereof denoted LANL2TZ (Roy, L. E.; Hay, P. J., Martin, R. L. J. Chem. Theory Comput., in press, DOI 10.1021/ct8000409).
(74) See Koch, W.; Holthausen, M. C. A Chemist's Guide to Density Functional Theory, 2nd Ed., Wiley-VCH, Weinheim, 2001, and the extensive bibliography therein.
(75) Because we had not tested the PBE1 functional, which performs so well for the geometries of the heavier metal complexes, in our initial study on the 3d congeners, we have now reoptimized the latter set at the PBE1/AE1 level. For this set alone, this level affords mean and standard deviations of -1.4 pm and 1.7 pm, respectively, for the equilibrium geometries, and -0.9 pm and 1.77 pm, respectively, for the effective geometries.
(76) The rovibrational corrections for Co(CO)3(NO) were erroneously given as zero in Table 1 of reference 7b, whereas they should read 0.45 pm and 0.64 pm for the Co-N and Co-C bonds, respectively. We apologize for this oversight, which affects the final assessment of the whole set only marginally, and does not alter any of the qualitative conclusions.
(77) (a) Neese, F J. Biol. Inorg. Chem. 2006, 11 702-711; (b) Neese, F. Coord.Chem. Rev.
2008, in press.
(78) Grimme, S. J. Phys. Chem. A 2005, 109, 3067-3077.
(79) (a) Adamo, C.; Scuseria, G. E.; Barone, V. J. Chem. Phys. 1999, 111, 2889-2899. (b)
(80) (a) Neese, F. J. Chem. Phys. 2001, 115, 11080; (b) Koßmann, S.; Kirchner, B.; Neese, F.
Mol. Phys. 2007, 105, 2049-2071.