University of New Hampshire Scholars' Repository
New Hampshire Agricultural Experiment Station
Research Institutes, Centers and Programs
5-13-2015
Development of diagnostic microsatellite markers
from whole‐genome sequences of Ammodramus
sparrows for assessing admixture in a hybrid zone
Adrienne I. Kovach
University of New Hampshire, Durham, [email protected]
Jennifer Walsh
University of New Hampshire, Durham
Jordan Ramsdell
University of New Hampshire, Durham
William Kelley Thomas
University of New Hampshire, Durham, [email protected]
Follow this and additional works at:
https://scholars.unh.edu/nhaes
This Article is brought to you for free and open access by the Research Institutes, Centers and Programs at University of New Hampshire Scholars' Repository. It has been accepted for inclusion in New Hampshire Agricultural Experiment Station by an authorized administrator of University of New Hampshire Scholars' Repository. For more information, please [email protected].
Recommended Citation
whole-genome sequences of
Ammodramus
sparrows for
assessing admixture in a hybrid zone
Adrienne I. Kovach1, Jennifer Walsh1, Jordan Ramsdell2& W. Kelley Thomas2
1Department of Natural Resources and the Environment, University of New Hampshire, Durham, New Hampshire 03824 2Department of Molecular, Cellular and Biomedical Sciences, University of New Hampshire, Durham, New Hampshire 03824
Keywords
Admixture,Ammodramus, diagnostic markers, hybridization, next-generation sequencing.
Correspondence
Adrienne I. Kovach, University of New Hampshire, Department of Natural Resources and the Environment, Durham, NH 03824. Tel: 603-862-1603; Fax: 603-862-4976; E-mail: [email protected]
Funding Information
United States Fish & Wildlife Service, Region 5, Division of Natural Resources, National Wildlife Refuge System, and the New Hampshire Agricultural Experiment Station via USDA National Institute of Food and Agriculture McIntire-Stennis Project Number 225575.
Received: 17 February 2015; Revised: 27 March 2015; Accepted: 30 March 2015
Ecology and Evolution2015; 5(11): 2267– 2283
doi: 10.1002/ece3.1514
Abstract
Studies of hybridization and introgression and, in particular, the identification of admixed individuals in natural populations benefit from the use of diagnos-tic genediagnos-tic markers that reliably differentiate pure species from each other and their hybrid forms. Such diagnostic markers are often infrequent in the genomes of closely related species, and genomewide data facilitate their discov-ery. We used whole-genome data from Illumina HiSeqS2000 sequencing of two recently diverged (600,000 years) and hybridizing, avian, sister species, the Salt-marsh (Ammodramus caudacutus) and Nelson’s (A. nelsoni) Sparrow, to develop a suite of diagnostic markers for high-resolution identification of pure and admixed individuals. We compared the microsatellite repeat regions identified in the genomes of the two species and selected a subset of 37 loci that differed between the species in repeat number. We screened these loci on 12 pure indi-viduals of each species and report on the 34 that successfully amplified. From these, we developed a panel of the 12 most diagnostic loci, which we evaluated on 96 individuals, including individuals from both allopatric populations and sympatric individuals from the hybrid zone. Using simulations, we evaluated the power of the marker panel for accurate assignments of individuals to their appropriate pure species and hybrid genotypic classes (F1, F2, and backcrosses). The markers proved highly informative for species discrimination and had high accuracy for classifying admixed individuals into their genotypic classes. These markers will aid future investigations of introgressive hybridization in this system and aid conservation efforts aimed at monitoring and preserving pure species. Our approach is transferable to other study systems consisting of closely related and incipient species.
Introduction
Interspecific hybridization is common in nature (Mallet 2005; Abbott et al. 2013), especially among species in early stages of speciation or in secondary contact (Via 2009; Ellegren et al. 2012). Wild hybrids are a mosaic of phenotypes and genotypes, creating challenges for their taxonomic identification and confusion about their con-servation status (Stronen and Paquet 2013). Accurate identification of admixed individuals in wild populations aids evolutionary investigations of introgressive hybridiza-tion as well as conservahybridiza-tion management.
Studies of genetic admixture are most powerful when they use diagnostic species-specific markers, that is
2015). High-throughput sequencing greatly enhances de novo microsatellite development and results in the low cost recovery of tens of thousands of repeat-containing sequences (Malausa et al. 2011; Reid et al. 2012). Diag-nostic marker development can capitalize on this wealth of repeat sequence data to identify markers in the few genomic regions that are differentiated between closely related species. By generating sequencing data from both species’ genomes, screening markers for repeat differences can be performed in silico, thereby saving tremendously on the laborious process of screening loci in the labora-tory. In this study, we developed such a strategy for com-paring the repeat sequences generated by whole-genome shotgun sequencing of two hybridizing avian sister spe-cies, to identify a suite of diagnostic markers for high-res-olution identification of pure and admixed individuals in an avian hybrid zone.
Saltmarsh and Nelson’s sparrows (Ammodramus caud-acutusandA. nelsoni; Fig. 1) belong to a unique group of terrestrial vertebrates that rely primarily or exclusively on tidal marsh habitats (Greenberg et al. 2006a). As such, they are excellent models for studying local environmental adaptation and ecological speciation (Greenberg and Maldonado 2006; Greenberg 2006). They are also species of high conservation priority along the northeastern Atlantic coast of North America, where they breed (U.S. Department of Interior (USDI) 2008). A. caudacutus breeds exclusively in coastal marshes from mid-Maine to Virginia, USA (Greenlaw and Woolfenden 2007); it is globally threatened because of its limited range and obli-gate habitat requirements (IUCN Red List criteria; Birdlife International 2004). A. nelsoni has a wider ecological niche, and one of three subspecies (A. n. subvirgatus) breeds in tidal marshes, brackish waters, and hay fields from coastal Quebec to northeastern Massachusetts (Greenlaw and Woolfenden 2007; Nocera et al. 2007).
These young species diverged ~600,000 years ago (Rising and Avise 1993), as evidenced by weak genetic divergence (1.2% differentiation at the COI gene and FST of ~0.15
for neutral microsatellite markers; Shriver et al. 2005; Walsh et al. 2011). They co-occur and hybridize in tidal marshes of the New England coast, where they are now in secondary contact.
Hybrid A. caudacutus-nelsoni sparrows are prevalent within the overlap zone and reveal a complex and poorly understood pattern of morphological and genetic intro-gression (Hodgman et al. 2002; Shriver et al. 2005; Walsh et al. 2011). Currently available microsatellite markers yield low levels of differentiation within and between spe-cies (Shriver et al. 2005; Walsh et al. 2012) and lack the resolution to differentiate genotypic classes of admixed individuals (e.g., F1, F2, and backcrossed to each parental species). Difficulties in distinguishing pure and admixed individuals hinder efforts to evaluate the productivity and viability of populations in the hybrid zone, as well as to fully evaluate the geographic extent of introgression. Diagnostic markers are germane for addressing these con-cerns as well as for investigating patterns and mechanisms of introgressive hybridization.
The aim of this study was to use whole-genome sequence data of A. caudacutus and nelsoni for de novo development of a suite of species-specific diagnostic mi-crosatellite markers with high resolution for identifying pure and hybrid genotypic classes (F1, F2, and backcross-es). To do so, we identified putative diagnostic markers by in silico comparison of repeat sequences in the two ge-nomes, and we screened 37 of them in the laboratory on individuals of both species. We then developed a panel of the 12 most diagnostic markers, which we found through additional screening to be highly suitable for a genetic hybrid index. We evaluated the power of the markers for accurate assignments of simulated individuals to their appropriate hybrid genotypic classes. Our approach and PERL script for identifying diagnostic repeats between two genomes are readily transferrable to other study sys-tems consisting of closely related and incipient species.
Materials and Methods
Sampling and DNA extraction
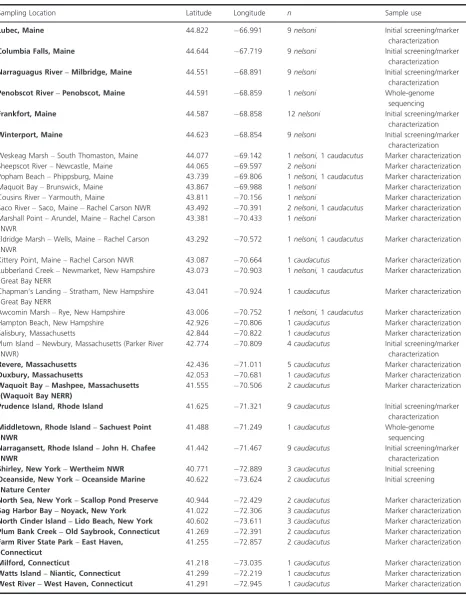
To obtain samples for marker development, we sampled a total of 120 A. caudacutus and nelsoni individuals from multiple putatively allopatric (n= 48 individuals of each species) and sympatric (n =24 individuals) locations along the northeastern coast of the United States, within and north and south of the species’ overlap zone (Table 1). Adult sparrows were captured using 12-m mist nests with size 36-mm mesh. Blood samples (10–20lL) Figure 1. Pure Saltmarsh Sparrow (Ammodramus caudacutus) on the
Table 1. Sampling locations and sample sizes ofAmmodramus caudacutusandA. nelsoniused in this study. Locations outside of the currently documented overlap zone (considered allopatric populations in this study) are in bold.
Sampling Location Latitude Longitude n Sample use
Lubec, Maine 44.822 66.991 9nelsoni Initial screening/marker
characterization
Columbia Falls, Maine 44.644 67.719 9nelsoni Initial screening/marker
characterization
Narraguagus River–Milbridge, Maine 44.551 68.891 9nelsoni Initial screening/marker characterization
Penobscot River–Penobscot, Maine 44.591 68.859 1nelsoni Whole-genome sequencing
Frankfort, Maine 44.587 68.858 12nelsoni Initial screening/marker
characterization
Winterport, Maine 44.623 68.854 9nelsoni Initial screening/marker
characterization Weskeag Marsh–South Thomaston, Maine 44.077 69.142 1nelsoni,1caudacutus Marker characterization Sheepscot River–Newcastle, Maine 44.065 69.597 2nelsoni Marker characterization Popham Beach–Phippsburg, Maine 43.739 69.806 1nelsoni,1caudacutus Marker characterization Maquoit Bay–Brunswick, Maine 43.867 69.988 1nelsoni Marker characterization Cousins River–Yarmouth, Maine 43.811 70.156 1nelsoni Marker characterization Saco River–Saco, Maine–Rachel Carson NWR 43.492 70.391 2nelsoni, 1caudacutus Marker characterization Marshall Point–Arundel, Maine–Rachel Carson
NWR
43.381 70.433 1nelsoni Marker characterization Eldridge Marsh–Wells, Maine–Rachel Carson
NWR
43.292 70.572 1nelsoni,1caudacutus Marker characterization Kittery Point, Maine–Rachel Carson NWR 43.087 70.664 1caudacutus Marker characterization Lubberland Creek–Newmarket, New Hampshire
Great Bay NERR
43.073 70.903 1nelsoni,1caudacutus Marker characterization Chapman’s Landing–Stratham, New Hampshire
Great Bay NERR
43.041 70.924 1caudacutus Marker characterization Awcomin Marsh–Rye, New Hampshire 43.006 70.752 1nelsoni,1caudacutus Marker characterization Hampton Beach, New Hampshire 42.926 70.806 1caudacutus Marker characterization Salisbury, Massachusetts 42.844 70.822 1caudacutus Marker characterization Plum Island–Newbury, Massachusetts (Parker River
NWR)
42.774 70.809 4caudacutus Initial screening/marker characterization
Revere, Massachusetts 42.436 71.011 5caudacutus Marker characterization
Duxbury, Massachusetts 42.053 70.681 1caudacutus Marker characterization
Waquoit Bay–Mashpee, Massachusetts (Waquoit Bay NERR)
41.555 70.506 2caudacutus Marker characterization
Prudence Island, Rhode Island 41.625 71.321 9caudacutus Initial screening/marker characterization
Middletown, Rhode Island–Sachuest Point NWR
41.488 71.249 1caudacutus Whole-genome sequencing
Narragansett, Rhode Island–John H. Chafee NWR
41.442 71.467 9caudacutus Initial screening/marker characterization
Shirley, New York–Wertheim NWR 40.771 72.889 3caudacutus Initial screening
Oceanside, New York–Oceanside Marine Nature Center
40.622 73.624 2caudacutus Initial screening
North Sea, New York–Scallop Pond Preserve 40.944 72.429 2caudacutus Marker characterization
Sag Harbor Bay–Noyack, New York 41.022 72.306 3caudacutus Marker characterization
North Cinder Island–Lido Beach, New York 40.602 73.611 3caudacutus Marker characterization
Plum Bank Creek–Old Saybrook, Connecticut 41.269 72.391 2caudacutus Marker characterization
Farm River State Park–East Haven, Connecticut
41.255 72.857 2caudacutus Marker characterization
Milford, Connecticut 41.218 73.035 1caudacutus Marker characterization
Watts Island–Niantic, Connecticut 41.299 72.219 1caudacutus Marker characterization
were collected from the brachial vein onto Nobuto blood filter strips (Advantec MFS Inc., Dublin CA). For de novo marker development, two additional females, one nelsoni captured from Penobscot, Maine, and one caudacutus captured from Middletown, Rhode Island, were blood-sampled for whole-genome sequencing. These individuals were assumed to be “pure” for each parental species, as they were sampled from locations outside of the currently recognized hybrid zone (Hodgman et al. 2002). DNA was extracted from blood samples using a DNeasy Blood Kit (Qiagen, Valencia, CA).
Genome sequencing and assembly
Illumina TruSeq DNA libraries were generated including electrophoretic, gel-based, manual size selection targeting an average insert size of 300 bp. Whole-genome 100–base pair, paired-end sequencing was performed in two sepa-rate lanes on an Illumina HighSeqS2000. This resulted in 213,519,998 and 384,563,744 100-base-pair reads for A. caudacutus and nelsonigenomes, respectively.
De Novo assembly of each genome was constructed from the paired reads (after filtering out reads with any ambiguous nucleotides – Ns) using the CLC Genomics Workbench 4.5.1 (CLC Bio, Aarhus, Denmark). Assembly parameters were as follows: kmer size=26, bubble size=50, mismatch cost =2, insertion and deletion costs= 3, length and similarity fractions of 0.5 and 0.8, respectively, and scaffolding set to true. The draft assem-bly for A. caudacutus is comprised of 237,108 contigs (largest contig is 188,803 bp) and the A. nelsoniassembly is comprised of 142,556 contigs (largest contig is 442,557 bp). N50 contig sizes are 12,145 and 30,931 bases, with 21X and 37X average coverage for the A. caudacutus and A. nelsoni genomes, respectively. Total assembled genome sizes were approximately 1 GB for each species.
Diagnostic loci identification and primer development
We used the program MSATCOMMANDER version 1.0.8 (Faircloth 2008) to identify repeat motifs (tri- and tetra-nucleotides) within assembled contigs of the A. nelsoni genome that were larger than the N50 contig length. To identify diagnostic repeat sequences, a custom PERL script (Appendix A1) was developed to identify repeat sequences that were common to both species and to com-pare the repeat numbers between the two genomes. Our script searched the assembled A. caudacutus genome for the same 20-base-pair flanking sequences on either side of the repeat regions identified in the A. nelsoni genome. Reverse complement sequences were similarly searched.
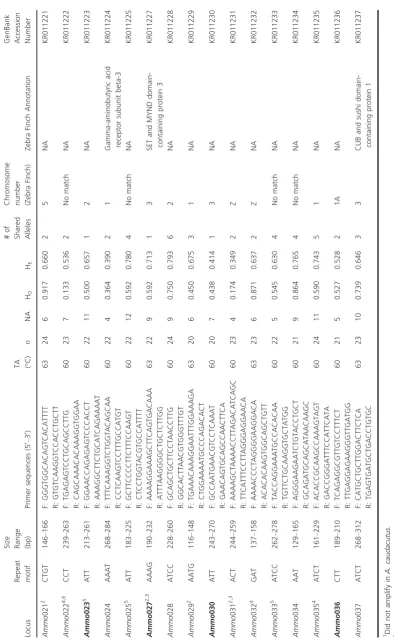
Using this filtering process, we identified 1030 tri- and te-tranucleotide loci that were common to both genomes. To increase the probability of finding diagnostic markers, we focused on sequences with at least four matching repeats and that differed by 3–10 repeats between species. This resulted in 79 loci; we narrowed this list down fur-ther to include only those loci (n =42) that differed by 4–10 repeats. Primers were designed with PRIMER 3 ver-sion 0.4.0 (Rozen and Skaletsky 2000), using default parameters, for 37 of these putatively diagnostic loci. To assess the distribution of the 37 loci across the genome, we used BLASTn, with an E value of <1e75 and >80% identity score, to identify the chromosome in the Zebra Finch genome where each repeat sequence was located and annotations when available (Table 2). We use the Zebra Finch because it is a well-annotated genome and synteny is high in avian genomes (Warren et al. 2010; Ellegren et al. 2012).
Genotyping and microsatellite characterization
To test the 37 diagnostic loci for amplification, we chose two individuals of each species. Polymerase chain reactions were prepared in 12.5 lL reactions and contained 2lL of eluted genomic DNA, 0.4lmol/L of each primer, 2.5 mmol/L MgCl2, 5X PCR buffer (Promega, Madison,
WI, USA), 0.2 mmol/L of deoxyribonucleotides, and 1 unit of Taq DNA polymerase (Promega). Cycling condi-tions were as follows: initial denaturation at 94°C for 4 min, followed by 30 cycles of 94°C for 30 sec, 56°–63°C for 45 sec, 72°C for 1 min, and a final extension step at 72°C for 5 min. PCR products were resolved on a 1% aga-rose gel. Of the 37 primers, 34 consistently amplified the target regions in both species and were used for an initial screening of 24 individuals from eight allopatric marshes (Table 1). PCR was repeated with the addition of 0.04 mmol/L of fluorescently labeled ChromaTide Alexa Fluor 488-5-dUTPs (Invitrogen, Life Technologies, Grand Island, NY, USA) to allow for the visualization of ampli-fied products on an automated DNA sequencer (ABI 3130 genetic analyzer, Applied Biosystems, Foster City, CA).
Table 2. Description of 34 putatively diagnostic markers screened in 12 Ammodramus caudacutus and 12 A. nelsoni individuals from allopatric populations. For each locus, columns contain the repeat motif, size in base pairs of the amplified fragments, primer sequences and annealing temperature, number of individuals genotyped ( n ), number of unique alleles (NA), observed (H o ) and expected (H e ) heterozygosities, number of alleles shared between the two species, the chromosome location and annotation of the amplified sequence in the Zebra Fi nch genome, and the Gen-Bank accession number. Loci in bold are the 12 diagnostic markers selected after initial screening. Locus Repeat motif Size Range (bp)
Primer
sequences
(5
0–3 0)
TA (°C)
n NA HO HE #o f Shared Alleles Chromosome number (Zebra
Finch)
Zebra
Finch
Annotation
GenBank Accession Number
Table
2.
Continued.
Locus
Repeat motif Size Range (bp)
Primer
sequences
(5
0–3 0)
TA (°C)
n NA HO HE #o f Shared Alleles Chromosome number (Zebra
Finch)
Zebra
Finch
Annotation
GenBank Accession Number
0.1–0.3lmol/L of each dye-labeled primer, 2.0 mmol/L MgCl2, 5X PCR buffer (Promega), 0.1 mmol/L of
deoxy-ribonucleotides, and 1 unit of Taq DNA polymerase (Pro-mega). We used the same cycling conditions described above with a 60°C annealing temperature for all loci. Amplified products were again electrophoresed on an ABI 3130 automated DNA sequencer, and individual geno-types were scored manually using PEAKSCANNER soft-ware (ABI).
For the 12 diagnostic loci, the number of private alleles, allele frequencies, and estimates of expected and observed heterozygosities were calculated for allopatric individuals in GENALEX, version 6.41 (Peakall and Smouse 2006). The proportion of shared alleles was calculated for each locus as the number of alleles shared between allopatric A. nelsoniand A. caudacutusdivided by the total number of alleles. The frequency of the most common allele in each species was calculated in GENALEX. We performed selection tests for the 12 loci using an FST outlier
approach (Beaumont and Nichols 1996) in LOSITAN (Antao et al. 2008). Tests of Hardy–Weinberg equilibrium and linkage equilibrium were conducted in GENEPOP, version 4.2 (Raymond and Rousset 1995). Significance was assessed with a Bonferroni correction for multiple tests. Locus-specificFSTvalues were also calculated for all
pairwise combinations of allopatric and sympatric spar-rows in GENEPOP. We used a Bayesian clustering method implemented in the program STRUCTURE v. 2.3.4 (Pritchard et al. 2000) to assess how membership proportions differed between allopatric and sympatric populations of both species. We ran ten replications with K=2, using the admixture model with correlated allele frequencies and a 100,000 burn-in followed by 100,000 iterations.
Power assessment of diagnostic marker panel
We assessed the power of the panel of 12 diagnostic markers by evaluating the accuracy of each locus in assigning known individuals to hybrid classes. We simu-lated 100 genotypes for each of six genotypic classes (pure A. nelsoni, pure A. caudacutus, backcrossed A. nelsoni, backcrossed A. caudacutus, F1 hybrids, and F2 hybrids) using the program HYBRIDLAB 1.0 (Nielsen et al. 2006). Simulated individuals were analyzed using the program NEWHYBRIDS 1.1 BETA (Anderson and Thompson 2002); we used the z and s option to identify the 36 pure individuals of each species as known reference individuals. We ran NEWHYBRIDS using the default options with 200,000 sweeps and a 200,000 burn-in. We calculated mean posterior probabilities of the individuals assigned to each category and the percentage of correctly assigned
individuals. Individuals were considered correctly assigned when their true category was the category with the highest posterior probability.
Results
Marker development and characterization
Sizes of the repeat regions for the 34 markers ranged from 112 to 284 bp, and loci were variably polymorphic with 2–12 alleles (Table 2; see Appendix A2 for allele fre-quency data). Mean observed and expected heterozygosi-ties ranged from 0.133 to 0.917. Eighteen loci showed significant deviations from Hardy–Weinberg in one or both species at P<0.05, and 6 loci showed deviations in one or both species after Bonferroni correction (P<0.0007; Table 2). These deviations are not unex-pected and most likely result from a Wahlund effect (Wa-hlund 1928), given that samples for each species were collected from a diversity of geographic locations, poten-tially comprised of distinct populations. The number of shared alleles between species ranged from 0 to 6 across the 34 loci. Across the panel of 12 diagnostic loci, no pairs showed significant deviations from linkage equilib-rium. Two loci (Ammo012 and Ammo015) were candi-dates for positive selection.
Resolution and power of the diagnostic marker panel
The proportion of shared alleles between allopatric A. caudacutusandA. nelsoniat the 12 diagnostic loci ran-ged from 0.11 to 0.95, with the frequency of most com-mon alleles as high as 1.0 in A. caudacutus and 0.984 in A. nelsoni(Table 3). The number of private alleles ranged from 1 to 12 among allopatric populations. Locus-specific FSTvalues between allopatricA. nelsoniand A. caudacutus
ranged from 0.21 to 0.81 with a global FST of 0.46
(Table 4). Differentiation between sympatric A. nelsoni and allopatric A. caudacutus was similar to that of the two allopatric populations; however, differentiation between allopatricA. nelsoniand sympatric A. caudacutus and between sympatric populations of each species was slightly lower (Fig. 2).FST values for within-species
Based on the 12 diagnostic microsatellite markers, NEWHYBRIDS assigned 92% of all the simulated indivi-duals to their true category. Assignment accuracies varied for the categories, ranging from 76% (F2) to 100% (pure A. caudacutus), with posterior probabilities for the cor-rectly assigned categories ranged from 0.75 (F2) to 0.991 (A. caudacutus; Table 5). Pure individuals had the highest percentage of correct assignments with 98% (A. nelsoni) and 100% (A. caudacutus) of individuals correctly assigned with posterior probabilities of 0.947 and 0.991, respectively. F1 individuals were also assigned with high accuracy (97% and posterior probability of 0.936). F2 individuals were the most difficult to assign, especially with respect to distinguishing them from backcrossed individuals, with 76% of individuals correctly assigned with a mean posterior probability of 0.75. For back-crossed individuals, 91% were assigned at nearly identical mean posterior probabilities of 0.844 and 0.843. The majority of misassignments were between backcrossed and F2 individuals. There were no instances where back-crossed A. nelsoni were assigned as backcrossed A. caud-acutusand vice versa.
Discussion
While current sequencing technologies afford the poten-tial for generating tens of thousands of genomewide markers for population genomics research (Davey et al. 2011), not all research and conservation applications will require genomewide data (Allendorf et al. 2010). For such applications, including research questions focused on dis-cerning processes for closely related individuals –such as dispersal, kinship, population structure, and admixture – an informative panel of microsatellite markers will remain a valuable tool (Guichoux et al. 2011; Wei et al. 2014; Vukosavljev et al. 2015). In our case study of an avian hybrid zone, we highlight the utility of a carefully selected, high-resolution panel of microsatellite markers for discriminating genotypic classes of pure and admixed individuals. Our strategy for diagnostic marker discovery via in silico screening for microsatellite repeat differences in two species’ genomes eliminates the laborious process of manually screening markers in the laboratory. As such, this efficient and highly effective approach should prove useful for other studies requiring diagnostic microsatellite markers for closely related species.
From whole-genome sequence data, we identified 34 polymorphic and diagnostic or partially diagnostic micro-satellite markers that amplified in both A. caudacutusand A. nelsoni. We developed a panel of the 12 loci with the fewest shared alleles between species. All markers in this diagnostic panel amplified consistently using the same routine PCR conditions, making them highly conducive
for multiplexing. We demonstrated the power of these loci for the identification of pure and admixed individuals in this avian hybrid zone.
After screening the 12 diagnostic markers on 96 spar-rows from allopatric and sympatric sites, we found them to be highly informative for species discrimination. This panel of loci had high resolution for classifying pure and admixed individuals into their genotypic classes. The markers were most powerful for distinguishing among F1, backcrossed, and parental groups (with 91–100% accu-racy), while F2s were difficult to distinguish from either F1 or backcrossed groups (76% accuracy). For all loci,
the most common allele differed between the two species; this allele was typically rare (<0.05%) in the other species. Only one locus,Ammo030, showed a fixed allele in either species – with a single allele in A. caudacutus and three private alleles in A. nelsoni. An additional four markers had an allele with>90% frequency in one of the two spe-cies. While most of the markers exhibited a relatively large portion of shared alleles between species (0.11– 0.98), allele frequency distributions differed strongly between the species, and all loci had at least one private allele. Locus-specific FSTs indicated strong divergence
(ranging from 0.2144 to 0.819, with overallFST=0.4667)
Table 4. Locus-specific and overallFST values for all pairwise comparisons of allopatric and sympatricAmmodramus caudacutusandA. nelsoni
using the panel of 12 diagnostic microsatellite markers developed in this study.
Locus
FST
Allopatricnelsoni/ Allopatric
caudacutus
Allopatricnelsoni/ Sympatric
caudacutus
Allopatric
caudacutus/ Sympatric
nelsoni
Sympatricnelsoni/ Sympatric
caudacutus
Allopatricnelsoni/ Sympatricnelsoni
Allopatric
caudacutus/ Sympatric
caudacutus
Ammo001 0.3033 0.2592 0.4037 0.3707 0.0703 0.0027
Ammo003 0.4019 0.3946 0.3653 0.3477 0.0312 0.024
Ammo006 0.281 0.2237 0.2524 0.1813 0.0234 0.0182
Ammo008 0.6245 0.5498 0.6262 0.5204 0.0078 0.0326
Ammo012 0.819 0.7123 0.6915 0.4454 0.0632 0.1041
Ammo015 0.8073 0.849 0.7748 0.8202 0.0387 0.0111
Ammo016 0.5586 0.6217 0.4856 0.5076 0.0183 0.0202
Ammo017 0.3968 0.4448 0.2555 0.2814 0.0056 0.0213
Ammo023 0.2629 0.2185 0.1842 0.1371 0.0169 0.0135
Ammo027 0.2144 0.2421 0.3734 0.489 0.1711 0.0027
Ammo030 0.5198 0.3685 0.694 0.4561 0.0006 0.064
Ammo036 0.4352 0.465 0.4172 0.4614 0.0241 0.0166
Overall 0.4667 0.4282 0.4567 0.4137 0.0272 0.004
0.0 0.1 0.2 0.3 0.4
A B C D E F
Comparison
Fst
Comparison
Allopatric NESP−allopatric SALS Allopatric NESP−sympatric NESP Allopatric NESP−sympatric SALS Allopatric SALS−sympatric SALS Sympatric NESP−allopatric SALS Sympatric NESP−sympatric SALS
Figure 2. Distribution ofFSTvalues across the
12 diagnostic markers for pairwise comparisons of allopatric and sympatric
between allopatric populations of each species. In com-parison, anonymous neutral loci yielded a between-species FSTof 0.15 (Shriver et al. 2005).
The lack of microsatellite loci with fixed differences between the two species is notable, given our whole-gen-ome approach. By comparing all of the microsatellite repeats identified from whole-genome shotgun sequenc-ing, we only found 79 loci to differ in repeat numbers between the two genomes (and of these, only 42 met our criteria of differing by four or more repeats). Our result-ing panel of 12 diagnostic loci therefore likely represents the largest microsatellite differences across the genomes of these two species. The overall similarity in microsatellite repeats between the two species exemplifies their close relationship as recently diverged sister species and sug-gests that high genetic similarity is characteristic not only at the mitochondrial level (Rising and Avise 1993; Walsh et al. 2011), but also potentially on a genomewide level.
This finding gives insight into genomic similarity of hybridizing taxa and highlights the challenges of identify-ing diagnostic markers for recently diverged species, as well as the utility of whole-genome sequencing in high-resolution marker development.
The elevated divergence of the diagnostic panel relative to neutral loci previously used in this system (Shriver et al. 2005; Walsh et al. 2012) suggests that these loci may be under selection (Storz 2005; Strasburg et al. 2012). Selection tests identified two of the markers to be under selection in this dataset; however, further research with more targeted sampling schemes may identify addi-tional selected loci. This is supported by the fact that 10 of the 34 (6 of 12 diagnostic) loci aligned with an anno-tated protein-coding region of the Zebra Finch genome (Table 2). These markers may be associated with a region of the genome with a functional role that diverges between the two species; accordingly, these may be
0 10 20 30 40
0.0 0.1 0.2 0.3 0.4 0.5 0.6 0.7 0.8 0.9 1.0
Q values
Count
Population Allopatric_NESP Sympatric NESP Sympatric SALS Allopatric_SALS
Figure 3. Distribution of Q values from program STRUCTURE for allopatric and sympatricAmmodramuss caudacutusand
A. nelsoni. Q values indicate the proportion of the genome attributed to the parental species, with 1 being purecaudacutusand 0 pure
nelsoni.
Table 5. Power assessment of the panel of 12 diagnostic markers for assigning simulated sparrow individuals to pure, F1 hybrid, F2 hybrid, and backcrossed (BC) categories, using NEW HYBRIDS. For each genotypic class, the mean posterior probabilities across 100 simulated individual assignments are reported, and the Accuracy column reports the proportions of individuals correctly assigned to each category (individuals were defined as correctly assigned when their true category was the category with the highest posterior probability in the NEW HYBRID assignment).
True category
Assigned category: mean posterior probabilities
Purenelsoni Purecaudacutus F1 Hybrid F2 Hybrid BCnelsoni BCcaudacutus % Accuracy Purenelsoni 0.947 0.000 0.000 0.000 0.052 0.000 98 Purecaudacutus 0.000 0.991 0.000 0.000 0.000 0.008 100
F1 Hybrid 0.000 0.000 0.936 0.033 0.008 0.021 97
F2 Hybrid 0.004 0.000 0.040 0.750 0.120 0.071 76
important portions of the genome with respect to specia-tion. As allelic changes induced by natural selection occur faster than those due to neutral processes (Nei 1987), high-resolution gene-associated markers are more power-ful than neutral markers for applications that require assigning individuals to distinct population or species groupings (Nielsen et al. 2009, 2012).
The pattern of between-species divergence that we found using the 12 diagnostic markers in this study was fairly consistent across sympatric and allopatric popula-tions. WhileFSTs were highest for allopatric comparisons
of the species, they were only slightly lower for compari-sons that included sympatric populations, suggesting divergence at these loci is maintained in the face of inter-specific gene flow in the hybrid zone (Walsh et al. 2011, 2015). These markers therefore appear to be associated with gene regions that do not introgress freely between the two species. For within-species comparisons, the FSTs
are slightly lower withinA. caudacutusthan withinA. nel-soni, supporting the hypothesis that introgression is biased in the direction of the A. caudacutus genome (Shriver et al. 2005; Walsh et al. 2011).
The low within-species divergence we found in this study is an expected outcome, especially for diagnostic markers.FSTamongA. caudacutusin this study is similar
to that previously reported by Walsh et al. (2012) using anonymous neutral loci. Despite high levels of gene flow, Walsh et al. (2012) found evidence for fine-scale popula-tion structure withinA. caudacutus. The sampling scheme in the current study, however, was not designed for evalu-ating within-species population structure, as pooling across many geographically separate sympatric or allopat-ric marshes likely masks some of the underlying popula-tion differentiapopula-tion. Nonetheless, the higher within-species FST found in A. nelsoni compared to A. caudacutus
sug-gests that a finer scale population genetic structure may be characteristic of the former. More pronounced popula-tion structure in A. nelsoni relative to A. caudacutus is consistent with differences in the species’ distributions and demography–nelsonitypically occur in smaller num-bers in small marshes that tend to be more spatially dis-junct than the larger, more continuous coastal marshes typically occupied by caudacutus (J. Walsh and A. Kov-ach, pers. obser.). These are the first population genetic data collected onA. nelsoni; future research with a more robust sampling scheme is warranted to characterize pop-ulation genetic structure in this species. The preliminary data in this study suggest that these markers will be useful for such within-species population comparisons.
In conclusion, our comparative, whole-genome approach has proven useful for identifying high-resolu-tion diagnostic markers in sister species with high genetic similarity. This approach is superior to anonymous
mar-ker development, not only because it enables pinpointing species-specific differences, but also because it links the markers to large contigs that can be mapped to genomic regions. The markers identified in this study will aid future research that requires distinguishing pure and admixed individuals in theA. caudacutus–nelsonihybrid zone, as doing so from morphology alone is unreliable (Walsh et al. 2011, 2015). A hybrid index based on 12 diagnostic microsatellite markers provides an inexpensive and simple genetic assay. This diagnostic assay for hybrid identification will prove valuable in efforts that seek to track shifts in species distributions, which is of particular relevance to the conservation of threatened A. caudacutus populations (Shriver et al. 2005; Walsh et al. 2011). The diagnostic marker panel will also be useful for studies of evolutionary ecology, such as providing insight into the rates and direction of introgression and estimates of the width and center of the hybrid zone (Barton and Gale 1993). Our marker development approach is easily trans-ferable to other studies, and we provide our PERL script for comparing repeat sequences of two genomes as an appendix.
Acknowledgments
Funding was provided by the United States Fish & Wildlife Service, Region 5, Division of Natural Resources, National Wildlife Refuge System, and the New Hampshire Agricultural Experiment Station. We thank C. Elphick, T. Hodgman, E. King, O. Lane, G. Mittlehauser, N. Pau, K. O’Brien, B. Olsen, K. Ruskin, and G. Shriver for logistical support and sample collection assistance. The Maine Department of Inland Fisheries and Wildlife, The Nature Conservancy, and Waquoit Bay National Estuarine Research Reserve generously allowed sampling on pro-tected marshes. We thank J. Anderson for technical assis-tance with fragment analysis and K. Okamoto for genome assembly help. T. Kristensen, B. Benvenuti, K. Papanastas-siou, and C. Mills and two anonymous reviewers provided helpful comments on a previous draft of this manuscript. This is Scientific Contribution Number 2601 of the New Hampshire Agricultural Experiment Station. This work was supported by the USDA National Institute of Food and Agriculture McIntire-Stennis Project Number 225575.
Conflict of Interest
None declared.
Data Accessibility
reads are deposited in the Short Read Archive (SRS893469 and SRS897222). Our PERL script for screen-ing repeat sequences across the two genomes is provided as Appendix A1, and allele frequencies for the panel of 12 diagnostic loci are in Appendix A2. Genotypes of the 96 individuals, simulated genotypes used to evaluate the marker panel, and the assembled N50 contigs of A. nel-soni and A. caudacutus are deposited in Dryad (http:// dx.doi.org/10.5061/dryad.f8m84).
References
Abbott, R., D. Albach, S. Ansell, J. W. Arntzen, S. J. E. Baird, N. Bierne, et al. 2013. Hybridization and speciation. J. Evol. Biol. 26:229–246.
Allendorf, F. W., P. A. Hohenlohe, and G. Luikart. 2010. Genomics and the future of conservation genetics. Nat. Rev. Genet. 11:697–710.
Anderson, E. C., and E. A. Thompson. 2002. A model-based method for identifying species hybrids using multilocus genetic data. Genetics 160:1217–1229.
Antao, T., A. Lopes, R. J. Lopes, A. Beja-Pereira, and G. Luikart. 2008. LOSITAN: a workbench to detect molecular adaptation based on anFST-outlier method. BMC
Bioinformatics 9:323–327.
Barton, N. H., and K. S. Gale. 1993. Genetic analysis of hybrid zones. Pp. 13–45inR. G. Harrison, ed. Hybrid zones and the evolutionary process. Oxford Univ. Press, Oxford, U.K. Beaumont, M. A., and R. A. Nichols. 1996. Evaluating loci for
use in the genetic analysis of population structure. Proc. R. Soc. Lond. B 263:1619–1626.
Birdlife International. 2004. Threatened birds of the world 2004. CD-ROM, Birdlife International, Cambridge, U.K. Davey, J. W., P. A. Hohenlohe, P. D. Etter, J. Q. Boone, J. M.
Catchen, and M. L. Blaxter. 2011. Genome-wide genetic marker discovery and genotyping using next-generation sequencing. Nat. Rev. Genet. 12:499–510.
Ellegren, H., L. Smeds, R. Burri, et al. 2012. The genomic landscape of species divergence inFicedula flycatchers. Nature 491:756–760.
Faircloth, B. C. 2008. MSATCOMMANDER: detection of microsatellite repeat arrays and automated, locus-specific primer design. Mol. Ecol. Resour. 8:92–94.
Greenberg, R., and J. E. Maldonado. 2006. Diversity and endemism in tidal-marsh vertebratesinR. Greenberg, S. Droege, J. Maldonado, M. V. McDonald, eds. Terrestria vertebrates of tidal marshes: ecology, evolution and conservation. Stud. Avian Biol. 32: 32–53.
Greenberg, R., J. E. Maldonado, S. Droege, and M. V. McDonald. 2006a. Tidal marshes: a global perspective on the evolution and conservation of their terrestrial vertebrates. Bioscience 56:675–685.
Greenberg, R. 2006. Tidal marshes: home for the few and the highly selected.inR. Greenberg, S. Droege, J. Maldonado,
M. V. McDonald, eds. Terrestrial vertebrates of tidal marshes: evolution, ecology, and conservation. Stud. Avian Biol. 32:2–9.
Greenlaw, J. S., and G. E. Woolfenden. 2007. Wintering distributions and migration of Saltmarsh and Nelson’s Sharp-tailed sparrows. Wilson J. Ornithol. 119:361–377.
Guichoux, E., L. Lagache, S. Wagner, S. P. Chaumeil, P. Leger, O. Lepais, et al. 2011. Current trends in microsatellite genotyping. Mol. Ecol. Resour. 11:591–611.
Hodgman, T. P., W. G. Shriver, and P. D. Vickery. 2002. Redefining range overlap between the Sharp-tailed Sparrows of coastal New England. Wilson Bull. 114:38–43.
Hohenlohe, P. A., S. J. Amish, J. M. Catchen, F. W. Allendorf, and G. Luikart. 2011. Next-generation RAD sequencing identifies thousands of SNPs for assessing hybridization between rainbow and westslope cutthroat trout. Mol. Ecol. Resour. 11(Suppl 1):117–122.
Malausa, T., A. Gilles, E. Maglecz, H. Blanquart, S. Duthoy, C. Coastedoat, et al. 2011. High-throughput microsatellite isolation through 454 GS-FLX Titanium pyrosequencing of enriched DNA libraries. Mol. Ecol. Resour. 11:638–644. Mallet, J. 2005. Hybridization as an invasion of the genome.
Trends Ecol. Evol. 20:229–237.
Moccia, M. D., A. Widmer, and S. Cozzolino. 2007. The strength of reproductive isolation in two hybridizing food-deceptive orchid species. Mol. Ecol. 16:2855–2866. Nei, M. 1987. Molecular evolutionary genetics. Columbia
Univ. Press, New York, NY.
Nielsen, E. E., L. A. Bach, and P. Kotlick. 2006. HYBRIDLAB (version 1.0): a program for generating simulated hybrids from population samples. Mol. Ecol. 6:971–973.
Nielsen, E. E., J. Hemmer-Hansen, P. F. Larsen, and D. Bekkevold. 2009. Population genomics of marine fishes: identifying adaptive variation in space and time. Mol. Ecol. 18:3128–3150.
Nielsen, E. E., A. Cariani, E. Mac Aiodh, G. E. Maes, I. Milano, R. Ogden, et al. 2012. Gene-associated markers provide tools for tackling illegal fishing and false eco-certification. Nat. Commun. 3:851. doi:10.1038/ ncomms1845.
Nocera, J. J., T. M. Fitzgerald, A. R. Hanson, and G. R. Milton. 2007. Differential habitat use by Acadian Nelson’s Sharp-tailed Sparrows: implications for regional
conservation. J. Field Ornithol. 78:50–55.
Peakall, R., and P. E. Smouse. 2006. GENALEX 6: genetic analysis in Excel. Population genetic software for teaching and research. Mol. Ecol. Notes 6:288–295.
Pritchard, J. K., M. Stephens, and P. Donnelly. 2000. Inference of population structure using multilocus genotype data. Genetics 155:945–959.
Raymond, M., and F. Rousset. 1995. GENEPOP (version 1.2): population genetics software for exact tests and
Reid, K., T. B. Hoareau, and B. Bloomer. 2012. High-throughput microsatellite marker development in two sparid species and verification of their transferability in the family Sparidae. Mol. Ecol. Resour. 12:740–752.
Rising, J. D., and J. C. Avise. 1993. The application of genealogical concordance principles to the taxonomy and evolutionary history of the Sharp-tailed Sparrow (Ammodramus caudacutus). Auk 110:844–856.
Rozen, S., and H. Skaletsky. 2000. Primer 3 on the WWW for general users and for biologist programmers. Methods Mol. Biol. 132:365–386.
Shriver, W. G., J. P. Gibbs, P. D. Vickery, H. L. Gibbs, T. P. Hodgman, P. T. Jones, et al. 2005. Concordance between morphological and molecular markers in assessing hybridization between Sharp-tailed sparrows in New England. Auk 122:94–107.
Storz, J. F. 2005. Using genome scans of DNA polymorphism to infer adaptive population divergence. Mol. Ecol. 14:671– 688.
Strasburg, J. L., N. A. Sherman, K. M. Wright, L. C. Moyle, J. H. Willis, and L. R. Rieseberg. 2012. What can patterns of differentiation across plant genomes tell us about adaptation and speciation? Philos. Trans. R. Soc. B 367: 364–373.
Stronen, A. V., and P. C. Paquet. 2013. Perspectives on the conservation of wild hybrids. Biol. Conserv. 167:390– 395.
U.S. Department of Interior (USDI). 2008. Birds of
conservation concern 2008. USDI, Fish and Wildlife Service, Division of Migratory Bird Management, Arlington, VA. http://www.fws.gov/migratorybirds/
Via, S. 2009. Natural selection in action during speciation. Proc. Nat. Acad. Sci. USA 106:9939–9946.
Vukosavljev, M, G. D. Esselink, W. P. C. van’t Westende, P. Cox, R. G. F. Visser, P. Arens, et al. 2015. Efficient Development of Highly Polymorphic microsatellite markers based on polymorphic repeats in transcriptome sequences of multiple individuals. Mol. Ecol. Resour. 15:17–27.
Wahlund, S. 1928. Zusammensetzung von Population und Korrelationserscheinung vom Standpunkt der
Vererbungslehre aus betrachtet. Hereditas 11:65–106. Walsh, J., A. I. Kovach, O. P. Lane, K. M. O’Brien, and K. J.
Babbitt. 2011. Genetic barcode RFLP analysis of the Nelson’s and saltmarsh sparrow hybrid zone. Wilson J. Ornithol. 123:316–322.
Walsh, J., A. I. Kovach, K. J. Babbitt, and K. M. O’Brien. 2012. Fine-scale population structure and asymmetrical dispersal in a salt marsh passerine, the Saltmarsh Sparrow
(Ammodramus caudacutus). Auk 129:247–258.
Walsh, J. W., W. G. Shriver, B. J. Olsen, K. M. O’Brien, and A. I. Kovach. 2015. Phenotypic variation across an avian hybrid zone: implications for species conservation. Auk 132: doi: 10.1642/AUK-14-299.1
Warren, W. C., D. F. Clayton, H. Ellegren, A. P. Arnold, L. W. Hillier, A. Kunstner, et al. 2010. The genome of a songbird. Nature 464:757–762.
Wei, N., J. B. Bemmels, and C. W. Dick. 2014. The effects of read length, quality and quantity on microsatellite discovery and primer development: from Illumina to PacBio. Mol. Ecol. Resour. 14:953–965.
Appendix A1: Perl script for screening
diagnostic microsatellite sequences
between two genomes
This script takes the microsatellite loci identified from one dataset with MSATCOMMANDER and screens the repeat sequences against a fasta file of sequences (in this case from a second genome) to pull out those loci common to both datasets that differ in repeat number between the two ge-nomes. The resulting output contains information on the number of repeats for each locus in each dataset. This output can then be filtered in a spreadsheet to thresholds according to the study design (e.g., loci that differ by>4 repeats).
Reference: Kovach, A.I., J. Walsh, J. Ramsdell, and K. Thomas. Development of Diagnostic Microsatellite Mark-ers from Whole Genome Sequences of Ammodramus Sparrows for assessing admixture in a hybrid zone.
#!/usr/bin/perl
#Title: Microsat Scanner #Version: 1.5
#Author: Jordan Ramsdell
#Use: Allows the user to import microsat pattern data from MSATCOMMANDER
# And compare these patterns to data found in a fasta file.
# Exports results to csv format.
#Documentation: This script uses the output from Msat commander to take the
#flanking nucleotides from either side of the microsat-ellites. This is then used
#to find a potential match in the target fasta file, under the assumption that
#the flanking sequences are identical.
#The reverse-compliment of the flanks are also searched, in case the
#microsatellite is found on the 30to 50end.
#USAGE: perl MicroSatScan.pl -msat <input.msat> -source <input.fasta> -target <input.fasta> -flank_length
<int, default 20> -out<output.csv> #Options:
#-msat <input.msat> Name of the msat commander file to use with this program.
#-target <input.fasta> Name of the target fasta file to scan through with flanking sequences.
#-flank_length<integer>Specifies the number of flank-ing nucleotides used in the regex search.
#-out <output.csv> Name of the comma delimited file to create after finishing scan
#The output is in a comma-separated format with the following columns:
#[Clone]: The contigs from the original fasta file that msat commander was run on.
#[Startbp]: The starting location of the microsatellite within the source contig.
#[Repeat]: The number of times the microsatellite repeats within the source contig.
#[Endbp]: The ending location of the microsatellite within the source contig.
#[Type]: The type of repeat
#[Comments]: Whether or not this repeat was found on the forward or reverse strand in the source.
#[MatchContig]: The target contig where the nucleo-tide repeat matched (based on flanking regions).
#[MatchRepeats]: How many times the microsatellite repeats within the matching contig.
#[Difference]: The difference in the amount of times the microsatellite repeats in the source contig compared to the target contig.
#[MatchSeq]: Displays the nucleotide sequence found between the flanking regions within the matching target contig.
#[MatchStart]: The starting location of the microsatel-lite within the matching target contig
#[MatchEnd]: The ending location of the microsatellite within the matching target contig
#[MatchLength]: The total length of the matching sequence within the target contig
#[Type]: Type 0 indicates that there was a change in expected length, likely due to the insertion or deletion of a single bp.
# Type 1 (what we’re probably more interested in) means that this sequence differs only in the number of microsatellites it has.
use Getopt::Long; use Pod::Usage; use strict(); use warnings(); #Variables my $fasta; my $source; my $target; my $debug; my $sett; my $input; my $output;
my $msat; my $append; my $msat_file; my $source_file; my $target_file; my $flank_length; #Get arguments
GetOptions( “msat=s”=>\$msat_file, “source=s”=>\$source_file,
“target=s”=>\$target_file,
“flank_length=i”=>\$flank_number, “out=s”=>\$output_name)
or die(pod2usage(1)); #Report errors
die pod2usage(“\nError: Please specify -msat file!\n”) if ($msat_file eq “”);
die pod2usage(“\nError: Please specify -source file!\n”) if($source_file eq “”);
die pod2usage(“\nError: Please specify -target file!\n”) if($target_file eq “”);
die pod2usage(“\nError: Please specify -out name!\n”) if($output_name eq “”);
#Default flank length $flank_number |=20; #Open Msat file
{
open(MSAT, $msat_file) || die “Couldn’t open -msat file: $msat_file”;
$msat= <MSAT>; close MSAT;
}
print “Successfully imported MSAT data.\n\nImporting Source FASTA file.\n”;
#Import Source Fasta File
{
local $/=undef;
open(SOUR, $source_file) || die “Couldn’t open -source file: $-source_file”;
$source= <SOUR>; close SOUR;
}
print “Successfully imported Source data.\n\nImporting Target FASTA file.\n”;
#Import Target Fasta File
{
local $/=undef;
open(TARG, $target_file) || die “Couldn’t open -target file: $target_file”;
$target= <TARG>; close TARG;
}
#Clean up data and prepare header $target=~s/\n//g;
$msat=~s/”“[.\n\s]*//g;
my@linesplit=split(“\r”, $msat); $output=shift (@linesplit);
$output .=“,MatchContig,MatchRepeats,Difference, MatchSequence,MatchStart,MatchEnd,MatchLength, Type\r”;
print “Data filtering complete. Beginning search.\n\n \n”;
#Begin searching for matches in target sequence while ($#linesplit!= -1)
{
my $element=shift@linesplit; my@split=split(“,”, $element); my@reference= @split; my $contig=shift@split;
#Find Contig index match in source my $cindex=index ($source, $contig.“\n”);
if (($cindex != -1) && ($split[0] ne “No repeats found” or “”))
{
my $stop=index ($source, “>”, ($cindex+1)); #Extract the sequence (if it’s the last contig, we just extract to the end)
my $sequence; if ($stop!= -1)
{
$sequence=substr ($source, $cindex+length($contig), ($stop - ($cindex+length($contig))));
}
else {$sequence = substr ($source, $cindex + length ($contig));}
my $startbp=shift@split; my $repeat=shift@split; my $endbp=shift@split; $sequence=~s/\n//g;
my $extract= substr ($sequence, $startbp - 1, ($endbp - $startbp));
my $flank_left = substr ($sequence, $startbp 1 -$flank_number,
$flank_number);
my $flank_right = substr ($sequence, $endbp - 1, $flank_number);
#Extract repeat nucleotides and number of times they occur.
$repeat=~m/\Q(\E(.*)\Q)\E\^(\d{1,3})/; my $repeat_source=$1;
my $times_source=$2;
#Now do a regex lookup on the target fasta file my $regex = “(?:$flank_left)([ATCGN]{1,200}?)(?: $flank_right)”;
my $flank_left2= reverse($flank_left); $flank_left2= ~ tr/ATCG/TAGC/;
my $flank_right2= reverse($flank_right); $flank_right2=
~tr/ATCG/TAGC/;
my $regex2= “(?:$flank_right2)([ATCGN]{1,200}?)(?: $flank_left2)”;
print “Searching Contig: “.$contig.”\nPattern: “.$repeat.”\n”; my $reverse=0;
#Is this match different? If so, send to output. Other-wise, throw out match.
if ((($target=~m/(?:$flank_left)/g) ||
(($target=~m/(?:flank_right2)/g) && (++$reverse))))
{
my $snippet = substr($target, (pos($target) - 1000), 2000);
if (($snippet=~m/(?:$regex)/g) ||
(($snippet=~m/(?:$regex2)/g) && (++$reverse)))
{
my $matched_repeat=$1;
my $reverse_repeat=reverse ($matched_repeat); $reverse_repeat=~tr/ATCG/TAGC/;
if (($matched_repeat eq $extract) ||
($reverse_repeat eq $extract)){$output .= join(“,”,
@reference).”\r”;}
if (($matched_repeat ne $extract) && ($reverse_repeat ne $extract))
{
print “Located difference in pattern: \n”.”---\n”;
#Something’s different in this sequence.
$output .=$contig.“,”.$startbp.“,”.$repeat.“,”.$endbp.“,”.shift (@split).”,”.shift(@split);
my $pos=pos($target);
print “Interior Seqeunce: “.$matched_repeat.”\n”; #Figure out which contig this is on.
my $contig_start=rindex($target, “>”, $pos); print “CONTIG START: $pos\n\n\n”; pos($target)=$contig_start;
$target=~m/(?:[ATCGN])/g; my $contig_end=pos($target);
#Extract name of the contig that had the match in the target fasta file
my $contig_name= substr($target, ($contig_start +1), $contig_end - $contig_start - 2);
$output .=“,”.$contig_name;
#Now where is this repeat located in the contig? my $repeat_start = $pos - $contig_end - length ($matched_repeat.$flank_right)+2;
my $repeat_end= $pos - $contig_end - length($flank_ right)+2;
“.$repeat_end.”\n”;
#Figure out where the repeat differs. my $times_target=0;
if ($reverse == 1){$repeat_source = reverse($repeat_ source); $repeat_source=~tr/ATCG/TAGC/;}
$times_target++ while $matched_repeat =~ /(?: $repeat_source)/g;
$output .=“,”.$times_target;
my $repeat_dif=$times_target - $times_source; $output .= “,”.$repeat_dif.”,”.$matched_repeat.”,”.$re peat_start.”,”.$repeat_end.”,”.length($matched_repeat);
#Did a bp change, or was a whole repeat inserted/deleted? if (length($matched_repeat)!= (length($repeat_source)
*$times_target)){$output .=“,0\r”;} else{$output .=“,1\r”;}
print “Repeated: “.$times_target.” times.\nDifference from Original: “.$repeat_dif.”\n---\n”;
} } }
else{$output .=join(“,”,@reference).”,No Match\r”;} print “\nRemaining Lookups: “.$#linesplit.”\n\n\n”;
} }
print “\n\nSearch complete.\nExporting data to: “.$out put_name;
open FILE, “>“.$output_name or die $!; print FILE $output;
close FILE; __END__
=head1 NAME
sample - Using GetOpt::Long and Pod::Usage
=head1 SYNOPSIS
perl MicroSatScan.pl -msat <input.msat> -source
<input.fasta> -target <input.fasta> -flank_length <int, default 20> -out<output.csv>
Options:
-msat <input.msat>Name of the msat commander file to use with this program.
-source <input.fasta> Name of the fasta file that msat was run on, used to extract flanking sequences.
-target <input.fasta> Name of the target fasta file to scan through with flanking sequences.
-flank_length<integer> Specifies the number of flank-ing nucleotides used in the regex search. Default is 20.
-out <output.csv> Name of the comma delimited file to create after finishing scan.
=head1 DESCRIPTION
B<This program> will read the given input file(s) and do something
useful with the contents thereof.
=cut
Appendix A2: Allele frequencies for the 12 diagnostic loci screened in 36Ammodramus caudacutusandA. nelsonisampled from outside of the known overlap zone. Diagnostic alleles (found only in one species) are indicated in bold, and the most common allele in each species is indicated with an asterisk.
Locus Allele/n Allopatric SALS Allopatric NESP
Ammo001 118 0.556* 0.042
122 0.389 0.042
126 0.056 0.028
134 0.000 0.056
138 0.000 0.361*
142 0.000 0.250
146 0.000 0.097
150 0.000 0.097
154 0.000 0.028
Ammo006 232 0.000 0.014
236 0.014 0.403*
240 0.000 0.083
244 0.000 0.403*
248 0.000 0.056
252 0.278 0.028
256 0.250 0.014
260 0.347* 0.000
264 0.111 0.000
Ammo017 112 0.014 0.083
116 0.056 0.736*
120 0.028 0.014
124 0.583* 0.153
128 0.222 0.014
132 0.056 0.000
136 0.042 0.000
Ammo008 238 0.014 0.333
244 0.014 0.569*
247 0.028 0.000
250 0.944* 0.097
Ammo027 188 0.097 0.500*
192 0.000 0.042
196 0.000 0.292
200 0.000 0.125
208 0.028 0.000
212 0.306* 0.014
216 0.139 0.000
220 0.153 0.014
224 0.181 0.014
228 0.097 0.000
Ammo015 241 0.000 0.972*
244 0.014 0.000
247 0.069 0.000
250 0.083 0.000
253 0.819* 0.028
256 0.014 0.000
Ammo003 139 0.329 0.014
142 0.014 0.000
151 0.471* 0.056
154 0.186 0.806*
Appendix A2:Continued.
Locus Allele/n Allopatric SALS Allopatric NESP
Ammo023 211 0.100 0.000
214 0.571* 0.014
217 0.114 0.000
220 0.143 0.014
223 0.014 0.403*
226 0.057 0.083
229 0.000 0.014
232 0.000 0.125
235 0.000 0.028
238 0.000 0.056
241 0.000 0.014
244 0.000 0.042
247 0.000 0.028
250 0.000 0.042
253 0.000 0.042
256 0.000 0.097
Ammo030 243 1.000* 0.181
249 0.000 0.125
264 0.000 0.319*
267 0.000 0.278
270 0.000 0.014
273 0.000 0.056
279 0.000 0.028
Appendix A2:Continued.
Locus Allele/n Allopatric SALS Allopatric NESP
Ammo036 191 0.000 0.764*
194 0.443* 0.028
197 0.029 0.000
200 0.129 0.000
203 0.086 0.000
206 0.229 0.000
209 0.071 0.000
212 0.014 0.194
215 0.000 0.014
Ammo016 245 0.029 0.944*
251 0.100 0.000
254 0.300 0.014
257 0.386* 0.028
260 0.157 0.014
263 0.029 0.000
Ammo012 177 0.000 0.984
189 0.803 0.000