ARTICLE
A Cluster-Randomized Trial of Screening for
Language Delay in Toddlers: Effects on School
Performance and Language Development at Age 8
Heleen M. E. van Agt, MAa, Heleen A. van der Stege, PhDb, Hanneke de Ridder-Sluiter, PhDb, Ludo T. W. Verhoeven, PhDc, Harry J. de Koning, MD, PhDa
aDepartment of Public Health, Erasmus Medical Center, Rotterdam, Netherlands;bDutch Foundation for the Deaf and Hard of Hearing Child, Amsterdam, Netherlands; cPedagogical and Educational Sciences, Faculty of Social Sciences, Radboud University Nijmegen, Nijmegen, Netherlands
Financial Disclosure: Drs Van de Stege and de Ridder-Sluiter are employed by the Dutch foundation for the Deaf and Hard of Hearing Child, where the VTO language-screening instrument was created; Drs van Agt, Verhoeven, and de Koning have indicated they have no financial relationships relevant to this article to disclose.
ABSTRACT
OBJECTIVE.The goal of this study was to assess the effects of screening and early treatment of preschool children for language delay on language development and school performance at age 8.
METHODS.A cluster-randomized, controlled trial and follow-up study of 55 child health centers in 6 geographic regions were conducted from January 2002 to September 2005. A total of 9419 children who were from the general population and aged 15 months at entry were studied. School type end school progress was known for 5406 (57.4%) children. In the intervention group, a structured screen-ing instrument was conducted twice (at ages 15/18 and 24 months), and usual care was applied in the control group. The screening instrument consisted of a uniform set of questions for the parents and test elements for the child. A positive screen result was followed by multidisciplinary assessments at speech and hearing centers and subsequent early treatment if needed. Percentages of children who attended a special school, repeated a class because of language problems, and scored low on standardized language tests, in intention-to-screen analyses, were measured.
RESULTS.At age 8, 2.7% in the intervention group and 3.7% in the control group attended a special school, 6.1% vs 4.9% had repeated a grade, 8.8% vs 9.7% had deficient oral language performance, 4.7% vs 4.7% had deficient reading, and 2.8% vs 4.2% had deficient spelling.
CONCLUSIONS.Screening toddlers for language delays reduces the number of children who require special education and leads to improved language performance at age 8. Nationwide implementation of the screening might be recommended.
www.pediatrics.org/cgi/doi/10.1542/ peds.2006-3145
doi:10.1542/peds.2006-3145
Key Words
screening, language delay, preschool children, RCT
Abbreviations
RCT—randomized, controlled trial VTO—VroegTijdige Onderkenning Ontwikkelingsstoornissen RR—relative risk CI— confidence interval
Accepted for publication Jun 19, 2007
Address correspondence to Heleen M. E. van Agt, MA, Department of Public Health, Erasmus MC, PO Box 2040, 3000 CA Rotterdam, Netherlands. E-mail: h.vanagt@ erasmusmc.nl
C
HILDREN’S GENERAL DEVELOPMENT is crucial. In health care, there is much focus on the monitoringof developmental steps in individual young children.1
Serious problems in cognitive and/or socioemotional de-velopment at school age or adolescence often originate from developmental disorders in childhood, of which
language delays are the most prevalent.2–5 In a large
Dutch sample from the open population, the prevalence of language delays was estimated between 2.4% and
5.3% in 3-year-olds.6Although up to 60% of language
delays at the age of 2 to 3 years probably resolve
spon-taneously,5 some indicate severe and long-lasting
lan-guage impairment with detrimental effects at later age.7
Although effective treatment exists for young children
with several underlying causes of language delay,8it is
unclear whether systematic screening of language delay
at an early age is effective.9Whether screening leads to
better language performance as compared with usual practice can be investigated only in a randomized, con-trolled trial (RCT).
Several studies10–14have evaluated test characteristics
of specific screening instruments to detect language de-lays in preschool children. Only 1 study was set up as an RCT to evaluate the accuracy of a structured test and a parent-led method for language screening among 582
3-year-old children11; however, none of these studies
evaluated the effects of screening on language perfor-mance at later age.
In the Netherlands, on average, 85% of all 0- to 4-year-old children and their parents visit child health centers (for free) at regular times for assessing the child’s general development by physicians, including language development. This article describes the effects of a spe-cific screening instrument in a cluster-RCT among 9419 children on school performance and linguistic skills at age 8 in the Netherlands. At this age, children in Dutch schools should normally be in grade 2 of primary school, having had 1 year of reading education. If children are not capable of attending a regular primary school be-cause of learning, behavioral, or health problems, then special education services are offered. Children with se-vere language delays run a high risk of being placed in
special schools or having to repeat a grade.12We
hypoth-esized that the screening would result in a reduction in the proportion of children who need to attend a special school, repeat a year in regular school, or have scores in the lowest percentile of several standardized language
tests. We reported previously6that the screening did lead
to more earlier diagnoses and treatments in the first 3 years of life, as compared with a control group.
METHODS
Methods of this cluster-RCT have been published
be-fore.6Individual randomization is the ideal design, but
we used a cluster trial design to avoid biased results (induced by the alternating use of the specific screening
instrument for the intervention children and standard monitoring for the control subjects by 1 physician). Child health care physicians were the units for random-ization, and children were the units for analysis.
Randomization
We asked the child heath care physicians to identify low-and high-socioeconomic neighborhoods within their re-gion. Within the identified socioeconomic strata, each physician was then allocated a number and randomly classified by rolling dice by the trial’s manager as alter-nately intervention or control physician. Physicians in the control group performed the usual monitoring sys-tem, which is based on physicians’ observation and on questioning the parents in a limited manner without
clearcut referral criteria.15The child health center
phy-sicians in the intervention group were trained to use the specific screening instrument.
Screening and Diagnosis
The VroegTijdige Onderkenning Ontwikkelingsstoornis-sen (VTO; early detection of developmental disorders) Language Screening instrument consisted of questions about the language production, language reception, and interaction of children in the age group 12 to 29 months
(Appendixes 1 and 2).6,16,17 With this instrument, the
child health center physician in the intervention group interviewed the parents who routinely visited the child
health center with their child, which took⬃5 minutes.
The complete screening procedure embraced a screening interview at 15/18 months as well as at 24 months. The final score was obtained by adding the scores on both screenings, which ranged between 0 and 7. When
chil-dren had a final score ofⱕ2, they were referred to the
general practitioner for additional assessment at a speech and hearing center to confirm language delay and, if so,
to assess the underlying causes.6 This was done by a
uniform protocol of multidisciplinary diagnostic proce-dures in all regions, which included assessment of lan-guage production, lanlan-guage reception, hearing,
cogni-tive development, and socioemotional development.6
The cutoff score of the VTO Language Screening instru-ment was obtained in a pilot study by using the Reynell language comprehension test as gold standard. A cutoff
score of ⱕ2 was found to be the most optimal point,
allocating 80% of the children as having either true-positive or true-negative results. More details on the validity of the VTO, which was proved to be satisfactory,
have been published before.6
Follow-up
spe-cial schools for children with learning problems, for chil-dren with a visual disability, for chilchil-dren who are deaf and hard of hearing and for children with severe speech difficulties, for children with mental and/or physical dis-abilities, and for children with behavioral difficulties. In January of each school year, we informed all primary schools and special schools in the regions of the study population about the follow-up project. Then we in-formed the parents by mail and asked them for their written consent to obtain data on their child’s linguistic abilities from the school and teacher (plus name and address details of the school and teacher). Two months later, the parents received a questionnaire and, if neces-sary, a reminder for the informed consent. The parents were asked a number of detailed questions about the history of language problems (age and type of problem) and related treatment. The parent questionnaire con-tained some questions about background characteristics (number of older brothers/sisters, foreign language spo-ken at home, educational level of parents, and whether the child had a physical or mental disability/illness), which are known predictors for language develop-ment.18,19
Schools received a list with the names of the chil-dren for which we obtained informed consent from the parents. At the end of the school year, the teachers of these children were asked to fill out a questionnaire and to supply the scores on a set of widely known specified standardized language assessment tests. In case these specified tests were not (yet) applied in a particular school, we included the relevant test mate-rial in the mail parcel and asked the teacher whether he or she was willing to administer the test(s) to the child. We also included a book for the classroom and a theater voucher as presents for all teachers (inde-pendent of the response). Reminders were sent to all parents and teachers who did not respond in the pre-vious periods.
Participants
In 6 regions in the Netherlands, 4 regions in the south, 1 in the midsouth, and in 1 large city in the west, 55 physicians of child health centers were randomly as-signed. Inclusion started in May 1995 in the 4 regions in the south, in March 1996 in the midsouth region, and in August 1996 in the city in the west. The participating children were those who were between the age of 15 to 24 months in the given inclusion period and were living within the area of the intervention physicians’ health care location and those who were living within the area
of the control physician (n⫽11 440).
Primary Outcome Measures
The primary outcome measures (at the individual level) were school performance and linguistic ability at age 8. School performance embraced school career, defined by
the type of school the child was currently attending, and functioning at school, assessed by determining whether the child had repeated a grade. We assessed both oral and written linguistic abilities of the children by means of standardized assessment tests and the independent (blinded toward arms) judgment of teachers.
School Type and Grade
Data on school type and grade were derived from the parent report on school address details. School type was determined by linking name and address details of the school to the Dutch central registry system, in which each school is allocated a unique number and catego-rized by school type. Children were assumed to have repeated a grade when their grade was below grade 2 (group 4 in the Netherlands) of primary school, which was the expected grade given the age of the included children.
Standardized Assessment Measures
Teachers were asked to supply the scores of the individ-ual children with respect to receptive and productive oral and written language usage, consisting of a
vocab-ulary test20; spelling21and reading comprehension22tests,
which can be administered at group level; and sentence
construction23and technical reading24tests, which are to
be administered for each child individually. These out-comes are part of the national pupil monitoring system, which is widely used by teachers in Dutch schools to follow the school progress of individual children in pri-mary school. Each test comprises separate units designed for specific measuring moments in the school year. Norm scores consist of 5 levels, which are based on the scores of these tests on the specified measuring moments in a national sample (A: 25% highest scores; B: 25% just above the average score; C: 25% just below the average score; D: 15% far below the average score; and E: 10% lowest scores).
Teacher and Parent Questionnaires
Apart from the standardized tests, the teacher and par-ent questionnaires also included questions with respect to oral and written linguistic abilities and learning. In addition, the teacher was asked about the child’s future development (“Do you think that in the future the child would develop in a normal way?”).
Secondary Outcome Measures
The secondary outcome measure (at the individual level) was the frequency of occurrence of (past) treat-ment to spur the child’s language developtreat-ment, as re-ported by the parent. Interventions for language diffi-culties may take many forms because of the broad range of problems as well as the broad range of underlying
causes.5 To assess the number of children treated for
group, we therefore asked the parents the following question: “Has there ever been anything done to spur on your child’s language development?” Children were identified as treated for a language problem when
par-ents confirmed the question by answering ⱖ1 of the
following: “Yes, treatment by speech and language ther-apist/ear, nose, and throat specialist/remedial teacher/ physiotherapist/psychologist/social worker.” In addition, parents were asked to report the age around which their child had been treated.
Sample Size
Under conditions of usual care, we estimated that
⬃2.5% of children would be having serious language
problems at 8 years (as defined by attending special education). On the basis of the estimated treatment
ef-fect sizes from Law et al,5the observed proportions of
different types of language delays among the children whose screening was positive at age 2, and the number of children who as a result of the screening would be
treated for language delay,6we estimated that we could
reduce the percentage of serious language delays at age 8 with 20% in the intervention arm, for a significance level of 5% (1-sided), a power of 80%, and equal allo-cation. For a trial with randomization of individual chil-dren to be able to detect such a reduction, a minimum of 2925 children in total would need to be recruited. Be-cause we used cluster randomization, we required a larger sample size to compensate for this design effect.
The formula 1⫹[(m⫺1)⫻R], wherem⫽the number
ot children per cluster, R ⫽s2b/(s2b ⫹ s2w), the
intra-cluster correlation coefficient, is used where s2b is the
variance between clusters ands2wis the variance within
clusters.25On the basis of the additional assumptions of
an estimated intracluster correlation coefficient of 0.005 and an average of 110 eligible and participating children
in each cluster [1 ⫹ (110 ⫺ 1) ⫻ 0.005 ⫽ 1.55], we
would need 1.55⫻2925⫽4534 children in total, which
is at least 20 clusters in each trial arm.
Analyses
Comparisons were made between intervention and con-trol groups (intention-to-screen analysis) and between children who completed the full screening procedure (screened at age 15/18 months as well as 24 months) and children who had never been screened by VTO (in this comparison, we excluded children who were screened at 1 age only). The primary outcomes were put to binary variables: regular education/special education, repeating a grade (yes/no), oral and written linguistic abilities according to standardized tests (E level/higher than E level), and normal future development (yes/no) according to the teacher. We analyzed the primary out-come variables by multilevel analysis with 2 levels
(clus-ter and child) by using EGRET 2.0.126for logistic
regres-sion with distinguishable binomial random effect. To
adjust for possible regional differences, we subsequently included region in the model. Although the trial was
designed with a 1-sided hypothesis,27we report the
re-sults for 2-sided 5% tests for the primary outcomes as well to follow statistical convention.
RESULTS
Figure 1 shows the flow of children in clusters through the trial. In all, 28 child health center physicians were allocated to the intervention group and 27 physicians to the control group. Thirty-six physicians were not en-rolled because of either the very small numbers of chil-dren in their care or their inability to meet requirements for participation. During the follow-up period, 15% of the cohort was not reachable as a result of a change of address. The parents of a total of 9419 children were asked for consent, 5424 (57.6%) of whom agreed; the parents of 5406 children supplied usable information on school type, and the teachers of 4329 children and the parents of 4281 children completed detailed question-naires. The response (written consent) in low-socioeco-nomic neighborhoods was 53.7% (1447 of 2695), whereas the response in middle- and high-socioeco-nomic neighborhoods was 58.9% (3763 of 6388) and
63.9% (214 of 335; P ⫽ .000), respectively. In
low-socioeconomic neighborhoods, the response in the in-tervention and control groups was 55.6% and 51.6%
(P⫽.015), in middle-socioeconomic neighborhoods was
59.4% and 58.3% (P ⫽ .537), and in
high-socioeco-nomic neighborhoods was 71.4% and 56.9% (P⫽.006),
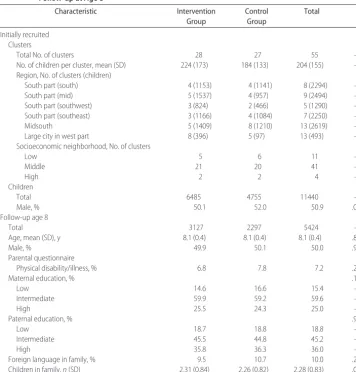
respectively. Baseline and follow-up characteristics of clusters and children were similar between arms (Table 1). Only between regions were there some differences in the number of clusters and children.
Before the age of 2 (start of screening), there were no differences in the cumulative percentages of reported treatments between the intervention and control groups (Table 2). Before age 3, 3.5% of the children in the intervention group and 2.4% in the control group had
been treated to spur language development (P⫽.069).
Before age 5, the percentage of children who were ever treated was significantly higher in the intervention
group than in the control group: 10.8% vs 8.6% (P⫽
.024). Before the age of 9, 26.5% of the children in the intervention group and 23.7% in the control group had
been treated to spur language development (P⫽.054).
The intention-to-treat analyses revealed that, in children who were allocated to the intervention arm, the relative risk (RR) for special school attendance was 0.71 and the RR for the lowest level of the spelling test was 0.68, calculated according to logistic regression with distin-guishable binomial random effect, which takes cluster randomization into account (Table 3). After adjustments for regional differences, the RRs were 0.70 (95%
confi-dence interval [CI]: 0.49 –1.02; P⫽ .063,P⫽ .032 for
P⫽.027 for 1-sided testing), respectively. For the other outcomes, no significant differences were found. In the group of children who underwent the complete screen-ing procedure, the RR for special school attendance was
0.75 (95% CI: 0.62– 0.91; P ⫽ .003) and the RR for
lowest level of oral language performance was 0.74
(95% CI: 0.62– 0.90; P ⫽ .002, adjusted for regional
differences; Table 4). For the other outcomes, no signif-icant differences were found.
DISCUSSION
We have shown that early detection of language delays in toddlers at child health care centers by means of a specific screening instrument followed by early treat-ment can reduce the percentage of children who attend a special school at 8 years by 30%. At the same time, the
number of children with spelling problems was reduced by 33%. Screened children seemed to have fewer prob-lems with oral linguistic skills. The screening led to more treatments and support in the preschool period.
Parent report on school type and grade proved to be
reliable; only⬍1% of the school addresses were found to
be incorrect. With the help of the teachers, the children’s linguistic abilities were measured by standardized tests, which were validated and proved to be reliable in
pre-vious research.28 Only a small proportion of teachers
were not familiar with the tests; however, this propor-tion did not differ between the intervenpropor-tion and control groups, so this could not have been a potential bias. Importantly, none of the teachers knew whether the child belonged to the intervention or control group. Special school attendance can be considered to be a valid
91 eligible clusters (child health center physicians) N = 91
36 clusters not enrolled (too-small clusters or inability to participate)
Lost to follow-up Moved (n = 971 [15.0%]) Refused (n = 190 [2.9%])
Lost to follow-up Moved (n = 752 [15.2%]) Refused (n = 108 [2.2%]) 55 clusters randomized with
children aged 15 mo at entry
Analyzed
Mean (SD) age (y): 8.1 (0.4)
School type (n = 3118) Class (n = 3084)
Oral language tests (n = 1270) Reading tests (n = 1844) Spelling tests (n = 1728)
Invited to participate at age 8 y (n = 5324) Invited to participate at age 8 y (n = 4095)
Analyzed
Mean (SD) age (y): 8.1 (0.4)
School type (n = 2288) Class (n = 2250)
Oral language tests (n = 925) Reading tests (n = 1328) Spelling tests (n = 1225)
Intervention group (28 clusters with 6485 children)
Specific screening at 15/18 and 24 mo (n = 3776)
Specific screening at 15/18 or 24 mo (n = 560)
No specific screening/usual care (n = 2149) (for logistic reasons, holidays, etc)
Control group (27 clusters with 4955 children)
No specific screening/usual care (n = 4955)
Written consent (n = 3127 [58.8%]) Teacher questionnaires (n = 2491) Parent questionnaires (n = 2474)
Written consent (n = 2297 [56.1%]) Teacher questionnaires (n = 1838) Parent questionnaires (n = 1807) FIGURE 1
measure of school performance, because only children with severe educational problems attend such schools in the Netherlands. It should be noted, however, that prob-lems other than language might be the only reason for special school entrance (eg, behavioral problems); thefore, we took account of possible differences in the
ferral policy for special education by adjusting for re-gional differences.
At 3 years of age, the VTO screening had been found to result in larger proportions of children with diagnosed
and/or treated language problems.6In this study, parents
in the intervention group reported significantly more
TABLE 1 Characteristics of Child Health Care Physicians (Clusters) and Children: Initially Recruited and Follow-up at Age 8
Characteristic Intervention
Group
Control Group
Total P
Initially recruited Clusters
Total No. of clusters 28 27 55 —
No. of children per cluster, mean (SD) 224 (173) 184 (133) 204 (155) — Region, No. of clusters (children)
South part (south) 4 (1153) 4 (1141) 8 (2294) —
South part (mid) 5 (1537) 4 (957) 9 (2494) —
South part (southwest) 3 (824) 2 (466) 5 (1290) —
South part (southeast) 3 (1166) 4 (1084) 7 (2250) —
Midsouth 5 (1409) 8 (1210) 13 (2619) —
Large city in west part 8 (396) 5 (97) 13 (493) —
Socioeconomic neighborhood, No. of clusters
Low 5 6 11 —
Middle 21 20 41 —
High 2 2 4 —
Children
Total 6485 4755 11440 —
Male, % 50.1 52.0 50.9 .045
Follow-up age 8
Total 3127 2297 5424 —
Age, mean (SD), y 8.1 (0.4) 8.1 (0.4) 8.1 (0.4) .862
Male, % 49.9 50.1 50.0 .926
Parental questionnaire
Physical disability/illness, % 6.8 7.8 7.2 .226
Maternal education, % .196
Low 14.6 16.6 15.4 —
Intermediate 59.9 59.2 59.6 —
High 25.5 24.3 25.0 —
Paternal education, % .921
Low 18.7 18.8 18.8 —
Intermediate 45.5 44.8 45.2 —
High 35.8 36.3 36.0 —
Foreign language in family, % 9.5 10.7 10.0 .208
Children in family,n(SD) 2.31 (0.84) 2.26 (0.82) 2.28 (0.83) .053
TABLE 2 Children Being Treated Per Age (Parent Questionnaire) Age at Which Child Was Treated
to Spur Language Development, ya
Intervention (n⫽2192), Cumulativen(%)
Control (n⫽1601), Cumulativen(%)
Total (N⫽3793), Cumulativen(%)
P
2 26 (1.2) 20 (1.2) 46 (1.2) .881
3 76 (3.5) 39 (2.4) 115 (3.0) .069
4 141 (6.4) 85 (5.3) 226 (6.0) .165
5 237 (10.8) 137 (8.6) 374 (9.9) .024
6 331 (15.1) 214 (13.4) 545 (14.4) .134
7 452 (20.6) 296 (18.5) 748 (19.7) .107
8 557 (25.4) 364 (22.7) 921 (24.3) .060
9 581 (26.5) 380 (23.7) 961 (25.3) .054
aHas there ever been anything done to spur on your child’s language development (by speech language therapist; ear, nose, and throat specialist, remedial teacher, physiotherapist, psychologist,
treatments related to language development in their child’s preschool period, in particular around the time of school entrance. Given the time period, parents might be remembering their child’s being treated for language problems rather than the occurrence of (past) language problems; however, these results must be evaluated with caution, because we did not collect detailed data on
language problems from specialists as we did previously.6
The parents of 57% of all eligible children participated in the follow-up study. Given that we addressed an open population and asked to sign for consent, the response is moderate but acceptable. The response (proportion of writ-ten consent) was only slightly lower in low-socioeconomic neighborhoods than in middle- and high-socioeconomic neighborhoods, so we think that the sample is still repre-sentative of the total population. The response of the schools and teachers was very high (82%). Although small but significant differences in response between interven-tion and control groups within low- and high-socioeco-nomic neighborhoods were found, this could not have been a potential bias of the results because we did not find any significant differences in the distribution of educational level of the parents between the intervention and control groups. In addition, there were no substantial differences in loss to follow-up and nonresponse between the study arms and hence could not have biased the observed differences in outcomes between the intervention and control groups either.
The population visiting the child health centers in the
Netherlands is not a selected group:⬃95% of all parents
visit these centers during the first year of their child’s life.6 Only children who have severe disabilities diagnosed at birth and need specialized care during their first year are seen by pediatricians and rarely visit a child health center.
Most studies11–14,29,30 on early detection of language
problems concluded that it is possible to identify children with language problems at an early stage in the preschool period, sometimes by 2-step screening methods. These studies focused on the test characteristics of the screening instrument. Comparisons across studies are difficult be-cause there is no generally accepted definition of language problems or gold standard, and methods of assessment
differ.5The most valid method would be clinical
examina-tion; however, this is not feasible in population-based stud-ies. Apart from the sensitivity and specificity of the instru-ment, it is important for economic reasons to consider the proportion of children who have positive screening results
and require additional assessment. Previously, we6found
that the sensitivity of the VTO instrument, resulting in 2.4% of positive screenings, was between 25% and 52%, depending on the assumed prevalence of language prob-lems, which was based on either specialist or parent report.
Some studies31 found higher sensitivity measures at the
expense of high referral rates. One RCT reported that the sensitivity of a structured test and a parent-led method
was, respectively 66% and 56%11; however, the
bility of these results to the general population is question-able because the sample came from a deprived area.
More-over, according to Laing et al,11the low uptake and high
attrition rate had probably biased the results toward over-estimating the performance of the screening test. Laing et al did not recommend formal screening on language prob-lems, because they considered the sensitivity of the struc-tured test not to be substantially higher than that of the parent-led method; however, we think that the sensitivity of the VTO screening instrument pertains to a realistic and acceptable figure, given the low referral rate and the young
age of the children.6Most important, this is the first study
to evaluate the effects of an early language screening pro-gram in an RCT, to assess whether the specific screening procedure leads to extra diagnosed and/or treated language problems and, most important, to extra “health” benefits at
later age as compared with usual practice.9After all, the
results of an RCT allow inferences about causal relation-ships between the screening and the effects.
CONCLUSIONS
We have shown that an early language screening pro-gram including a protocol of multidisciplinary diagnostic procedures can reduce special school entrance and lguistic problems. Nationwide implementation of the in-tervention as part of routine monitoring of children’s general development can be recommended.
ACKNOWLEDGMENTS
This study was funded by the Health Care Insurance Board (College voor zorgverzekeringen).
We are grateful to the schools, teachers, parents, and children who participated in this study; Anna Brandt, Sandra Laurier, Toon Juttmann, Marianne
Quak, and Dick Slof for assistance with the data col-lection and computer input of the data; Jan Alberts for designing the procedures for data management and data processing; and Carin Reep-van den Bergh, MA, and Paul van der Maas, MD, PhD, for general and methodologic support.
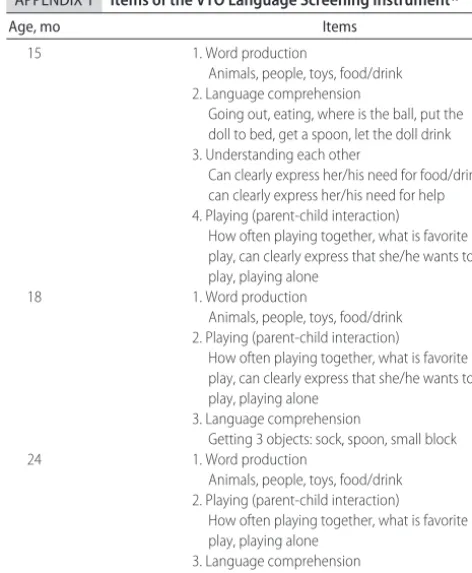
APPENDIX 1 Items of the VTO Language Screening Instrument17
Age, mo Items
15 1. Word production
Animals, people, toys, food/drink 2. Language comprehension
Going out, eating, where is the ball, put the doll to bed, get a spoon, let the doll drink 3. Understanding each other
Can clearly express her/his need for food/drink, can clearly express her/his need for help 4. Playing (parent-child interaction)
How often playing together, what is favorite play, can clearly express that she/he wants to play, playing alone
18 1. Word production
Animals, people, toys, food/drink 2. Playing (parent-child interaction)
How often playing together, what is favorite play, can clearly express that she/he wants to play, playing alone
3. Language comprehension
Getting 3 objects: sock, spoon, small block
24 1. Word production
Animals, people, toys, food/drink 2. Playing (parent-child interaction)
How often playing together, what is favorite play, playing alone
3. Language comprehension
Body parts: eyes, mouth, belly, feet, hair, hand TABLE 4 Primary Outcome Measures at Age 8: Screened With Specific Instrument (Completed Screens) and Never Screened With Specific
Instrument
Screened Not Screened Total RR 95% CI P Intracluster
Correlation 2-Sided
Testing
1-Sided Testing
In special school 1980 (41关2.1兴) 3142 (114关3.6兴) 5122 (115关3.0兴) 0.75a 0.62–0.92 .005 .003 0.0044 0.75b 0.62–0.91 .003 .002 0.0024 Repeating a grade 1961 (265关13.5兴) 3092 (447关14.5兴) 5053 (712关14.1兴) 0.95a 0.86–1.04 .256 .129 0.0000 0.95b 0.86–1.04 .282 .141 0.0000 Repeating a grade because of language 1585 (92关5.8兴) 2469 (142关5.8兴) 4054 (234关5.8兴) 0.98a 0.84–1.15 .821 .411 0.0051
problems (in regular primary school) 0.98b 0.84–1.15 .830 .415 0.0056
Below 10th percentile of oral language 817 (55关6.7兴) 1271 (137关10.8兴) 2088 (192关9.2兴) 0.74a 0.62–0.90 .002 .001 0.0083
tests 0.74b 0.62–0.90 .002 .001 0.0070
Below 10th percentile of reading tests 1188 (55关4.6兴) 1829 (88关4.8兴) 3017 (143关4.7兴) 0.98a 0.82–1.16 .819 .410 0.0000
in grade 2 0.98b 0.82–1.16 .791 .396 0.0000
Below 10th percentile of spelling tests 1127 (30关2.7兴) 1685 (65关3.9兴) 2812 (95关3.4兴) 0.87a 0.68–1.12 .287 .144 0.0099
in grade 2 0.84b 0.66–1.08 .175 .088 0.0032
Do you think that in the future the child 1124 (221关12.3兴) 1793 (134关11.9兴) 2917 (355关12.2兴) 0.98a 0.88–1.10 .745 .373 0.0000 would develop in a normal way
(answer teacher “no”)
0.98b 0.88–1.10 .770 .385 0.0000
aCalculated according to logistic regression with distinguishable binomial random effect, which takes cluster randomization into account.
REFERENCES
1. First LR, Palfrey JS. The infant or young child with develop-mental delay.N Engl J Med.1994;330:478 – 483
2. Felsenfeld S, Broen PA, McGue M. A 28-year follow-up of adults with a history of moderate phonological disorder: edu-cational and occupational results. J Speech Hear Res.1994;37: 1341–1353
3. Stothard SE, Snowling MJ, Bishop DV, Chipchase BB, Kaplan CA. Language-impaired preschoolers: a follow-up into adoles-cence.J Speech Lang Hear Res.1998;41:407– 418
4. Johnson CJ, Beitchman JH, Young A, et al. Fourteen-year follow-up of children with and without speech/language impairments: speech/language stability and outcomes.J Speech
Lang Hear Res.1999;42:744 –760
5. Law J, Boyle J, Harris F, Harkness A, Nye C. Screening for speech and language delay: a systematic review of the litera-ture.Health Technol Assess.1998;2:1–184
6. de Koning HJ, de Ridder-Sluiter JG, van Agt HM, et al. A cluster-randomised trial of screening for language disorders in toddlers.J Med Screen.2004;11:109 –116
7. Miniscalco C, Nygren G, Hagberg B, Kadesjo B, Gillberg C. Neuropsychiatric and neurodevelopmental outcome of chil-dren at age 6 and 7 years who screened positive for language problems at 30 months. Dev Med Child Neurol. 2006;48: 361–366
8. Law J, Garrett Z, Nye C. The efficacy of treatment for children with developmental speech and language delay/disorder: a meta-analysis.J Speech Lang Hear Res.2004;47:924 –943 9. Nelson HD, Nygren P, Walker M, Panoscha R. Screening for
speech and language delay in preschool children: systematic evidence review for the US Preventive Services Task Force.
Pediatrics. 2006;117(2). Available at: www.pediatrics.org/cgi/
content/full/117/2/e298
10. Klee T, Carson DK, Gavin WJ, Hall L, Kent A, Reece S. Con-current and predictive validity of an early language screening program.J Speech Lang Hear Res.1998;41:627– 641
11. Laing GJ, Law J, Levin A, Logan S. Evaluation of a structured test and a parent led method for screening for speech and
language problems: prospective population based study.BMJ.
2002;325:1152
12. Westerlund M, Sundelin C. Can severe language disability be identified in three-year-olds? Evaluation of a routine screening procedure.Acta Paediatr.2000;89:94 –100
13. Mattsson CM, Marild S, Pehrsson NG. Evaluation of a lan-guage-screening programme for 2.5-year-olds at child health centres in Sweden.Acta Paediatr.2001;90:339 –344
14. McGinty C. An investigation into aspects of the Mayo early language screening test. Child Care Health Dev. 2000;26: 111–128
15. Brouwers-de Jong EA, Burgmeijer RJ, Laurent de Angulo MS, eds.Monitoring development at the Child Health Center: Manual for
the Revised Van Wiechen Examination [in Dutch]. Assen,
Germany: Van Gorcum; 1996
16. de Ridder-Sluiter JG. Early detection of communicative disor-ders.XXV International Congress of Psychology; 19 –24 July1992; Brussels, Belgium: Lawrence Erlbaum Associates
17. de Ridder-Sluiter JG.Early Detection of Developmental Delays in
Communication Abilities[in Dutch]. Leiden, Netherlands:
Rijks-universiteit Leiden; 1990
18. Bishop DVM. The biological basis of specific language impair-ment. In: Fletcher P, Hall D, eds.Specific Speech and Language Disorders in Children: Correlates, Characteristics and Outcomes. Lon-don, United Kingdom: Whurr Publishers; 1991:2–17
19. Stanton-Chapman TL, Chapman DA, Bainbridge NL, Scott KG. Identification of early risk factors for language impairment.Res Dev Disabil.2002;23:390 – 405
20. Verhoeven LTW.Vocabulary Test, Manual[in Dutch]. Arnhem, Netherlands: Cito; 1996
21. Verhoeven LTW. Test of Progress in Spelling Skills, Manual[in Dutch]. Arnhem, Netherlands: Cito; 1997
22. Verhoeven LTW. Reading Comprehension, Manual[in Dutch]. Arnhem, Netherlands: Cito, 1997
23. Verhoeven LTW, Vermeer A.Language Test All Children, Assess-ment of Oral Language Skills Dutch for Children in Group 1– 4[in Dutch]. Arnhem, Netherlands: Citogroep, 2001
24. Verhoeven LTW. Three-Minutes Test (Technical Reading) [in Dutch]. Arnhem, Netherlands: Cito; 1997
25. Donner A. Some aspects of the design and analysis of cluster randomization trials.Appl Stat.1998;47:95–113
26. Diez Roux AV. A glossary for multilevel analysis.J Epidemiol
Community Health.2005;56:588 –594
27. Bland JM, Altman DG. One and two sided tests of significance.
BMJ.1994;309:248
28. Droop M, Verhoeven L. Language proficiency and reading ability in first- and second-language learners.Read Res Q.2003; 38:78 –103
29. Klee T, Pearce K, Carson DK. Improving the positive predictive value of screening for developmental language disorder. J
Speech Lang Hear Res.2000;43:821– 833
30. Stott CM, Merricks MJ, Bolton PF, Goodyer IM. Screening for speech and language disorders: the reliability, validity and accuracy of the General Language Screen.Int J Lang Commun
Disord.2002;37:133–151
31. Westerlund M. Relationship between a global rating of speech ability at the age of 3 yrs and a phonological screening 1 yr later: a prospective field study.Scand J Caring Sci.2001;15(3): 222–227
APPENDIX 2 Question 1 of the Screening Instrument at 24 Months of Age17
Let us start with the little sounds and words of (name of the child) Thinking about the past period, can you tell me:
a. How does (name of the child) call people in his/her proximity? b. What does (name of the child) say if (name of the child) wants
something to eat or drink?
c. What does (name of the child) say if (name of the child) wants to play with toys?
Possible answer categories Sentence
Word or name
Calls by sound or indicates; for instance, br⫽car Daddy, mama
Pointing out with sounda Pointing out without sounda Not indicating anythingb
aIf the parent’s answer is “pointing out,” then ask, “Does (name of the child) make any sounds
while pointing?”
DOI: 10.1542/peds.2006-3145
2007;120;1317
Pediatrics
W. Verhoeven and Harry J. de Koning
Heleen M.E. van Agt, Heleen A. van der Stege, Hanneke de Ridder-Sluiter, Ludo T.
Effects on School Performance and Language Development at Age 8
A Cluster-Randomized Trial of Screening for Language Delay in Toddlers:
Services
Updated Information &
http://pediatrics.aappublications.org/content/120/6/1317
including high resolution figures, can be found at:
References
http://pediatrics.aappublications.org/content/120/6/1317#BIBL
This article cites 21 articles, 2 of which you can access for free at:
Subspecialty Collections
rning_disorders_sub
http://www.aappublications.org/cgi/collection/cognition:language:lea
Cognition/Language/Learning Disorders
al_issues_sub
http://www.aappublications.org/cgi/collection/development:behavior
Developmental/Behavioral Pediatrics following collection(s):
This article, along with others on similar topics, appears in the
Permissions & Licensing
http://www.aappublications.org/site/misc/Permissions.xhtml
in its entirety can be found online at:
Information about reproducing this article in parts (figures, tables) or
Reprints
http://www.aappublications.org/site/misc/reprints.xhtml
DOI: 10.1542/peds.2006-3145
2007;120;1317
Pediatrics
W. Verhoeven and Harry J. de Koning
Heleen M.E. van Agt, Heleen A. van der Stege, Hanneke de Ridder-Sluiter, Ludo T.
Effects on School Performance and Language Development at Age 8
A Cluster-Randomized Trial of Screening for Language Delay in Toddlers:
http://pediatrics.aappublications.org/content/120/6/1317
located on the World Wide Web at:
The online version of this article, along with updated information and services, is
by the American Academy of Pediatrics. All rights reserved. Print ISSN: 1073-0397.
![FIGURE 1Lost to follow-up Flowchart of child health physicians (clusters) and childrenMoved (n = 971 [15.0%])](https://thumb-us.123doks.com/thumbv2/123dok_us/9471093.1475630/5.594.232.537.54.515/figure-lost-follow-flowchart-health-physicians-clusters-childrenmoved.webp)