Abstract—Of late there has been a significant amount of work on using sources of text data from the Web (such as Twitter or Google Trends) to predict financial and economic variables of interest. Much of this work has relied on some form or other of superficial sentiment analysis to represent the text. In this work we present a novel approach to predicting economic variables using sentiment composition over text streams of Web data. We treat each text stream as a separate sentiment source with its own predictive distribution. We then use a Bayesian classifier combination model to combine the separate predictions into a single optimal prediction for the Nonfarm Payroll index, a primary economic indicator. Our results show that we can achieve high predictive accuracy using sentiment over big text streams.
Index Terms—Economic prediction, text sentiment, big data streams, Bayesian classifier combination.
I. INTRODUCTION
There is a vast amount of text data available on the Internet from a huge number of distinct online sources and the rate of its output is increasing daily. Currently there is significant interest in both industrial and academic research that aims to utilize such Big Data provided by the WWW to make predictions and gain insights into various aspects of daily life. Structured extraction of and learning from these online sources is a useful and challenging problem that spans the natural language processing, information extraction, and machine learning communities.
In this work we forecast the trend of the United States Nonfarm Payrolls (NFP), a monthly economic index that measures employment growth (decay) and is considered an important indicator of the welfare of the U.S. economy.1 The NFP index is part of the Current Employment Statistics Survey, a comprehensive report released by the United States Department of Labor, Bureau of Labor Statistics, on the state of the national labor market. Released on the first Friday of each month, the index is given as the change in the number of nonfarm employment compared to the prior month. Beyond indicating the current state of the economy, the NFP is an index that “moves the market” upon its release with the
Manuscript received November 7, 2013; revised January 26, 2014.
Abby Levenberg is with the Oxford-Man Institute of Quantitative Finance and Dept. of Computer Science, University of Oxford, UK (e-mail: [email protected]).
Stephen Pulman is with the Dept. of Computer Science, University of Oxford, UK (e-mail: [email protected]).
Karo Moilanen is with the TheySay Analytics Ltd.
Edwin Simpson is with the Dept. of Engineering Science, University of Oxford.
Stephen Roberts is with the Oxford Man Institute of Quantitative Finance and Dept. of Engineering Science, University of Oxford.
1 http://research.stlouisfed.org/fred2/series/ PAYNSA?cid=32305
market reacting positively to an increase in the index and negatively to a decline [1]. Obviously it is of interest to anyone with a stake in the market, such as banks, hedge funds, prop traders, etc., to try and make an accurate and timely prediction of its direction. As such, as the NFP release date nears, there is a significant speculation in the business news media attempting to forecast its trend and value.
We show that such a prediction is possible just using text data from the WWW. We present a novel extraction and machine learning framework to access and combine the sentiment of multiple streams of text about the economy and employment from disparate online sources.
Our results show that using sentiment at the sentence level captures the information present in text more accurately than ignoring sentence-specific context. Using information from the sentiment composition algorithm as input to our predictive model demonstrates there is a high-level of predictive information implicit in the text. We show how to fully exploit the predictive information from individual stream predictions by using an Independent Bayesian Classifier Combination (IBCC) model and obtain high accuracy in our predictive task. We believe using sentiment features from multiple streams of online text data to learn predictions is an original contribution to the community and presents a number of challenges to solve. We begin by detailing prior work in this area.
II. PRIOR WORK
In this section we review the relevant prior work that uses sentiment for prediction of a financial nature.
Utilizing the information implicit in market news and opinion to predict the direction of the economy is of obvious interest to many people. As such, there is a large literature on using text from various online sources for prediction of economic indexes and stock market trends (see [2]-[4] for instance). In general the methodology of these papers is to obtain natural language text from the Web, such as news stories, message board data, Twitter feeds, etc., and to use language specific features, often sentiment based, to train a classification algorithm to predict the future direction or value of the index/market. Learning algorithms range from simple two-class Naive Bayes and Support Vector Machines to more sophisticated algorithms with varying results.
An overview and comparison of a number of such predictive systems tailored specifically to the stock market is given in [5] and [6]. Some of the reported work describes trading strategies based on system predictions that perform well beyond market expectations. However, the authors suggest the systems they review suffer from a lack of proper testing and unrealistic market expectations. As well, most of
Predicting Economic Indicators from Web Text
Using Sentiment Composition
Table of Contents
I. Introduction ... 1
References ... 5
the systems reviewed in these summaries use a “bag-of-words” model to compute the features for the document-level classification. The authors argue this approach is too general and prediction accuracy is impacted due to the loss of context within documents.
Current work has focused on the use of big textual data to predict economic and market trends (see [7]-[9]). An example of note is [10]. Here the authors regressed from multidimensional sentiment and mood labels (i.e., “Calm”, “Happy”) obtained from a stream of Tweets to the market and found some weak correlation with a single dimension of sentiment. While this research generated a significant buzz in the media and financial sectors its application to real-world trading remains unclear.
Other interesting work using text features for various predictions include the work described in the overview from [11] and [12]. Here a group of “text-driven forecasting” models are described that are used to predict phenomena ranging from the volatility of yearly returns from financial reports, box office revenues from film critics‟ reviews, and menu prices from the sentiment of customer restaurant reviews. Most recently [13] used Google Trends to find more significant correlations with changes in volumes of search queries of particular financial terms and the lagged market trend.
III. STREAMING PREDICTION FRAMEWORK
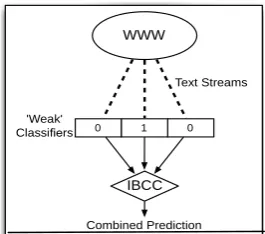
Our goal is to efficiently use the big text data freely available on the WWW to make predictions of economic variables of interest. However, for any domain there is an overwhelming amount of text available from any number of sources. A simplifying conceptual approach for making sense of the abundance of Web data is to treat each online source of data as a separate data stream. Each stream has its own underlying distribution and throughput, the rate at which the source produces text, and hence its own independent level of predictive accuracy. If we treat each stream as a classifier in its own right we can make use of ensemble methods to combine the independent predictions into a single best prediction. In this section we describe a framework for text stream extraction and optimal aggregate prediction using IBCC from independent “weak” classifiers built from multiple text streams.
Fig. 1. Framework for prediction. We aggregate independent predictions from multiple text streams from the WWW into a single combined trend
prediction using a Bayesian combination framework.
As Fig. 1 depicts our framework for stream-based prediction is divided into three parts:
1) Extracting the relevant text streams from the Web in a structured and efficient manner.
2) Training an ensemble of base classifiers – one for each text stream – using stream-specific features.
3) Aggregate multiple, stream-specific classifications into a single prediction.
Below we detail further each part of this framework.
A. Structured Stream Extraction
Since we aim to predict the trend of an economic index, the NFP, we want to find streams that contain useful information for predicting the economy. An immediate question we must answer is how to find and extract only the data relevant to the predictive task at hand from the massive amount of text available online. Consider that even within a stream from a single source there may be data that pertains to an arbitrary number of domains. For example, a stream of text from a website that broadcast news in real-time will contain stories ranging from the economy to celebrity surgery and everything in-between. We may want to use the pertinent articles on the economy from such a source but indiscriminate collection of the stream will mean most of the text we collect will be irrelevant to our predictive task.
Hence we use a mechanism based on Oxpath, a query language for web data extraction that enables the automation of user-driven queries of a given source and then structured retrieval of the returned data [14]. For instance, suppose we aim to collect articles pertaining to the NFP from the online archives of various newspapers and magazines. Using Oxpath we can set up an automated process to periodically query multiple sources for particular terms over specific dates, daily for instance, and save the data returned as structured entries into a local repository. This enables us to capture details present on a web page such as the author, title, date, etc., of an article. This means we do not have to download, process, and classify raw HTML pages – a tedious and error prone process. Instead we have direct structured access to the desired content of a text stream.
B. Text Features for Base Classifiers
Once we have access to the pertinent data from a particular data source we need to train a predictive model specific to that text stream to forecast the NFP, our dependent variable. Here any of the standard machine learning models in the literature are viable. For example, since we are predicting the directional trend of an economic index we use simple binary logistic regression models where a class of 1 means “up” and 0 means “down”. However, to use any predictive models we first must derive features from the text to use as training data to our classifier.
Here we try something simple but new. First we use sentiment composition to score individual sentences with a distribution over positive, negative, or neutral sentiment [15]. Afterwards we combine these sentence-level sentiment features in some informative way as input into our training algorithms. We find that using the sentiment over each sentence provides a deeper level of context than a bag-of-words model allows so we get a better representation of the text. More details of how we extract and use text features via a sentiment composition model are given in Section IV. In Section VI we report experiments on various approaches for combining the sentiment distribution from individual sentences as input features for model training. Next we describe how we combine these stream-specific WWW
0 0 1 'Weak'
Classifiers
Text Streams
predictions into a single best prediction.
C. Binary IBCC Model
Due to the differences in their underlying distributions, each of the individual text stream‟s predictive accuracies may very enormously in reliability. Classifier combination methods are well suited to situations such as these and serve to make best use of the outputs of an ensemble of imperfect base classifiers to enable higher accuracy classifications. Using a Bayesian approach to classifier combination provides a principled mathematical framework for aggregation where poor predictors can be mitigated and in which multiple text streams, with very different distributions and training features, can be combined to provide complementary information [16]. Here we describe a binary variation of the multiclass IBCC model of [17].
We want to predict the trend of the NFP over some number of months, or more generally epochs, indexed from 𝑖 ∈ 1, … , 𝑁 . We assume the trend 𝑻 of the NFP is generated from an underlying binomial distribution with parameters 𝛋. Each epoch has a value 𝑡𝑖∈ 0,1 where the 𝑖th epoch has a label 𝑡𝑖 = 0 if the NFP index has decreased from the prior
epoch and 𝑡𝑖= 1 if it increased. The prior probabilities of the
trends 𝑡𝑖 are given by 𝜿 ∶ 𝑝 𝑡𝑖 = 𝑗 𝜿) = 𝜅𝑗 , where 𝑗
iteratesover the class labels 0,1 .
We denote the number of base classifiers, or text streams, as 𝐾. Each text stream‟s base classifier 𝑘 ∈ 1, … , 𝐾 produces a real-valued output matrix 𝑪𝑘 of size 𝑁 𝑥 𝑗. The vector 𝒄 𝑖𝑘 ∈ 0,1 for epoch 𝑖 denotes the probabilities given by classifier 𝑘 of assigning a discrete label 𝒄𝑖𝑘∈ 0,1 . The 𝑗th element of the trend label, 𝑐𝑖𝑗𝑘 = 1, while all other elements are zero, indicates that classifier 𝑘 has assigned label 𝑗 to epoch 𝑖. We assume the vector 𝒄𝑖𝑘is drawn from a binomial distribution on the true label 𝑡𝑖, with probabilities
𝜋𝑗𝑘= 𝑝 𝑐𝑖𝑘 𝑡𝑖 = 𝑗, 𝜋𝑗𝑘). Both parameters 𝜋𝑘 and 𝜿 have
Beta-distributed priors.
The joint distribution over all variables for the binary IBCC model is
𝑝 𝜿, 𝝅, 𝑻, 𝑪 𝑨, 𝒗 = 𝜅𝑡𝑖 𝜋𝑡𝑘𝑖∙ 𝑐𝑖
𝑘 𝐾
𝑘=1 𝑝 𝜿 𝒗 𝑝 𝝅 𝑨
𝑁
𝑖=1 (1)
where 𝝅 = 𝜋𝑗𝑘 𝑗 ∈ 1,0 , 𝑘 = 1 … 𝐾} denotes all base classifier probabilities, 𝑨 = 𝛼𝑗𝑘 𝑗 ∈ 1,0 , 𝑘 = 1, … , 𝐾} the corresponding set of hyper-parameters, and 𝒗 = [𝑣0, 𝑣1] are
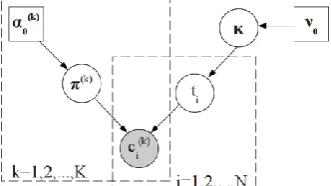
the hyper-parameters for 𝜿. A graphical model of IBCC is shown in Fig. 2.
Fig. 2. Graphical model for IBCC. The arrows indicate dependencies, the shaded node represents observed variables, and the square nodes are hyper-parameters. All other variables must be inferred. Here the predictions
𝒄𝒊𝒌 of each base classifier 𝒌 are generated dependent on the confusion matrices 𝝅^𝒌 and the true label 𝒕𝒊.
The probability of a test point 𝑡𝑖 at epoch 𝑖 being assigned class 𝑗 is given by
𝑝 𝑡𝑖= 𝑗 = 𝜌𝑖𝑗
𝜌𝑖𝑦 𝐽 𝑦 =1
(2)
where
𝜌𝑖𝑗 = 𝜅𝑗∗ 𝐾𝑘=1 𝜋𝑗𝑘∙ 𝒄𝑖𝑘 (3)
Which accounts for the probability of the class 𝜅𝑗
weighted by the combined prediction probabilities 𝜋𝑗𝑘 of each stream‟s independent predictions 𝒄𝑖𝑘.
A key feature of IBCC is that each base classifier 𝑘 is modeled by 𝝅𝑘, which intuitively represents a confusion matrix that quantifies the decision-making abilities of the individual base classifier 𝑘. The goal of inference for the model is to optimize the distributions over the unknown variables 𝑻, 𝝅, 𝜿 such that the probability of 𝑡𝑖 for each
epoch 𝑖 is maximized for epochs with true increases in the NFP and minimized for epochs 𝑖 where the NFP decreased. In [17] this approach has been shown to outperform a number of baseline combination methods for classification.
IV. SENTIMENT COMPOSITION
The majority approach towards the task of sentiment analysis is to treat it as a supervised classification task. Given a corpus of data which is annotated to reflect sentiment polarity you train a statistical classifier on this data, typically using word n-grams as features. These classifiers will usually give good results, and has the advantage of being language-independent in the sense that all one needs to do to move to a new language is to find a sufficiently large annotated corpus.
The disadvantage of such approaches is that they typically fail to deal well with classification at a level below that of a whole document, such as sentences or entities. They also - unless specific examples happen to fall within the n-gram range used - fail to deal with the compositional aspects of range used - fail to deal with the compositional aspects of sentiment described in [15], [18], [19], where, for example, the fact that „unemployment‟ in general is judged as a negative word, whereas „lower unemployment‟ is generally a positive attribute, but „failed to lower unemployment‟ is again negative. Another good example is the word „clever‟ which in isolation is positive, but „too clever‟ is negative, whereas, unpredictably, „not too clever‟ is again negative.
Various approaches have been advocated to deal with these surprisingly frequent phenomena, a very recent example being [20]. However, we use the language-specific compositional techniques described in [15] and available to us via a commercial API supplied by TheySay Analytics Ltd (www.theysay.io).2 This system carries out part-of-speech tagging followed by chunking and dependency parsing, and uses the resulting syntactic analysis to apply a large set of recursive compositional sentiment polarity rules to assign sentiment scores to each relevant linguistic unit.
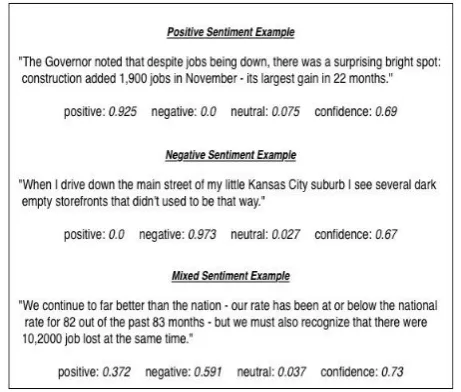
Fig. 3. Examples of sentences with different sentiment distributions accounting for the positive, negative, and neutral dimensions of a sentence.
We chose to use a compositional approach because it gives us control over the granularity at which we get sentiment distributions, at any linguistic level from morphemes up to a whole document, and because the results of analysis for particular examples are transparent and open to justification or challenge, a valuable property if we want to fine-tune the system to a particular domain or to justify its findings in the context of an application. In this particular setting we have begun with sentence level sentiment scores. Fig. 3 shows some example results returned from the sentiment composition model.
At the sentence level, sentiment is expressed in terms of a three-dimensional distribution over positive, negative, and neutral sentiment probabilities with an additional confidence score. The sentiment scores derived from the compositional analysis reflect the scope and intensity of the sentiment assigned, normalized to behave like a true probability. The associated confidence score is derived from properties of the linguistic analysis and reflects the model‟s belief that the underlying syntactic analysis (and corresponding sentiment assignment) is correct.
More specifically, the model‟s confidence scores reflect possibilities for errors in the analysis rather than conventional probability estimations against training data, and are calculated from various compositional and non-compositional complexity indicators. For example, a long sentence which has (i) a large number of positive and negative sentiment carriers, (ii) many sentiment reversal operators, and (iii) many three-or two-way ambiguous sentiment carriers necessarily requires a greater number of more complex sentiment composition steps to be executed compared to a short three-word sentence. Since each composition step can potentially yield an incorrect or unexpected sentiment prediction, the overall confidence of the compositional model can be estimated on the basis of the possibilities for errors in the analysis.
V. DATA
In this section we briefly describe the text data we collected to test our streaming prediction framework. Our tests spanned the NFP index monthly from January, 2000 through December, 2012. We ran pointed queries against a
large news database3 and collected archived test data from nearly 700 distinct online text sources such as the Associated Press, Dow Jones, Wall Street Journal, etc.. Altogether we collected over 6.6 million sentences of raw text from the streams.4 Statistics of some of the data streams is given in Table I.
TABLE I: EXAMPLE SOURCE-SPECIFIC STATISTICS FOR WORDS AND SENTENCES CONTAINED IN SIX OF THE TEXT STREAMS
Training Testing
Source Sentences Words Sentences Words
Associated Press 46K 385K 8K 53K
Dow Jones 182K 2.45M 54K 630K
Reuters News 122K 1.28M 47K 427K
Market News Intl. 304K 2.22M 81K 583K
Wall Street Journal 61K 660K 15K 150K
After we collected the text data we processed the sentences for individual sentiment analysis using the model in Section IV so each sentence is represented as a distribution over three dimensions of sentiment: positive, negative, and neutral. It remains to be seen how to use to the per-sentence sentiment distributions so they correlate with the trends of the NFP and economy. In the next section we report on our experiments for prediction using these sentiment dimensions as features.
VI. EXPERIMENTS
In this section we describe the experiments and results for predicting the NFP. Here we use the streaming framework and IBCC model described in Section III along with the sentiment composition model outlined in Section IV and the features explored above.
A. Experimental Setup
Our experimental setup is straightforward. As described in Section 5 we collected data over a timeline of 13 years from 2000-2013 which contained 156 monthly epochs. We used the last 24 epochs as test points and the rest of the epochs in the timeline as training points. However, as the economy normally tends to grow outwith periods of recession, as previously discussed, there is an over representation of 109 (70%) positive cases compared to only 47 (30%) negative instances in the NFP index since 2000. To ascertain whether our approach is valid for learning good predictions rather than just optimising for the overrepresented class we subsampled randomly from the positive class to obtain a balanced training set with equal class representation.
3 http://www.dowjones.com/factiva/index.asp
B. Sentiment Features and Results
For each text source we learnt a base classifier independently and used rolling predictions so the text associated with a test point became part of the training data for the next test epoch. These models were then used as base inputs for IBCC. Note that the stream-specific classifiers need not give good individual prediction results as long as each contain useful information. In fact base classifiers with very poor accuracy may be useful as IBCC can account for negative results so long as there is consistent information encoded in the probabilities.
In this section we report on results predicting the NFP using various baseline measures as well as the outcome of the individual text stream classifications. Finally we report results using the IBCC model to aggregate multiple predictions into a single optimal prediction. We measure our results using the standard metric Area Under the Receiver
Operating Characteristic Curve (AUC). The AUC is the probability of ranking a positive example higher than a negative example and takes into account both true and false positive predictions [21].
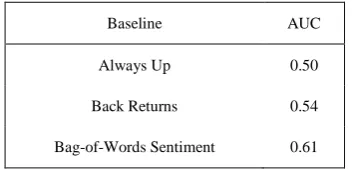
TABLE II: BASELINE RESULTS FOR PREDICTING THE (SUBSAMPLED) NFP INDEX
Baseline AUC
Always Up 0.50
Back Returns 0.54
Bag-of-Words Sentiment 0.61
Table II reports some baseline measures of prediction standard for the NFP. Always Up is just as it sounds and always predicts the NFP as rising with a probability of 1. We also used the industry standard of Back Returns and predict each epoch will follow the trend of the last. Both of these achieve an AUC around 0.5 which is as expected since subsampling makes the class likelihood equal.
Our final baseline shows the results of processing the text streams using features from the standard, bag-of-words approach to sentiment classification. To do this we trained a support vector machine (SVM) classifier using the n-grams from training examples from standard gold labelled data sets such as the MPQA Opinion Corpus, Senseval2007, and others [22], [23]. The best individual text stream result using the SVM classifier was an AUC of 0.61 which is better than the other baselines. Interestingly the IBCC model was unable to improve upon this result. This seems to indicate that there is little diversity in the per-stream predictive distributions when ignoring context for sentiment classification.
To address this we tested using the context heavy features obtained from the sentiment composition model for forecasting the NFP. Our general approach is to aggregate the sentence-specific sentiment distributions in some way over all sentences in an epoch to use as feature input into a simple logistic regression classifier models. We first compare the sentiment composition model with the bag-of-words baseline and correlate the percentage of positive versus negative sentences within an epoch to the NFP‟s up/down trend. To do this we assigned a single discrete label to each sentence, either ”positive”, ”negative” or ”neutral”, by selecting the
sentiment dimension with the highest value in its distribution.
TABLE III: STREAM-SPECIFIC AND COMBINED RESULTS FOR PREDICTING THE NFP INDEX. WE GET BETTER ACCURACY USING MULTIPLE SOURCES
(STARRED) WITH IBCC. (THE STARRED SOURCES RESULTED IN THE OVERALL BEST PREDICTIONS FROM ALL STREAM COMBINATIONS TESTED.)
1-Dimension 2-Dimension
Source Averages Averages Trends
Associated Press* 0.59 0.69 0.37
Dow Jones 0.45 0.44 0.25
Reuters News 0.50 0.46 0.36
Market News Intl.* 0.66 0.70 0.23
Other Sources* 0.58 0.63 0.63
Wall Street Journal 0.44 0.63 0.53
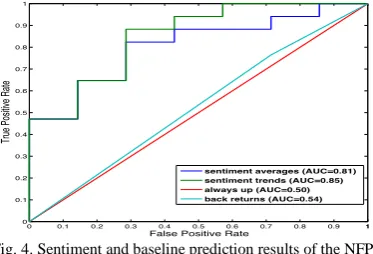
IBCC 0.67 0.81 0.85
The results for using only a single sentiment feature per sentence are shown in the first results column of Table III. For completeness we show each individual, uncombined stream result. Using the IBCC model, we also tested numerous combinations of the various text sources. In Table III, using the starred sources resulted in the best accuracy obtained for all combinations tested. We only report on our most accurate IBCC result here due to space limitations.
Using the simple approach of a single sentiment feature per sentence and correlating the majority sentiment dimension per epoch with the trend of the NFP beats the baseline results by a margin. We see that using the sentiment composition model gives better results than using the bag-of-words classifier due to the context of each sentence being accounted for. Still here, however, the IBCC model is unable to improve much upon the best base classifier‟s results.
We then accounted for multiple dimensions of the per-sentence sentiment distributions. For each sentence, we treated the probability scores for each dimension of the sentiment, positive or negative, as a count which we sum over for each epoch. We then use the sum totals as feature input into a logistic classifier. For example, the second results column in Table III shows the results when we use the percentages of word-weighted positive versus negative sentiment for each epoch for NFP trend prediction. Clearly this approach has better accuracy than using a single dimension of sentiment per sentence when used in conjunction with the IBCC model.
The third results column of Table III shows another approach using all the dimensions of sentiment available but using the differences in the counts between epochs as features. The idea behind this approach is intuitive and assumes the trends of sentiment implicit in the text should correlate with the trends of the economy. A raised level of negativity in the news media compared to normal would reflect a period of economic difficulty and vice versa for positive sentiment in the news. We can see this approach achieves a good measure of correlation between the text sentiment and the trends of the NFP.
over the baseline results individually. However, as the final line of Table III shows, we can achieve significantly higher accuracies than the baselines or from any single source using a combination of streams within the IBCC framework provided there is useful, complementary information from each source. Note again, we tested many combinations of the text streams as weak inputs into IBCC. We found our predictive results varied widely depending on which text sources were used. Here we only report the results using the stream combination that resulted in the highest prediction accuracy.
Fig. 4. Sentiment and baseline prediction results of the NFP.
Fig. 4 depicts the AUC differences between the baselines and our final IBCC results. Clearly we are learning something of interest using our streaming framework and associated combination model. The improvement gained by combining text streams is not surprising given previous work on ensemble methods and classifier combination. Where base classifiers provide complementary information or have uncorrelated random errors, a combination can reduce errors. Therefore, we believe the improvement when using IBCC is not due to including any single strong base classifier, but due to using a combination.
VII. CONCLUSION
Using news streams and other text sources to make economic predictions is an area that has generated significant interest in the last decade. Our results show clearly there is predictive information within economic news that we can access via selecting intuitive features from the sentiment analysis of the text. The scope of this type of economic prediction has many potential applications both in further academic and econometric research to more direct financial and market orientated ones. While there is large scope for future work on using sentiment of big WWW text data for economic predictions, we believe the research we have reported in this paper is a step forward in the literature in this area.
REFERENCES
[1] P. Savor and M. Wilson, “How much do investors care about macroeconomic risk? evidence from scheduled economic announcements,” Journal of Financial and Quantitative Analysis, vol. 48, pp. 1–62, March 2013.
[2] V. Lavrenko, M. Schmill, D. Lawrie, P. Ogilvie, D. Jensen, and J. Allan, “Mining of concurrent text and time series,” in Proc. the 6th ACM SIGKDD Int’l Conference on Knowledge Discovery and Data
Mining Workshop on Text Mining, 2001, pp. 37–44.
[3] R. P. Schumaker and H. Chen, “Textual analysis of stock market prediction using breaking financial news: the azfin text system,” ACM
Trans. Inf. Syst., vol. 27, no. 2, pp. 12:1–12:19, 2009.
[4] D. P. Fan, “Predicting the index of consumer sentiment when it isnt measured,” in JSM Proceedings, Alexandria, VA: American Statistical Association, 2010, pp. 6098-6110.
[5] M. A. Mittermayer and G. Knolmayer, “Text mining systems for market response to news: a survey,” in Proc. the IADIS European
Conference Data Mining, 2007.
[6] A. Nikfarjam, E. Emadzadeh, and S. Muthaiyah, “Text mining approaches for stock market prediction,” in Proc. 2010 The 2nd
International Conference on Computer and Automation Engineering,
2010, vol. 4, pp. 256–260.
[7] H. Choi and H. R. Varian, “Predicting the present with google trends,”
The Economic Record, vol. 88, no. s1, pp. 2–9, 2012.
[8] H. Mao, S. Counts, and J. Bollen, “Predicting financial markets: comparing survey, news, twitter and search engine data,” CoRR, 2011. [9] T. Preis, D. Reith, and H. E. Stanley, “Complex dynamics of our economic life on different scales: insights from search engine query data,” Philosophical Transactions of the Royal Society A:
Mathematical, Physical and Engineering Sciences, vol. 368, no. 1933,
pp. 5707–5719, 2010.
[10] J. Bollen, H. Mao, and X. J. Zeng, “Twitter mood predicts the stock market,” J. Comput. Science, vol. 2, no. 1, pp. 1–8, 2011.
[11] N. A. Smith. (2010). “Text-driven forecasting,” [Online]. Available: www.cs.cmu.edu/˜nasmith/papers/smith.whitepaper10.pdf
[12] V. Chahuneau, K. Gimpel, B. R. Routledge, L. Scherlis, and N. A. Smith, “Word salad: Relating food prices and descriptions,” in Proc. the 2012 Joint Conference on Empirical Methods in Natural Language
Processing and Computational Natural Language Learning, Jeju
Island, Korea, July 2012, pp. 1357–1367.
[13] T. Preis, H. S. Moat, and H. E. Stanley, “Quantifying trading behavior in financial markets using google trends,” Scientific Reports, vol. 3, April 2013.
[14] T. Furche, G. Gottlob, G. Grasso, C. Schallhart, and A. Sellers, “Oxpath: a language for scalable data extraction, automation, and crawling on the deep web,” The VLDB Journal,pp. 1–26, 2012. [15] K. Moilanen and S. Pulman, “Sentiment composition,” in Proc. Recent
Advances in Natural Language Processing, September 27-29, 2007, pp.
378–382.
[16] Z. Ghahramani and H. C. Kim, “Bayesian classifier combination,”
Gatsby Computational Neuroscience Unit Technical Report, London,
UK, 2003.
[17] E. Simpson et al., “Dynamic bayesian combination of multiple imperfect classifiers,” Decision Making and Imperfection. Intelligent
Systems Reference Library, vol. 474, 2013.
[18] L. Polanyi and A. Zaenen, “Contextual lexical valence shifters,” in
Proc. the AAAI Spring Symposium on Exploring Attitude and Affect in
Text: Theories and Applications, 2004.
[19] Y. Choi and C. Cardie, “Learning with compositional semantics as structural inference for subsentential sentiment analysis,” in Proc. the 2008 Conference on Empirical Methods in Natural Language
Processing, Honolulu, Hawaii, October 2008, pp. 793–801.
[20] R. Socher, A. Perelygin, J. Wu, J. Chuang, C. Manning, A. Ng, and C. Potts, “Recursive deep models for semantic compositionality over a sentiment treebank,” in Proc. Conference on Empirical Methods in
Natural Language Processing, Seattle, USA, October 2013.
[21] K. A. Spackman, “Signal detection theory: valuable tools for evaluating inductive learning,” in Proc. the Sixth International
Workshop on Machine Learning, San Francisco, CA, USA, 1989, pp.
160–163.
[22] J. Wiebe, T. Wilson, and C. Cardie, “Annotating expressions of opinions and emotions in language,” Language Resources and
Evaluation, vol. 39, no. 2-3, 2005.
[23] E. Agirre, L. M`arquez, and R. Wicentowski, “SemEval-2007
workshop,” in Proc. the Fourth International Workshop on Semantic
Evaluations. Prague, Czech Republic, June 2007.
Abby Levenberg was born in Istanbul, Turkey in 1979. He obtained his BS in computer science from Chapman University in 2004. He got his MSc and PhD from the School of Informatics, University of Edinburgh in 2007 and 2011 respectively.
Stephen Pulman was born in Lincoln, England in 1949. He received his BA in honours english from London University in 1972, his MA in theoretical physics from Essex University in 1974, and his PhD also in linguistics from Essex University in 1977.
He is a professor of computational linguistics and natural language processing at the Department of Computer Science, University of Oxford. He researches and teaches on semantics and inference in natural language.
Karo Moilanen was born in Turku, Finland in 1975. His BA was in honors linguistics from the University of Manchester in 2001. His MSc was obtained in 2002 in computer science and applied psychology from the University of Bath. He received his PhD from University of Oxford in 2011 in computer science where his doctoral dissertation was on compositional sentiment analysis.
He is now the CTO and co-founder of TheySay Ltd. He is also a visiting academic at the Department of Computer Science, University of Oxford. His research and professional interests include computational sentiment, emotion, and affect analysis, computational stylistics, sociodemographic modelling, NLP in Social Media, real-world NLP pipelines, frameworks, and APIs.
Edwin Simpson was born in Reading, England in 1983. He attended the University of Bristol where he obtained a MEng in computer science in 2005. He is currently a PhD candidate in machine learning from the Robotics Group, Department of Engineering Science, University of Oxford where he expects to graduate early 2014.
He is currently beginning a postdoctoral research assistant position studying human-agent collectives. He is interested in the application of machine learning techniques for organizing co-operative groups of human and machine agents; the fusion of information from heterogeneous, potentially unreliable sources.
Stephen Roberts was born in London, England in 1965. He received his MPhys and his PhD in machine learning from the University of Oxford in 1987 and 1991 respectively.